. 2019 Jul 1;218(7):2150-2168.
doi: 10.1083/jcb.201805044. Epub 2019 May 21.

Augmin accumulation on long-lived microtubules drives amplification and kinetochore-directed growth

Affiliations

Augmin accumulation on long-lived microtubules drives amplification and kinetochore-directed growth

Ana F David et al. J Cell Biol. .

Abstract

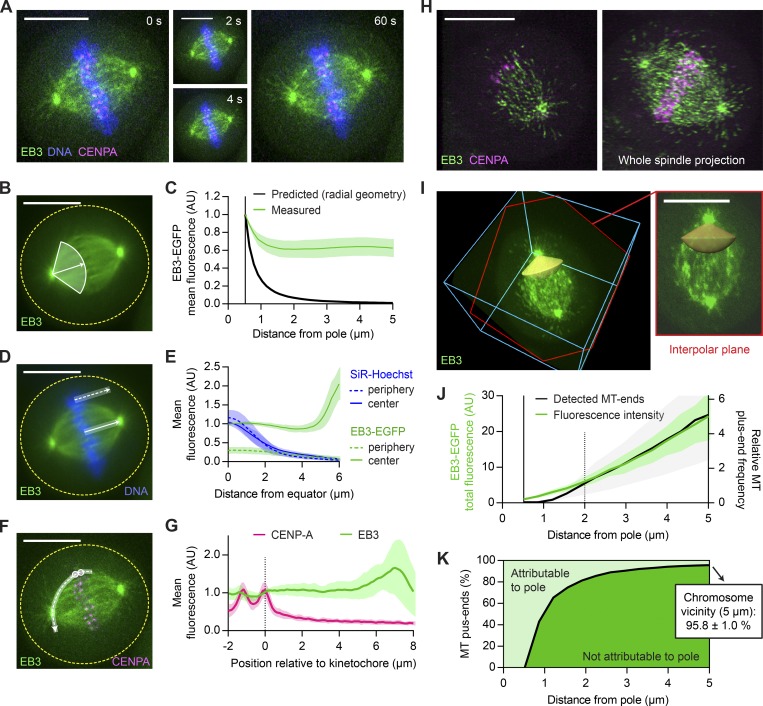
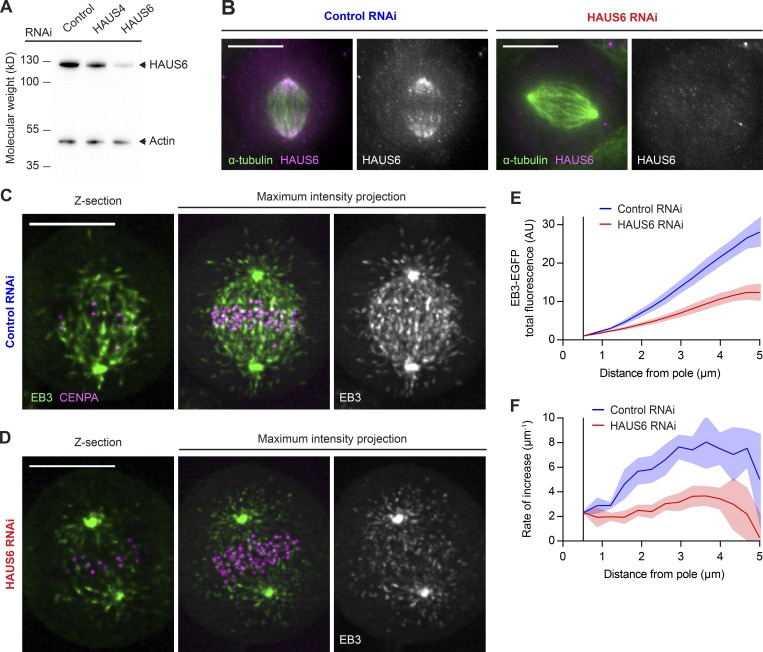
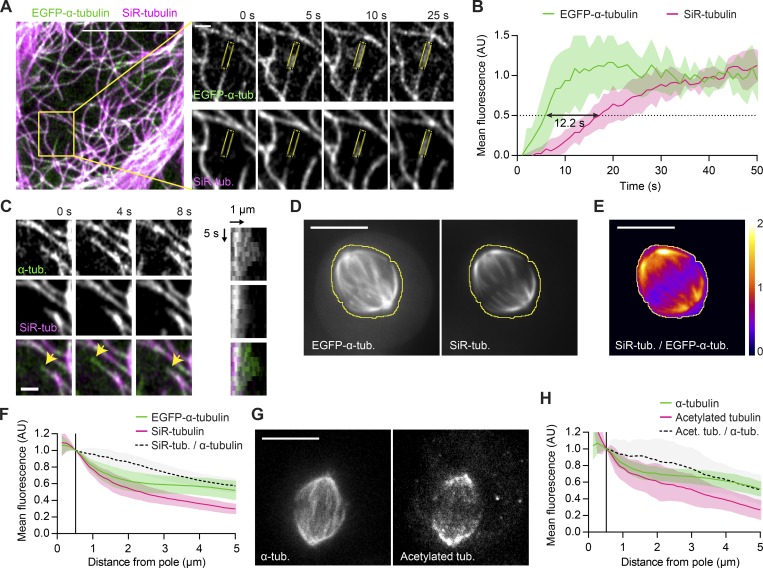
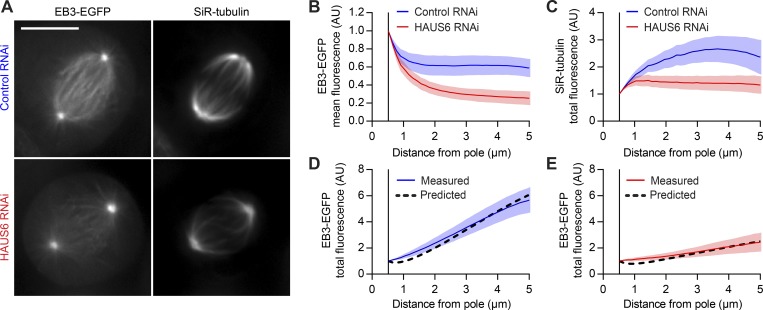
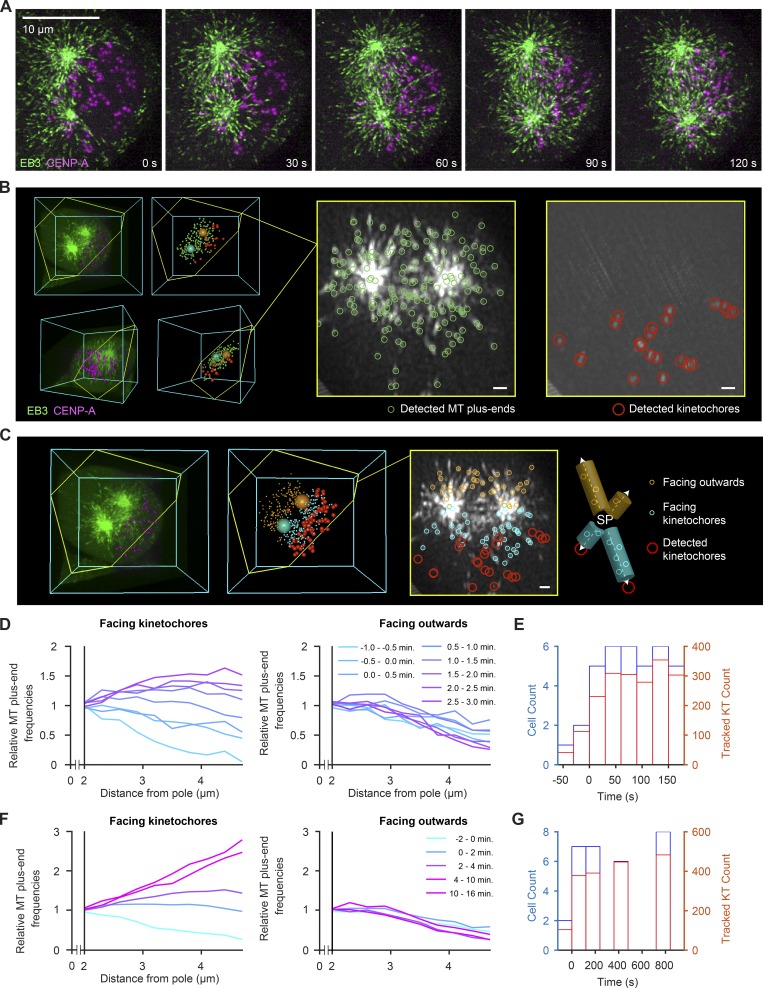
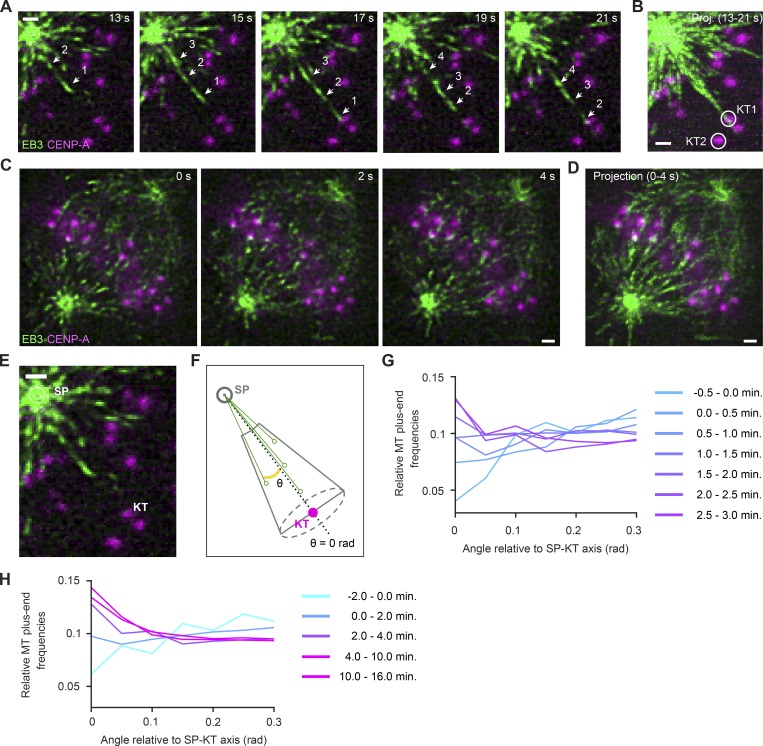
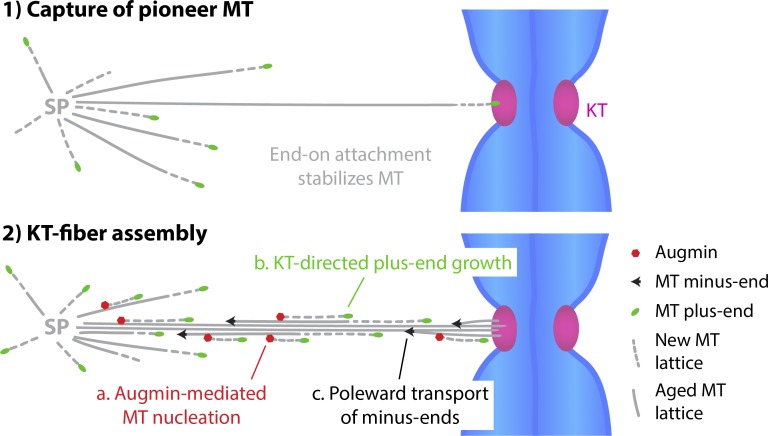
Dividing cells reorganize their microtubule cytoskeleton into a bipolar spindle, which moves one set of sister chromatids to each nascent daughter cell. Early spindle assembly models postulated that spindle pole-derived microtubules search the cytoplasmic space until they randomly encounter a kinetochore to form a stable attachment. More recent work uncovered several additional, centrosome-independent microtubule generation pathways, but the contributions of each pathway to spindle assembly have remained unclear. Here, we combined live microscopy and mathematical modeling to show that most microtubules nucleate at noncentrosomal regions in dividing human cells. Using a live-cell probe that selectively labels aged microtubule lattices, we demonstrate that the distribution of growing microtubule plus ends can be almost entirely explained by Augmin-dependent amplification of long-lived microtubule lattices. By ultrafast 3D lattice light-sheet microscopy, we observed that this mechanism results in a strong directional bias of microtubule growth toward individual kinetochores. Our systematic quantification of spindle dynamics reveals highly coordinated microtubule growth during kinetochore fiber assembly.


Figures

Figure 1.
Figure 1.
The majority of MT plus ends that reach metaphase chromosomes do not originate from spindle poles. (A–G) Live-cell confocal microscopy of HeLa cells expressing EB3-EGFP (green) and mCherry-CENPA (magenta), stained with SiR-Hoechst (blue). (A) Metaphase cell imaged for 1 min at 2 s/frame (see Video 1). (B and C) Quantification of MT plus end distribution from the spindle poles (see Materials and methods for details). (B) All time frames were registered to correct for spindle rotation (see Video 3) and projected to obtain mean-intensity images. EB3-EGFP fluorescence was measured in interpolar spindle regions, along a series of circumferential lines of increasing radius centered on the spindle poles. The quantification region extends from the pole to the spindle center (full white line; arrow indicates direction of the pole–pole axis). (C) Mean EB3-EGFP fluorescence measured as in B (n = 25 cells; individual measurements normalized to the centrosome rim). The black line indicates predicted signal dilution by radial geometry. (D and E) Quantification of EB3-EGFP and SiR-Hoechst fluorescence across the chromosome–cytoplasm boundary. (D) Mean intensities were profiled along lines placed either inside the spindle (full white line) or in its immediate periphery (dotted white line); results are plotted in E (n = 25 cells). (F) Quantification of fluorescence of EB3-EGFP and mCherry-CENPA along curved lines connecting pairs of sister KTs (dashed white line) to one of the spindle poles in maximum-intensity projections of three sequential video frames. (G) Mean intensity profiles, aligned to the midpoint between sister KTs (n = 42 profiles in 7 cells). (H–K) HeLa cells imaged during metaphase by 3D lattice light-sheet microscopy (n = 11). (H) Maximum-intensity projections of 5 (left) and 60 (right) consecutive slices of a deconvolved z-stack. (I) EB3-EGFP fluorescence was measured in nondeconvolved stacks inside conical ROIs defined around the interpolar axis (yellow). Shown is the same cell as in H; bounding box is 23 × 24 × 11 µm. The slice highlighted in red follows the plane defined by the spindle poles and a random KT. (J) Distribution of MT plus ends in interpolar spindle regions, estimated from the EB3-EGFP fluorescence measured as in I (green) or from the EB3-EGFP particles detected as in Fig. S1 F (black). Fluorescence intensities were normalized to the centrosome rim; the count profiles shown in Fig. S1 G were normalized to 2 µm from the spindle poles. (K) Fractions of MT plus ends attributable (light green) and not attributable (dark green) to nucleation at the spindle poles as a function of distance from the pole. Computed from the fluorescence measurements shown in J as detailed in Materials and methods. Lines and shaded areas denote mean ± SD, respectively. Scale bars, 10 µm. Yellow dotted lines indicate cell boundaries. AU, arbitrary units.
Figure 2.
Figure 2.
Most MT plus ends in metaphase spindles are generated in an Augmin-dependent manner. (A) HAUS6 protein levels analyzed by Western blotting in HeLa cells transfected with control, HAUS4-targeting, or HAUS6-targeting siRNAs. (B) HAUS6 and α-tubulin visualized by immunofluorescence in metaphase spindles of HeLa cells transfected with control or HAUS6-targeting siRNAs. (C and D) 3D lattice light-sheet microscopy of HeLa cells expressing EB3-EGFP (green) and mCherry-CENPA (magenta), transfected with either nontargeting control siRNAs (C) or siRNAs targeting HAUS6 (D). 2.5-min videos of metaphase cells were acquired at 1 s/frame. Deconvolved images are shown. (E) EB3-EGFP fluorescence intensities measured in interpolar regions of the spindle as in Fig. 1 I for control and HAUS6 RNAi cells (n = 7 and 11 cells, respectively, collected in two independent experiments). (F) First derivative of EB3-EGFP fluorescence profiles shown in E, indicating rate of increase for MT plus end numbers. Lines and shaded areas denote mean ± SD, respectively. Scale bars, 10 µm. AU, arbitrary units.
Figure 3.
Figure 3.
SiR-tubulin is a live-cell marker for long-lived MT stretches. (A) Live interphase HeLa cell expressing EGFP-α-tubulin incubated with 100 nM SiR-tubulin imaged at 1 s/frame (see Video 4). Insets show a typical MT growth event (scale bar, 1 µm); mean fluorescence intensities were quantified in ROIs as illustrated (yellow). (B) Quantification of mean fluorescence in growing MTs as illustrated in A (n = 13 MTs in 9 cells; individual profiles normalized to the mean values measured at t >30 s). Black arrow indicates lag time between the 50% fluorescence value of EGFP-α-tubulin and SiR-tubulin, respectively. (C) Selected example of a growing MT undergoing a catastrophe event (arrowheads point to EGFP-labeled growing tip). A kymogram is shown on the right. (D–F) A live EGFP-α-tubulin–expressing HeLa cell incubated with 50 nM SiR-tubulin. The yellow line denotes the spindle boundary. (E) Ratiometric image of SiR-tubulin/EGFP-α-tubulin, calculated based on temporal projections of 30-s videos for the cell shown in D. (F) Mean fluorescence intensities in interpolar regions quantified as in Fig. 1 (B and C; n = 35 cells). (G and H) Acetylated tubulin and α-tubulin visualized by immunofluorescence in metaphase spindles of HeLa cells (n = 26 cells imaged in two independent experiments). (H) Mean fluorescence intensities quantified in interpolar regions as in Fig. 1 (B and C). Lines and shaded areas denote mean ± SD, respectively. Scale bars represent 10 µm unless otherwise indicated. AU, arbitrary units.
Figure 4.
Figure 4.
Augmin-mediated MT amplification explains most of the plus end distribution in the metaphase spindle. (A) EB3-EGFP–expressing HeLa cells transfected with either nontargeting (control) or HAUS6-targeting siRNAs were incubated with 100 nM SiR-tubulin; average-intensity projections of registered videos. (B and C) EB3-EGFP (B) and SiR-tubulin (C) fluorescence, quantified as in Fig. 1 (B and C; n = 32 and 35 cells for control and HAUS6 RNAi cells, respectively). SiR-tubulin fluorescence in interpolar spindle regions (C) served as amplification template in a mathematical simulation of MT plus end density (see Fig. S5 C and Materials and methods for details). (D and E) Comparison between the predicted distributions of MT plus ends (black dashed line) and the measured EB3-EGFP total fluorescence for control (D) and HAUS6 RNAi (E) cells. Lines and shaded areas denote mean ± SD, respectively. Scale bars represent 1 µm unless otherwise indicated. AU, arbitrary units.
Figure 5.
Figure 5.
Noncentrosomal MTs increase in spindle regions facing toward KT already during early prometaphase. (A–C) HeLa cell expressing EB3-EGFP (green) and mCherry-CENPA (magenta), imaged during prometaphase by 3D lattice light-sheet microscopy. (A) Maximum-intensity projections of deconvolved video frames (t = 0 s, nuclear envelope disassembly). (B) Automated 3D detection of MT plus ends and KTs in EB3-EGFP and CENP-A images, respectively. The slice highlighted in yellow follows the plane defined by the spindle poles and a randomly chosen KT. The thickness of the projection is 600 nm. (C) Distribution of plus ends mapped to regions “facing KTs” and “facing outward.” MT plus ends facing KTs are mapped in 500-nm-wide cylinders around individual pole–KT axes, whereas MT plus ends facing outward are mapped to “mirror” cylinders facing the opposite direction. (D) Quantification of detected MT plus ends at increasing distances from the nearest spindle pole throughout early prometaphase (t < 5 min, n > 268 video frames analyzed per minute). Counts in individual cells are normalized to the value at 2 µm distance (lines denote mean; n = 9 cells). (E) Histograms of cell and KT counts for data shown in D. (F) Quantification of MT plus ends from early prometaphase to metaphase. Counts in individual cells are normalized to the value at 2 µm distance from the pole (lines denote mean, n = 22 cells). (G) Histograms of cell and KT counts for data shown in F. Scale bars, 10 µm.
Figure 6.
Figure 6.
MT growth direction is highly biased toward KTs. (A–E) Lattice light-sheet microscopy of EB3-EGFP and mCherry-CENPA–expressing HeLa cells. Scale bars, 1 µm. (A and B) KT-directed MT growth in an early prometaphase cell; detail of video shown in Fig. 5 A (t = 0 s, nuclear envelope disassembly). (A) Each frame is a maximum-intensity projection of five z-sections, the center section being the focal place of the KT highlighted in B (KT1, circle). A series of MT plus ends are shown growing toward the KT (arrows). (B) Maximum-intensity projection of video shown in A. (C) KT-directed MT growth in a metaphase cell imaged at one stack of 50 z-sections/s. Each frame shows a single z-section. (D) Temporal projection of a 4-s interval, as shown in C. (E and F) Illustration of assay for automated quantification of MT growth direction relative to pole–KT axes. (E) Spindle poles and KTs were automatically detected as in Fig. 4 to calculate conical ROIs centered on pole–KT axes. MT plus ends at a distance <2 µm to the pole were not considered, as they were not reliably resolved as individual objects. (F) MT plus ends were mapped in conical ROIs, and for each, the angle of an axis connecting to the spindle pole was calculated relative to the pole–KT axis. Solid green circles on black arrows illustrate radial positions of MT plus ends. (G and H) Radial distributions of MT plus ends relative to spindle pole–KT axes. Each curve represents data from all detected KTs (sampled as described in Fig. 5, E and G) and MT plus ends for the indicated time interval relative to nuclear envelope disassembly (0 min). SP, spindle pole.
Figure 7.
Figure 7.
Model for k-fiber assembly. Once “pioneer” MTs generated at the spindle poles (SPs) attach to KTs, they become templates for Augmin-mediated amplification. Augmin accumulates on long-lived MT lattices and generates an increasing fraction of spindle MTs (a). This leads to a measurable KT-directed bias in MT plus end growth (b). Together with stabilization and poleward transport of MTs (c), this amounts to a strong positive feedback loop conducive to rapid k-fiber assembly.

References

    1. Aguet F., Antonescu C.N., Mettlen M., Schmid S.L., and Danuser G.. 2013. Advances in analysis of low signal-to-noise images link dynamin and AP2 to the functions of an endocytic checkpoint. Dev. Cell. 26:279–291. 10.1016/j.devcel.2013.06.019 - DOI - PMC - PubMed
    1. Athale C.A., Dinarina A., Mora-Coral M., Pugieux C., Nédélec F., and Karsenti E.. 2008. Regulation of microtubule dynamics by reaction cascades around chromosomes. Science. 322:1243–1247. 10.1126/science.1161820 - DOI - PubMed
    1. Bird A.W., and Hyman A.A.. 2008. Building a spindle of the correct length in human cells requires the interaction between TPX2 and Aurora A. J. Cell Biol. 182:289–300. 10.1083/jcb.200802005 - DOI - PMC - PubMed
    1. Brugués J., Nuzzo V., Mazur E., and Needleman D.J.. 2012. Nucleation and transport organize microtubules in metaphase spindles. Cell. 149:554–564. 10.1016/j.cell.2012.03.027 - DOI - PubMed
    1. Bucciarelli E., Pellacani C., Naim V., Palena A., Gatti M., and Somma M.P.. 2009. Drosophila Dgt6 interacts with Ndc80, Msps/XMAP215, and gamma-tubulin to promote kinetochore-driven MT formation. Curr. Biol. 19:1839–1845. 10.1016/j.cub.2009.09.043 - DOI - PubMed

Publication types