. 2019 May 21;12(582):eaav3048.
doi: 10.1126/scisignal.aav3048.

mTORC1 amplifies the ATF4-dependent de novo serine-glycine pathway to supply glycine during TGF-β1-induced collagen biosynthesis

Affiliations

mTORC1 amplifies the ATF4-dependent de novo serine-glycine pathway to supply glycine during TGF-β1-induced collagen biosynthesis

Brintha Selvarajah et al. Sci Signal. .

Abstract

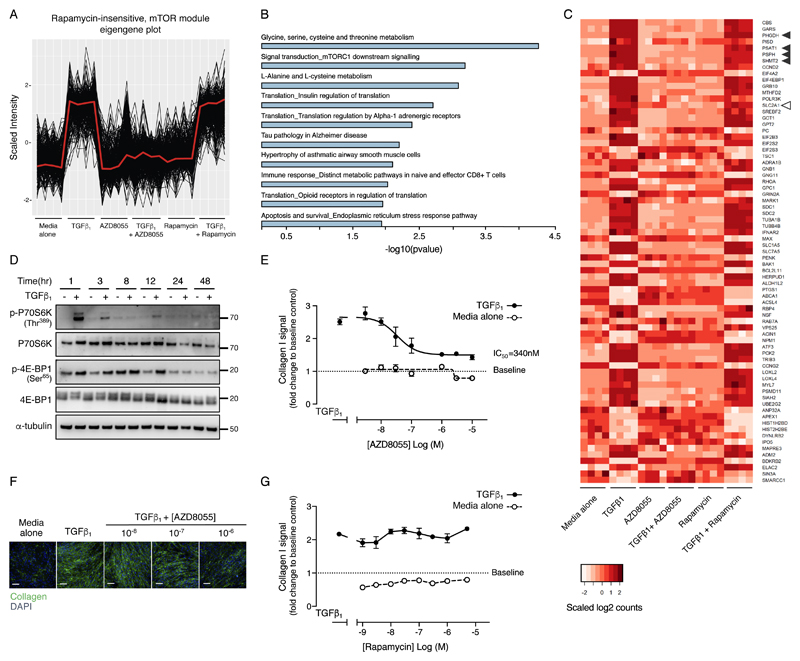
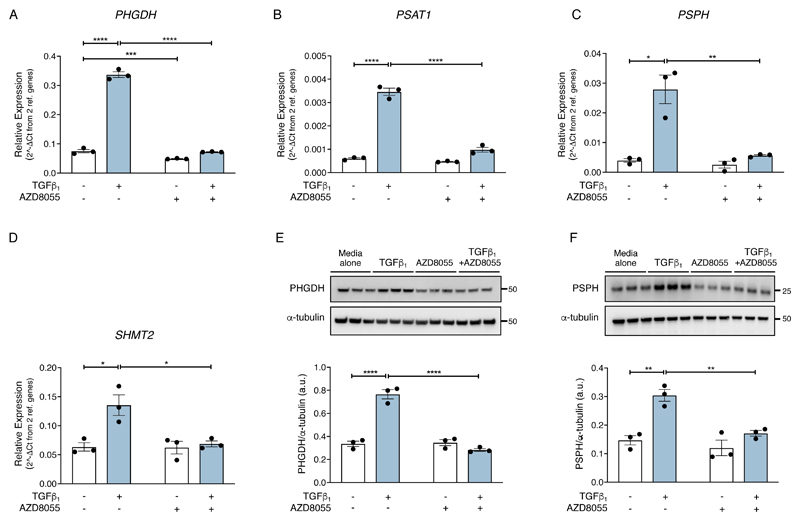
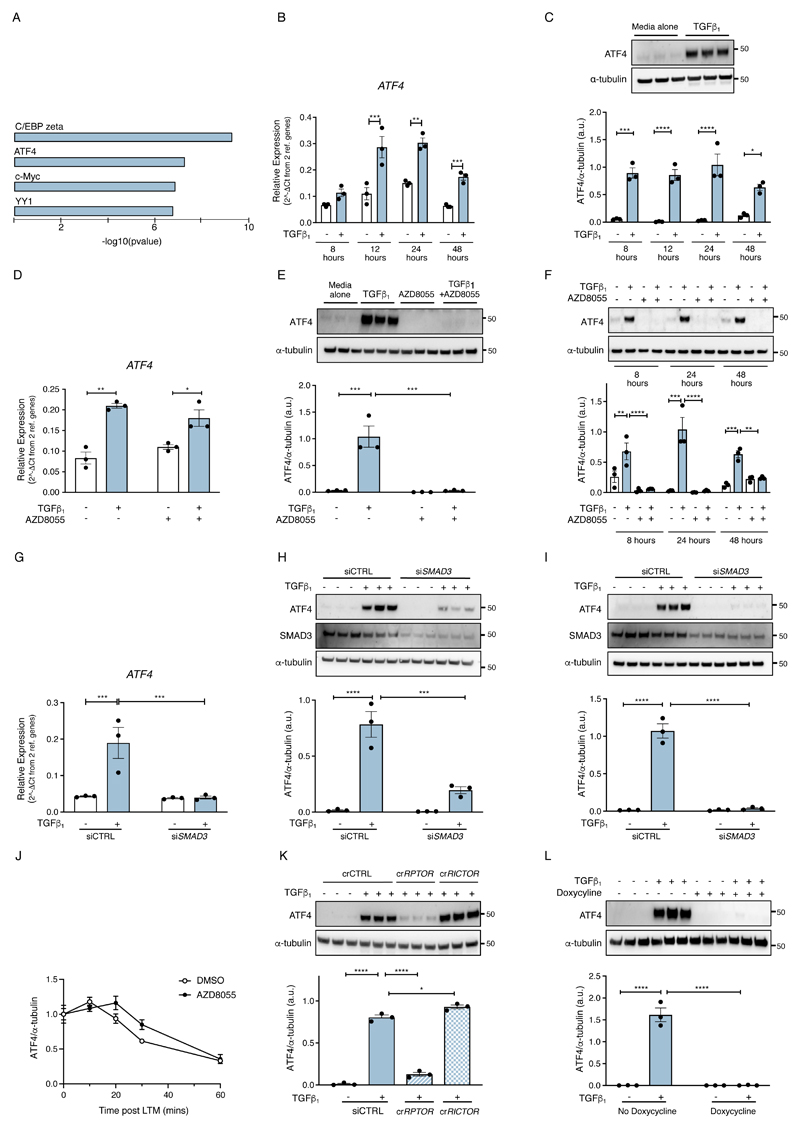
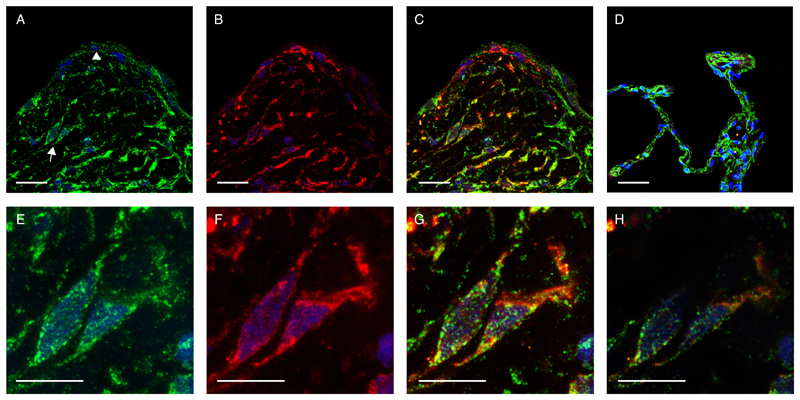
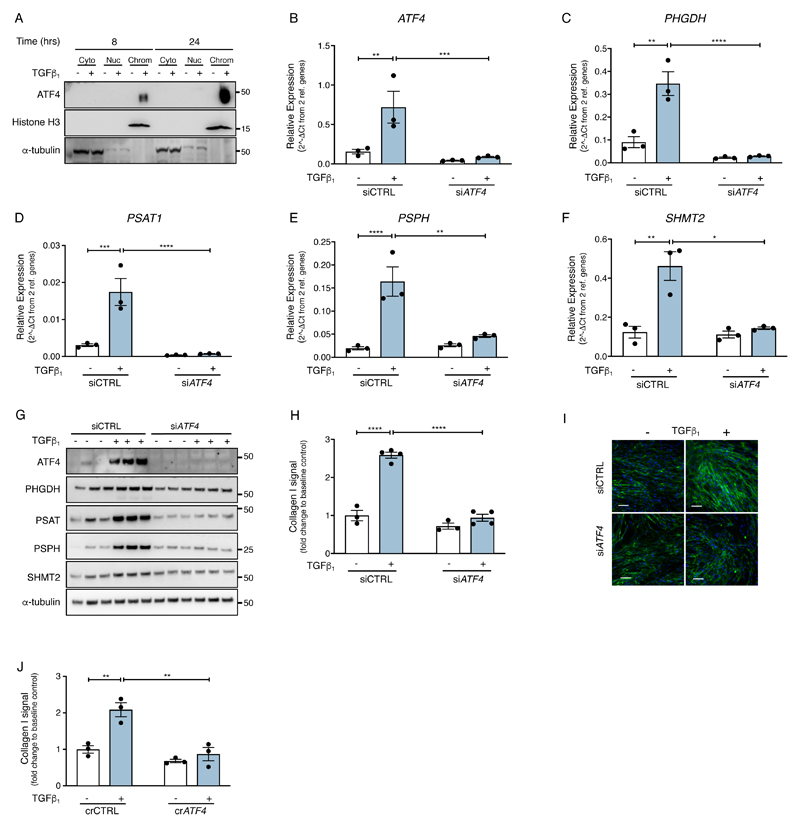
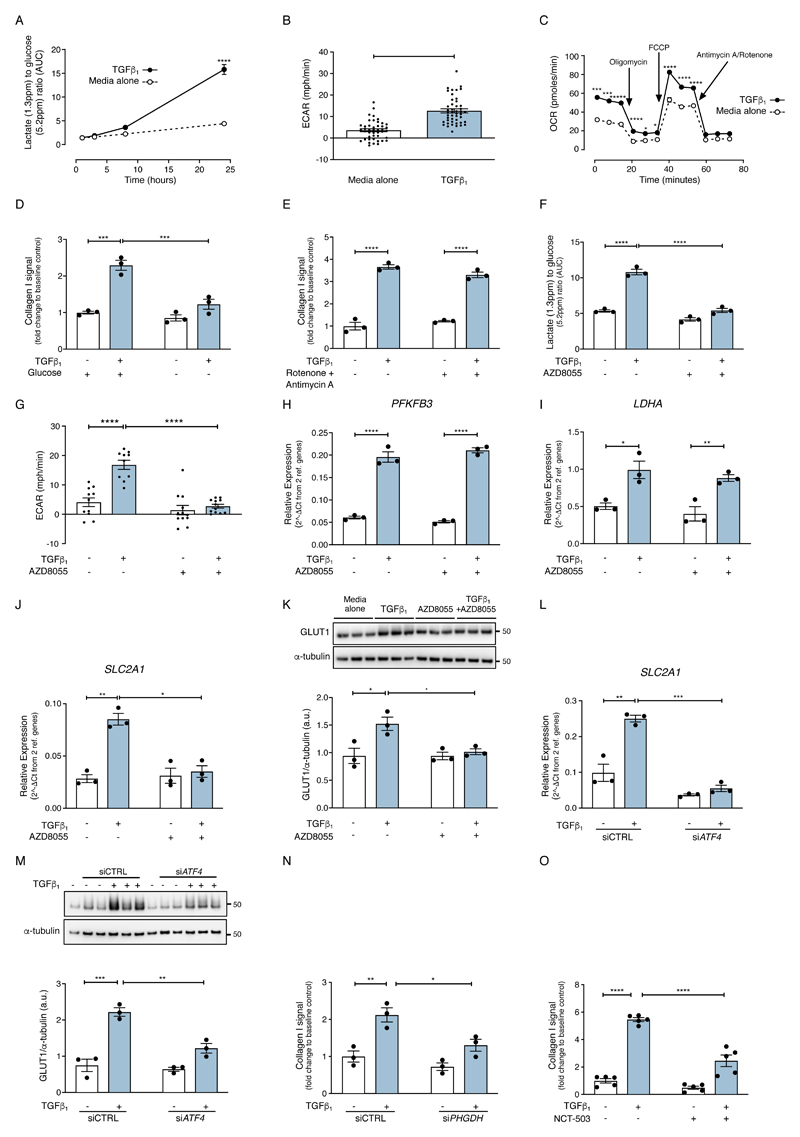
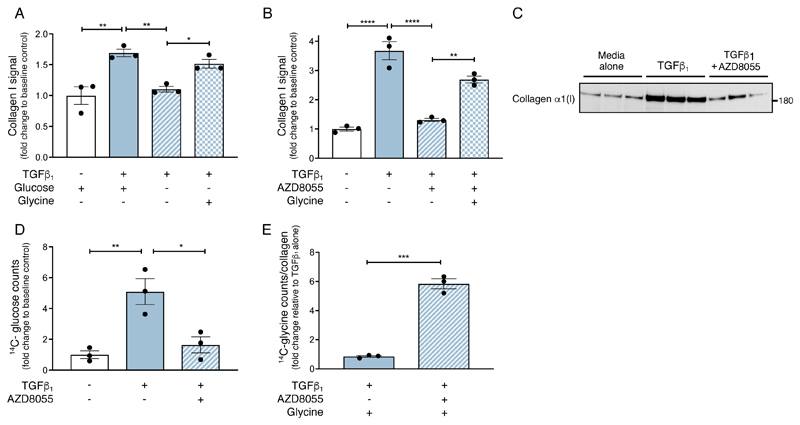
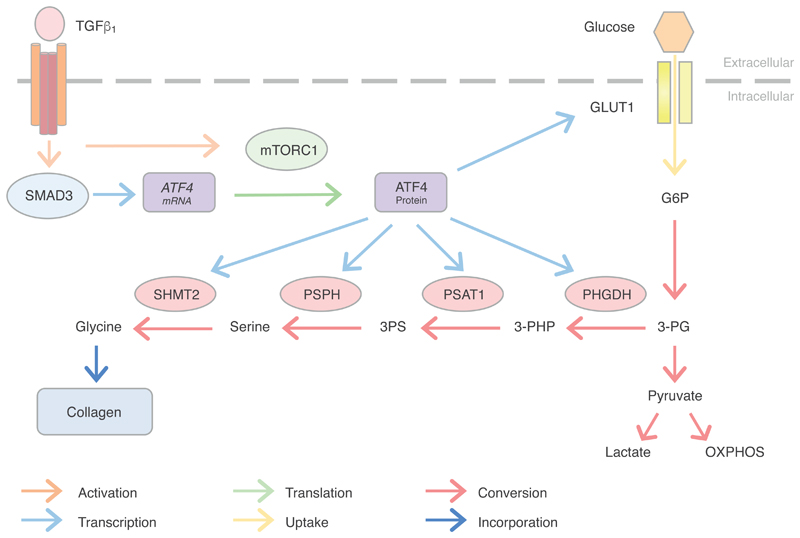
The differentiation of fibroblasts into a transient population of highly activated, extracellular matrix (ECM)-producing myofibroblasts at sites of tissue injury is critical for normal tissue repair. Excessive myofibroblast accumulation and persistence, often as a result of a failure to undergo apoptosis when tissue repair is complete, lead to pathological fibrosis and are also features of the stromal response in cancer. Myofibroblast differentiation is accompanied by changes in cellular metabolism, including increased glycolysis, to meet the biosynthetic demands of enhanced ECM production. Here, we showed that transforming growth factor-β1 (TGF-β1), the key pro-fibrotic cytokine implicated in multiple fibrotic conditions, increased the production of activating transcription factor 4 (ATF4), the transcriptional master regulator of amino acid metabolism, to supply glucose-derived glycine to meet the amino acid requirements associated with enhanced collagen production in response to myofibroblast differentiation. We further delineated the signaling pathways involved and showed that TGF-β1-induced ATF4 production depended on cooperation between canonical TGF-β1 signaling through Smad3 and activation of mechanistic target of rapamycin complex 1 (mTORC1) and its downstream target eukaryotic translation initiation factor 4E-binding protein 1 (4E-BP1). ATF4, in turn, promoted the transcription of genes encoding enzymes of the de novo serine-glycine biosynthetic pathway and glucose transporter 1 (GLUT1). Our findings suggest that targeting the TGF-β1-mTORC1-ATF4 axis may represent a novel therapeutic strategy for interfering with myofibroblast function in fibrosis and potentially in other conditions, including cancer.


Conflict of interest statement

Competing interests: R.C.C. declares receiving research funding for some of this work from a collaborative framework agreement from GlaxoSmithKline. A.T., G.B. and A.D.B. are employees of GlaxoSmithKline with a commercial interest in the area of investigation.

Figures

Fig. 1
Fig. 1. Global transcriptomic analysis of TGF-β1––stimulated fibroblasts by RNAseq analysis reveals a rapamycin-insensitive mTOR-dependent serine-glycine biosynthetic signature during TGF-β1––induced collagen deposition
(A) Plot showing scaled gene expression intensities from the rapamycin-insensitive mTOR module eigengene as calculated by WGCNA. The module eigengene is defined as the first principal component of the genes contained within the module and is representative of the gene expression profiles in the module. All expression values have been z transformed and signals that are negatively correlated to the module eigengene have been inverted for plotting (N=4 biological replicates). (B) Bar plot showing the top 10 most significantly enriched pathways for the genes in the rapamycin-insensitive mTOR module. The serine-glycine biosynthesis pathway was most enriched (p-value = 5.45E-5). (C) Heatmap representing the genes from the top 20 most enriched pathways in the rapamycin-insensitive mTOR module, listed in order of the most to the least statistically significant. Genes that map to more than one pathway only appear for the pathway with the most significant p-value. Scaled counts were used to generate the heatmap, where darker red indicates higher number of counts. Black arrowheads indicate the genes belonging to the glycine metabolism pathway and the clear arrowhead indicates the SLC2A1 gene (N=4 biological replicates). (D) Confluent primary human lung fibroblasts (pHLFs) were stimulated with media alone or media plus TGF-β1 and immunoblotting was performed for the indicated proteins (N=3 experiments, representative data shown). (E) Confluent pHLFs were pre-incubated with media plus vehicle (DMSO) or AZD8055 and stimulated for 48 h with or without TGF-β1. Collagen I deposition was assessed by high content imaging. IC50 value was calculated using four-parameter non-linear regression. Each data point shown is mean +/- SEM of the fold change to baseline of 3 biological replicates per condition and data are representative of 3 independent experiments. (F) Immunofluorescence staining showing collagen I deposition in pHLFs treated as in (E), scale bar =100 µm. (G) Confluent pHLFs were pre-incubated with media plus vehicle (DMSO) or rapamycin and stimulated for 48 hours with or without TGF-β1. Collagen I deposition was assessed by high content imaging. Each data point shown is mean +/- SEM of the fold change relative to baseline of 3 biological replicates per condition and the data are representative of 3 independent experiments.
Fig. 2
Fig. 2. TGF-β1 amplifies the serine-glycine pathway in an mTOR-dependent manner
Confluent pHLFs were incubated in media alone or media plus TGF-β1 with AZD8055 or vehicle control (DMSO) for 24 hours. (A-D) PHGDH, PSAT1, PSPH and SHMT2 relative mRNA abundance was quantified by RT-qPCR. Data are presented as means ± SEM from 3 biological replicates. (E, F) Immunoblots of protein lysates and densitometric quantification of PHGDH (E) and PSPH (F) (N=3 biological replicates and data are representative of 3 independent experiments). Differences between groups were evaluated by two-way ANOVA test with Tukey post-hoc test. *p<0.05, **p<0.01, ***p< 0.001, ****p< 0.0001.
Fig. 3
Fig. 3. Overconnected node analysis reveals a key role for mTOR in promoting ATF4 protein production
(A) Overconnected node analysis of the RNAseq data revealed a cluster of transcription factors associated with the serine-glycine module of enriched mRNAs. (B) Confluent pHLFs were incubated with or without TGF-β1 and ATF4 relative mRNA abundance was measured by RT-qPCR over time (data are means ± SEM from 3 biological replicates). (C) Immunoblots and densitometric quantification of ATF4 protein abundance in pHLF lysates over time following TGF-β1 stimulation. Immunoblot shown represents ATF4 at 8 hours post TGF-β1 stimulation. Data are expressed as mean ± SEM from 3 biological replicates. (D) Relative ATF4 mRNA abundance measured at 24 hours post-TGF-β1 stimulation (N=3 biological replicates). (E) Immunoblot and densitometric quantification of ATF4 abundance at 24 hours post-TGF-β1 stimulation (N=3 biological replicates). (F) Immunoblot and densitometric quantification of ATF4 abundance at indicated times post-TGF-β1 stimulation (N=3 biological replicates). (G) Confluent pHLFs were transfected with scrambled control siRNA (siCTRL) or Smad3 siRNA (siSMAD3) and incubated with or without TGF-β1 and ATF4 relative mRNA abundance at 24 hours was measured by RT-qPCR (N=3 biological replicates). (H, I) ATF4 immunoblots and densitometric quantification represent samples analyzed at 8 hours (H) and 24 hours (I) (N=3 biological replicates). (J) pHLFs were pre-treated with TGF-β1 for 13 hours before treatment with lactimidomycin and vehicle (DMSO) or AZD8055. Lysates were harvested at indicated times post-treatment and ATF4 abundance measured by immunoblotting and densitometric quantification (N=3 biological replicates). (K) pHLFs were modified by CRISPR-Cas9 gene editing of RPTOR or RICTOR and stimulated with TGF-β1. Immunoblot for ATF4 and densitometric quantification were performed at 24 hours (N=3 biological replicates). (L) pHLFs expressing a 4E-BP1-4A dominant-negative phospho-mutant were induced with doxycycline or media alone for 24 hours prior to TGF-β1 stimulation. Immunoblot for ATF4 and densitometric quantification were performed at 18 hours post TGF-β1 stimulation (N=3 biological replicates). Differences between groups were evaluated by two-way ANOVA test with Tukey post-hoc test (B-I, L), repeated measures two-way ANOVA (J) or one-way ANOVA with Tukey post-hoc test (K). *p<0.05, **p<0.01, ***p< 0.001, ****p< 0.0001.
Fig. 4
Fig. 4. ATF4 co-localises with a-SMA-positive myofibroblasts within IPF fibrotic foci
Immunofluoresence single staining for ATF4 (A, green), α-smooth muscle actin (B, α-SMA, red) and overlay of ATF4 and α-SMA (C, yellow) in a representative IPF fibrotic focus. (A) Arrow indicates myofibroblasts within the fibrotic focus and arrowhead points to the hyperplastic epithelium. Overlay of ATF4 and α-SMA in non-IPF lung tissue (D). (E-G) Corresponding high magnification images of myofibroblasts within the fibrotic focus (indicated by arrow in A) for ATF4(E), α-SMA(F) and overlay of ATF4 and α-SMA(G). (H) Mid-level non-composite confocal overlay image indicating nuclear localisation of ATF4 (green) in an α-SMA positive myofibroblast cell (<0.5 µm). All images counter-stained with DAPI (blue). Scale A-D = 50 µm, E-H = 25 µm, N=3 patients with IPF, N=2 control subjects and representative images shown.
Fig. 5
Fig. 5. ATF4-dependent modulation of the serine-glycine pathway is critical for TGF-β1–– induced collagen deposition
(A) Confluent pHLFs were incubated with media plus TGF-β1 or media alone for 8 or 24 hours prior to cell lysis and separation into cytoplasmic (Cyto), nuclear (Nuc) and chromatin (Chrom) fractions. Immunoblots were then performed as indicated. (B-F) Confluent pHLFs were transfected with scrambled control siRNA (siCTRL) or ATF4 siRNA (siATF4) before exposure to media plus TGF-β1 or media alone and the relative mRNA abundance of ATF4, PHGDH, PSAT1, PSPH and SHMT2 at 24 hours was measured by RT-qPCR (N=3 biological replicates). (G) Representative immunoblots for protein lysates treated as indicated in (B-F) are shown (N=3 biological replicates and data are representative of 3 independent experiments). (H) Confluent pHLFs were transfected with scrambled control siRNA (siCTRL) or ATF4 siRNA (siATF4) before exposure to media plus TGF-β1 or media alone and collagen deposition assayed by high content imaging after 48 hours. (Each data point shown is mean +/- SEM of the fold change relative to baseline of 3-4 biological replicates per condition and data are representative of 3 independent experiments). (I) Representative immunofluorescence images presented in (H) are shown, scale bar =100 µm. (J) Confluent wildtype and ATF4-/- crispred pHLFs were exposed to media plus TGF-β1 or media alone and collagen deposition assayed by high content imaging after 48 hours (each data point shown is mean +/- SEM of the fold change relative to baseline of 3 biological replicates per condition). Differences between groups were evaluated by two-way (B-F, H, J) ANOVA test with Tukey post-hoc test. *p<0.05, **p<0.01, ***p< 0.001, ****p< 0.0001.
Fig. 6
Fig. 6. mTOR amplifies glucose metabolism during TGF-β1––induced fibroblast collagen synthesis through an ATF4-dependent mechanism
Confluent pHLFs were exposed to media plus TGF-β1 or media only for 24 hours. (A) The AUC of lactate relative to AUC of glucose in cell supernatants was measured by NMR spectroscopy at the time points described (N=3 biological replicates and data are representative of 3 independent experiments). (B, C) Confluent pHLFs were exposed to media plus TGF-β1 or media only for 24 hours. Extracellular acidification rate and oxygen consumption rate were measured using the SeaHorse XF96e assay (N=46 biological replicates and data are representative of 3 independent experiments). (D-E) Confluent pHLFs were incubated in media deplete of glucose (D) or pre-incubated with rotenone and antimycin A (E) and stimulated for 48 hours with or without TGF-β1 and collagen deposition assessed by high content imaging. Each data point shown is mean +/- SEM of the fold change relative to baseline of 3 biological replicates and data are representative of 3 independent experiments. (F) Confluent pHLFs were pre-incubated with AZD8055 or vehicle control (DMSO) prior to exposure to media plus TGF-β1 or media alone. The AUC of the lactate peak relative to AUC of the glucose peak in cell supernatant was measured by NMR spectroscopy after 24 hours (N= 3 biological replicates and data are representative of 3 independent experiments). (G) The ECAR was assayed by SeaHorse XF96e after 24 hours with or without TGF-β1 stimulation (N=3 biological replicates and data are representative of 3 independent experiments). (H-K) Confluent pHLFs were pre-incubated with AZD8055 or vehicle control (DMSO) prior to TGF-β1 stimulation or media alone. Relative mRNA abundance of (H) PFKFB3, at 3 hours post TGF-β1 (I) LDHA and (J) SLC2A1, both at 24 hours post TGF-β1 was measured by RT-qPCR (N=3 biological replicates) and (K) immunoblot for GLUT1 and densitometric quantification were performed (N=3 biological replicates). (L) Confluent pHLFs were transfected with scrambled control siRNA (siCTRL) or ATF4 siRNA (siATF4) exposed to media plus TGF-β1 or media only and relative mRNA abundance of SLC2A1 at 24 hours was measured by RT-qPCR (N=3 biological replicates, data representative of 3 independent experiments). (M) Representative immunoblots of protein lysates derived from pHLFs treated in same conditions as (L) are shown (N=3 biological replicates). (N) Confluent pHLFs were transfected with scrambled control siRNA(siCTRL) or PHGDH siRNA (siPHGDH) and exposed to media plus TGF-β1 or media only for 48 hours and collagen deposition assessed by high content imaging (each data point shown is mean +/- SEM of the fold change relative to baseline of 3 biological replicates). (O) pHLFs were treated with PHGDH inhibitor, NCT-503 (or DMSO control) and stimulated with or without TGF-β1 for 48 hours. Collagen deposition was assessed by high content imaging, each data point represents mean +/- SEM of the fold change relative to baseline of 5 biological replicates per condition. Differences between groups were evaluated by unpaired t-test (B) or two-way ANOVA test with Tukey post-hoc test (A,C-O). *p<0.05, **p<0.01, ***p<0.001, ****p< 0.0001.
Fig. 7
Fig. 7. mTOR promotes glucose derived glycine biosynthesis to supply glycine during TGF-β1––induced collagen synthesis
(A) Confluent pHLFs were deprived of glucose for 24 hours and incubated with or without glycine, followed by incubation with or without TGF-β1 for 48 hours before assessment of collagen deposition by high content imaging (each data point shown is mean +/- SEM of the fold change relative to baseline of N=3 biological replicates per condition and data are representative of 3 independent experiments). (B) Confluent pHLFs were incubated with AZD8055 and supplemented 30 minutes later with or without glycine, then incubated with or without TGF-β1 for 48 hours before assessment of collagen deposition by high content imaging. Each data point shown is mean +/- SEM of the fold change relative to baseline of 3 biological replicates and data are representative of 3 independent experiments. (C) Confluent pHLFs were incubated with AZD8055 or DMSO and exposed to media plus TGF-β1 or media alone in the presence of 12C-glucose for 48 hours. Collagen α1(I) was isolated by immunoprecipitation and immunoblotted. (D) Confluent pHLFs were incubated with AZD8055 or DMSO and exposed to media plus TGF-β1 or media alone in the presence of U-14C-glucose for 48 hours. U-14C-glucose incorporation into immunoprecipitated collagen α1(I) was assessed by scintillation counting (N=3 biological replicates). (E) Confluent pHLFs were incubated with AZD8055 or DMSO and stimulated with TGF-β1 in the presence of U-14C-glycine for 48 hours. U-14C-glycine incorporation into immunoprecipitated collagen α1(I) was assessed by scintillation counting (N=3 biological replicates) and expressed relative to immunoprecipitated collagen α1(I) protein abundance determined in a parallel immunoblot. Differences between groups were evaluated by unpaired t-test (E) or one way (A,B,D) ANOVA test with Tukey post-hoc test. *p<0.05, **p<0.01, ***p< 0.001, ****p< 0.0001.
Fig. 8
Fig. 8. Proposed mechanism by which ATF4 promotes the reconfiguration of myofibroblast metabolic and biosynthetic networks to support enhanced collagen biosynthesis in response to TGF-β1 stimulation
TGF-β1 ligation of the TGF-β receptor complex leads to a Smad3 dependent increase in ATF4 mRNA abundance as well as mTOR activation. Activated mTORC1/4E-BP1 signaling in turn promotes ATF4 protein production through a translational mechanism. ATF4 subsequently promotes the transcriptional increase of SLC2A1/GLUT1 and key serine-glycine pathway genes. These then act together to promote glucose-derived glycine biosynthesis in order to support enhanced collagen synthesis rates in activated myofibroblasts. (TGF-β1: Transforming growth factor β1; mTORC1: mechanistic target of rapamycin complex 1; GLUT1: glucose transporter 1; G6P: glucose 6-phosphate; 3-PG: 3-Phosphoglycerate; PHGDH: phosphoglycerate dehydrogenase; 3-PHP: 3-phosphohydroxypyruvate; PSAT1: phosphoserine aminotransferase 1; 3PS: 3-phosphoserine; PSPH: phosphoserine phosphatase; SHMT2: serine hydroxymethyltransferase 2; OXPHOS: oxidative phosphorylation).

References

    1. Wynn TA. Common and unique mechanisms regulate fibrosis in various fibroproliferative diseases. J Clin Invest. 2007;117:524–529. - PMC - PubMed
    1. Coultas DB, Zumwalt RE, Black WC, Sobonya RE. The epidemiology of interstitial lung diseases. Am J Respir Crit Care Med. 1994;150:967–72. - PubMed
    1. King TE, et al. Idiopathic pulmonary fibrosis: relationship between histopathologic features and mortality. Am J Respir Crit Care Med. 2001;164:1025–32. - PubMed
    1. Richeldi L, et al. Efficacy and safety of nintedanib in idiopathic pulmonary fibrosis. N Engl J Med. 2014;370:2071–82. - PubMed
    1. King TE, et al. A phase 3 trial of pirfenidone in patients with idiopathic pulmonary fibrosis. N Engl J Med. 2014;370:2083–92. - PubMed

Publication types

MeSH terms