. 2019 May 21;10(1):2261.
doi: 10.1038/s41467-019-08620-4.

Development of human cGAS-specific small-molecule inhibitors for repression of dsDNA-triggered interferon expression

Affiliations

Development of human cGAS-specific small-molecule inhibitors for repression of dsDNA-triggered interferon expression

Lodoe Lama et al. Nat Commun. .

Abstract

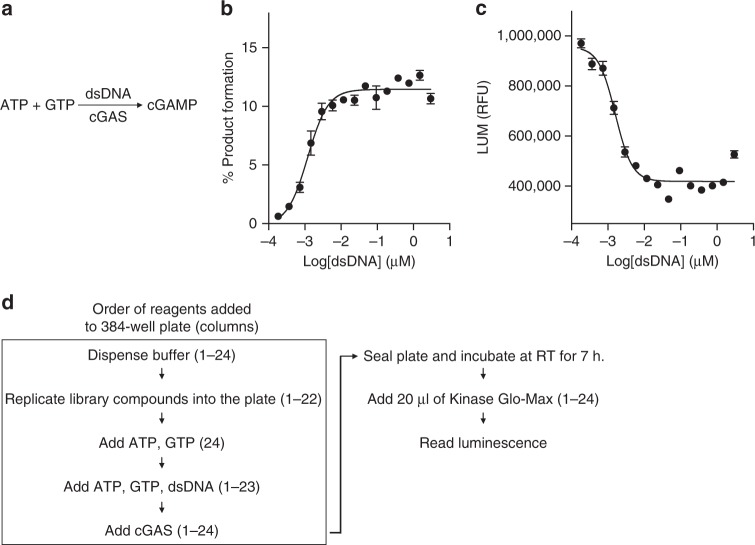
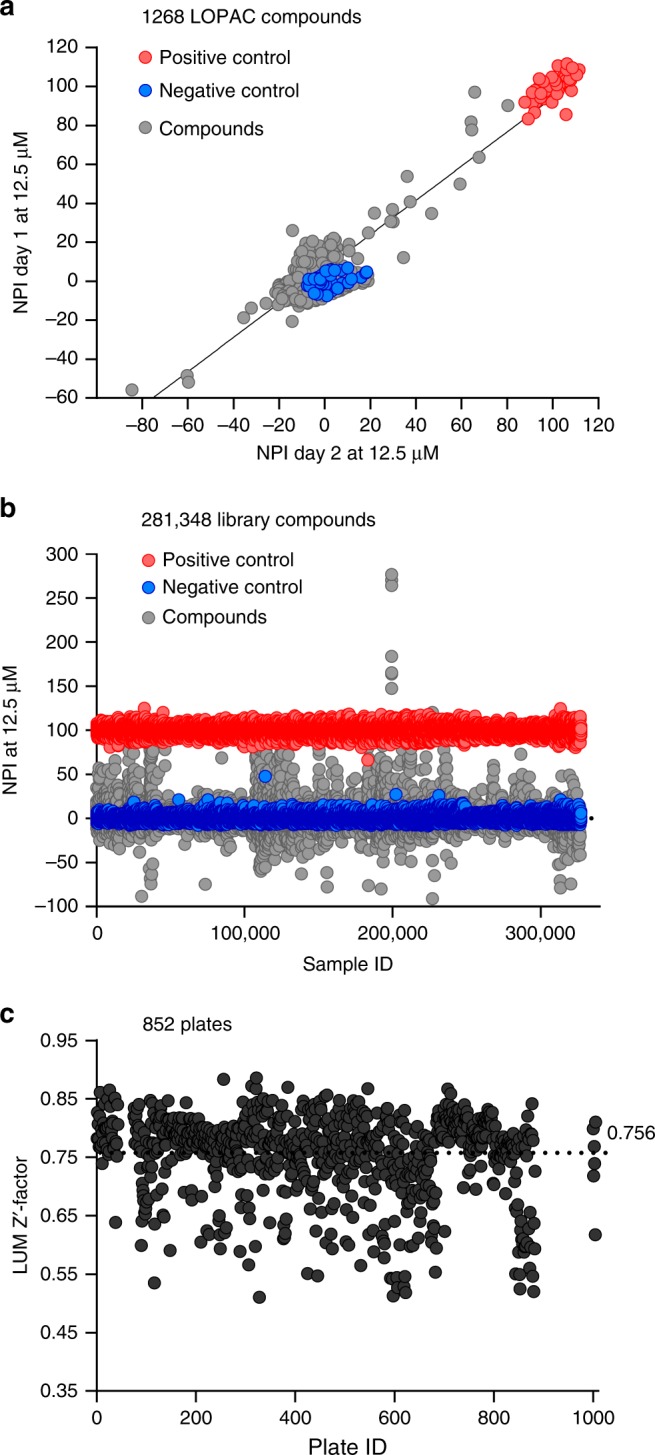
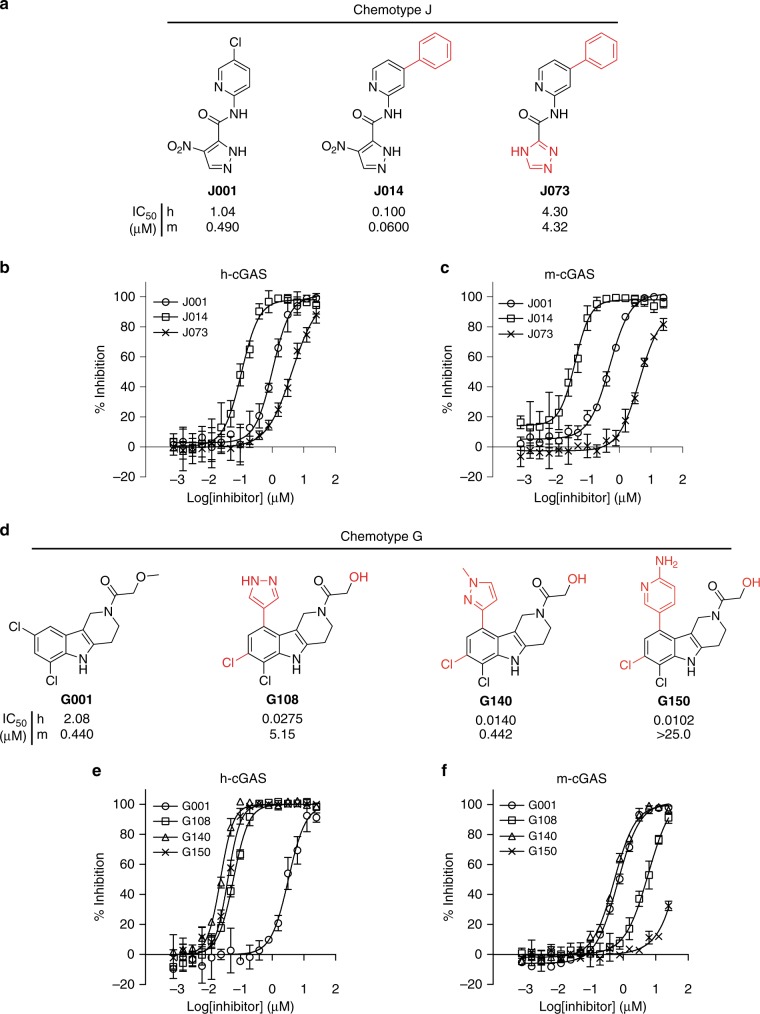
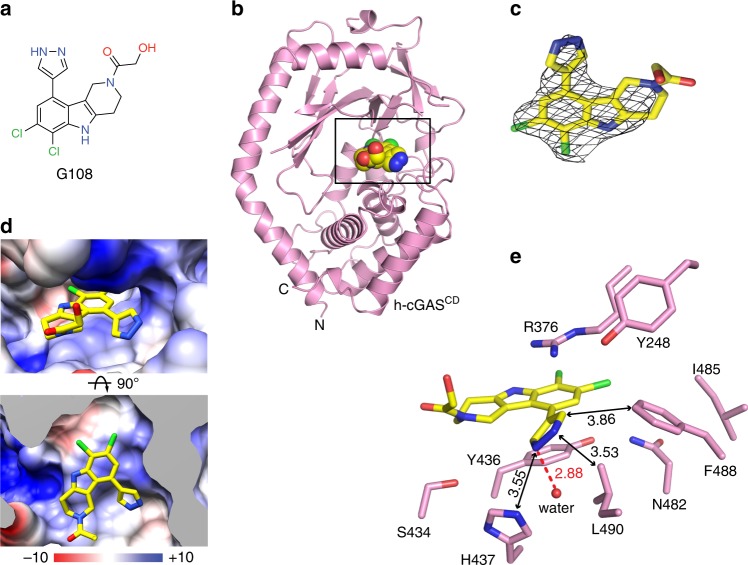
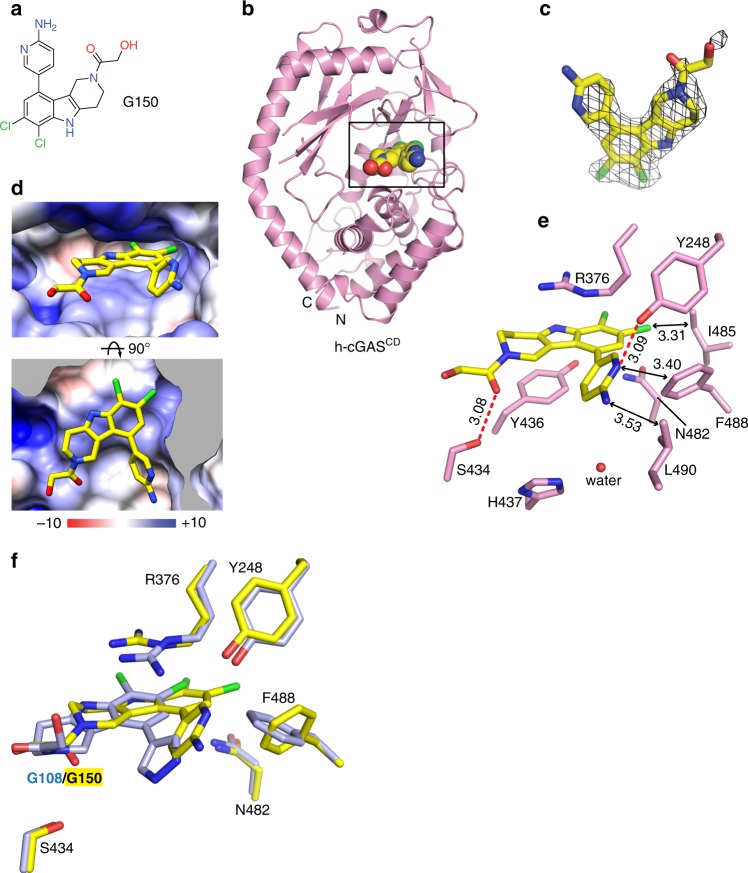
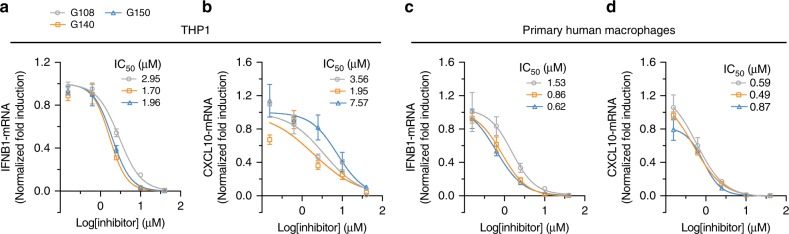
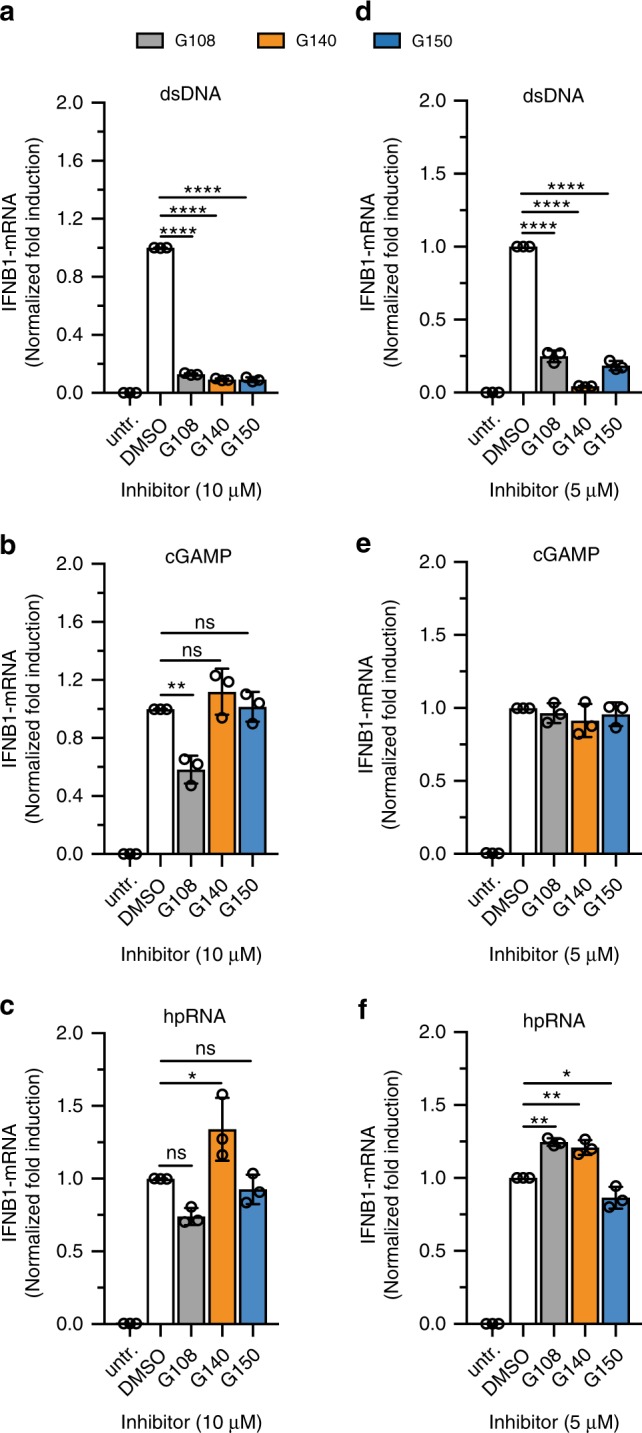
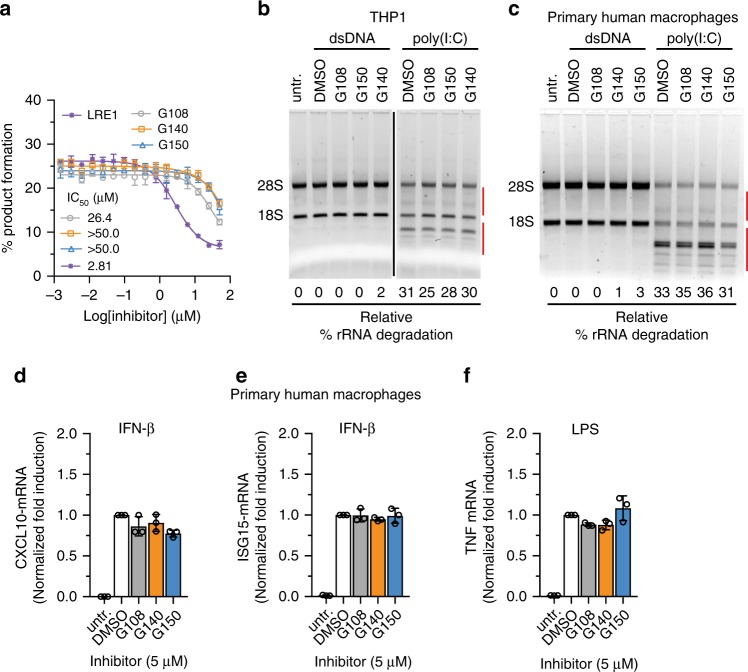
Cyclic GMP-AMP synthase (cGAS) is the primary sensor for aberrant intracellular dsDNA producing the cyclic dinucleotide cGAMP, a second messenger initiating cytokine production in subsets of myeloid lineage cell types. Therefore, inhibition of the enzyme cGAS may act anti-inflammatory. Here we report the discovery of human-cGAS-specific small-molecule inhibitors by high-throughput screening and the targeted medicinal chemistry optimization for two molecular scaffolds. Lead compounds from one scaffold co-crystallize with human cGAS and occupy the ATP- and GTP-binding active site. The specificity and potency of these drug candidates is further documented in human myeloid cells including primary macrophages. These novel cGAS inhibitors with cell-based activity will serve as probes into cGAS-dependent innate immune pathways and warrant future pharmacological studies for treatment of cGAS-dependent inflammatory diseases.


Conflict of interest statement

T.T., L.L., D.J.P., J.F.G., D.T., T.Ka., Mi.M., Y.A., R.O., S.H., J.A., T.I., Ma.M. and T.Ku. have filed a patent application encompassing aspects of this work (PCT/US2019/016673). The remaining authors declare no competing interests.

Figures

Fig. 1
Fig. 1
Establishment of a high-throughput screening assay for identification of small-molecule h-cGAS inhibitors. a Schematic showing dsDNA-activated cGAS synthesis of cyclic GMP–AMP (cGAMP) from ATP and GTP. b, c Assessment of enzymatic activity of h-cGAS under varying dsDNA concentrations based on RapidFire mass spectrometry (RF-MS) assay (b) or ATP-coupled luminescence (LUM)-based assay (c). d Schematic for high-throughput screening of small-molecule h-cGAS inhibitors using assay (c). Numbers in parentheses indicate the column(s) in plate into which the specified reagent was dispensed. RT room temperature. (n = 6 for b and c; mean ± S.D.)
Fig. 2
Fig. 2
ATP-coupled luminescence-based high-throughput screening results for h-cGAS. a Sigma-Aldrich LOPAC (library of 1268 pharmacologically active compounds) were tested at 12.5 µM final concentration for h-cGAS LUM assay. Normalized percent of inhibition (NPI) for each compound tested (gray dots) in two independent days were plotted against each other. Blue dots indicate DMSO negative control and red dots indicate the positive control (no dsDNA). b Scatter plot for the NPI of the 281,348 library compounds tested at 12.5 µM final compound concentration. Sample ID indicates the unique number assigned for each compound in the library. Gray dots, library compound; blue dots, negative control; red dots, positive control. c Z-prime factor analysis of each library plate. Plate ID indicates the unique number assigned for each library compound plate
Fig. 3
Fig. 3
cGAS inhibition by hit compounds J001 and G001 and their derivatives. ac Chemical structures indicating IC50 values against human (h) and mouse (m) cGAS (a) and in vitro concentration response curves (b and c) for compound J001 and its most active analogs. df Chemical structures showing IC50 values against cGAS (d) and in vitro concentration response curves (e and f) for compound G001 and its most active analogs. IC50 values were determined for the in-house synthesized compounds using RF-MS-based assay (n = 3 for b, c, e, and f; mean ± S.D. Data shown are representation of two independent experiments.)
Fig. 4
Fig. 4
Structure of G108 bound to apo h-cGASCD. a Chemical formula of G108. b Crystal structure of G108 bound to apo h-cGASCD. The bound G108 is shown in a space-filling representation, and the binding pocket is boxed. c 2Fo–Fc electron density map of bound G108 contoured at 1.2 σ level. The electron density is poorly defined for the hydroxyl-ethanone side chain attached to the non-planar six-membered ring. d Two views of G108 positioned in its binding pocket within h-cGASCD with the protein shown in an electrostatic surface representation. Electrostatic surface potentials were calculated with Coulombic Surface tool in Chimera with thresholds ±10 kcal mol−1 e−1. e Intermolecular contacts and key distances between G108 and amino acids lining the binding pocket of h-cGASCD. Distances are in angstrom. Red dashed line indicates hydrogen bond
Fig. 5
Fig. 5
Structure of G150 bound to apo h-cGASCD. a Chemical formula of G150. b Crystal structure of G150 bound to apo h-cGASCD. The bound G150 is shown in a space-filling representation, and the binding pocket is boxed. c 2Fo–Fc electron density map of bound G150 contoured at 1.2 σ level. The electron density is partly defined for the hydroxyl-ethanone side chain attached to the non-planar six-membered ring. d Two views of G150 positioned in its binding pocket within h-cGASCD with the protein shown in an electrostatic surface representation. Electrostatic surface potentials were calculated with Coulombic Surface tool in Chimera with thresholds ±10 kcal mol−1 e−1. e Intermolecular contacts and key distances between G150 and amino acids lining the binding pocket of h-cGASCD. Distances are in angstrom. Red dashed lines indicate hydrogen bond. f Superposition of the structures of G108 (light blue) and G150 (yellow) as observed in their complexes with h-cGASCD. Note that G150 is positioned deeper in the binding pocket than G108 so that the pair of chlorine atoms do not superposition with each other
Fig. 6
Fig. 6
G chemotype inhibitors show potent inhibition of cGAS in human THP1 and primary macrophages. a, b Potency of G108, G140, and G150 was tested in dsDNA-stimulated THP1 cells in the presence of a range of different inhibitor concentrations. IFNB1 (a) and CXCL10 (b) mRNA were measured by qRT-PCR for each of the indicated inhibitor concentrations and normalized to no inhibitor control. c, d Analysis of inhibition of dsDNA-induced cGAS activity by G108, G140, and G150 in primary macrophage cells differentiated from human blood-derived monocytes. The cellular IC50 values were calculated using GraphPad Prism (7.01).(n = 3; mean ± S.D. Data shown are representation of two independent experiments.)
Fig. 7
Fig. 7
G chemotype inhibitors show specific inhibition against cGAS in human THP1 and primary human macrophages. ac Specificity of G108, G140, and G150 against cGAS activity was tested using different ligands [2 µg ml−1 dsDNA (cGAS), 10 µg ml−1 cGAMP (STING), 0.5 µg ml−1 hpRNA (RIG-I)] for IFNB1 mRNA induction followed by any possible inhibition in the presence of 10 µM inhibitor concentration in THP1 cells. df Specificity analysis of 5 µM G108, G140, and G150 against cGAS inhibition in primary human macrophage cells differentiated from human blood-derived monocytes using different ligands: 2 µg ml−1 dsDNA (cGAS), 10 µg ml−1 cGAMP (STING), or 0.5 µg ml−1 hairpin RNA (hpRNA) (RIG-I). Data shown are mean ± S.D. for three technical replicates and are representation of two independent experiments (n = 3; mean ± S.D.; *p = 0.04, **p< 0.01, ****p< 0.0001 using one-way ANOVA followed by Tukey’s test for multiple comparison (ad, f). Data shown are representation of two independent experiments.)
Fig. 8
Fig. 8
G chemotype inhibitors show no off-target effect against other nucleotidyl transferase enzymes. a Biochemical off-target assessment of cGAS inhibitors using soluble adenylyl cyclase enzyme. b, c Cellular off-target effect assessment of cGAS inhibitors against OAS proteins using 2 µg ml−1 poly(I:C) as a ligand to stimulate OAS-RNaseL pathway in THP1 cells (b) and primary human macrophages (c). Red bars encompass the degraded rRNAs that were used for the quantification of relative percentage (%) rRNA degradation. df Off-target analysis of 5 µM G108, G140, and G150 against cGAS inhibition in primary human macrophage cells differentiated from human blood-derived monocytes using different ligands: 1000 U ml−1 recombinant human interferon-β (IFN-β) (JAK/STAT), or 2 µg ml−1 LPS (TLR4) (n = 3; mean ± S.D. Data shown are representation of two independent experiments (a, b, df).)

References

    1. Mogensen TH. Pathogen recognition and inflammatory signaling in innate immune defenses. Clin. Microbiol. Rev. 2009;22:240–273. doi: 10.1128/CMR.00046-08. - DOI - PMC - PubMed
    1. Barbalat R, Ewald SE, Mouchess ML, Barton GM. Nucleic acid recognition by the innate immune system. Annu. Rev. Immunol. 2011;29:185–214. doi: 10.1146/annurev-immunol-031210-101340. - DOI - PubMed
    1. Schlee M, Hartmann G. Discriminating self from non-self in nucleic acid sensing. Nat. Rev. Immunol. 2016;16:566–580. doi: 10.1038/nri.2016.78. - DOI - PMC - PubMed
    1. Sun L, Wu J, Du F, Chen X, Chen ZJ. Cyclic GMP-AMP synthase is a cytosolic DNA sensor that activates the type I interferon pathway. Science. 2013;339:786–791. doi: 10.1126/science.1232458. - DOI - PMC - PubMed
    1. Wu J, et al. Cyclic GMP-AMP is an endogenous second messenger in innate immune signaling by cytosolic DNA. Science. 2013;339:826–830. doi: 10.1126/science.1229963. - DOI - PMC - PubMed

Publication types

MeSH terms