. 2019 May 21;10(1):2100.
doi: 10.1038/s41467-019-10051-0.

Artisanal fish fences pose broad and unexpected threats to the tropical coastal seascape

Affiliations

Artisanal fish fences pose broad and unexpected threats to the tropical coastal seascape

Dan A Exton et al. Nat Commun. .

Abstract

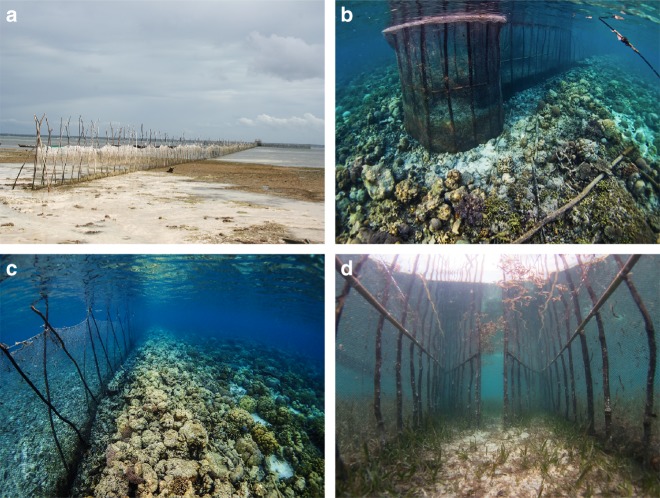
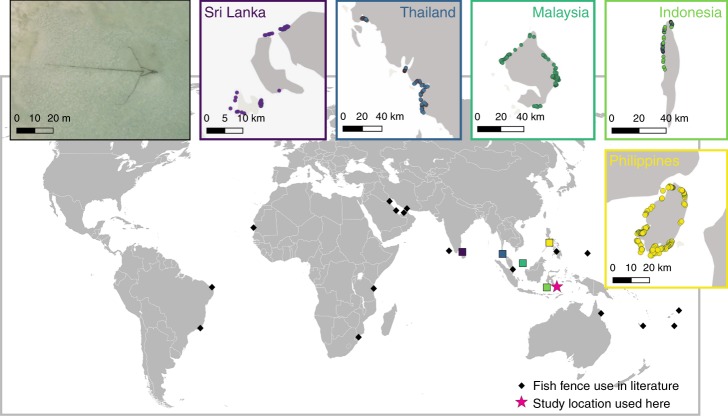
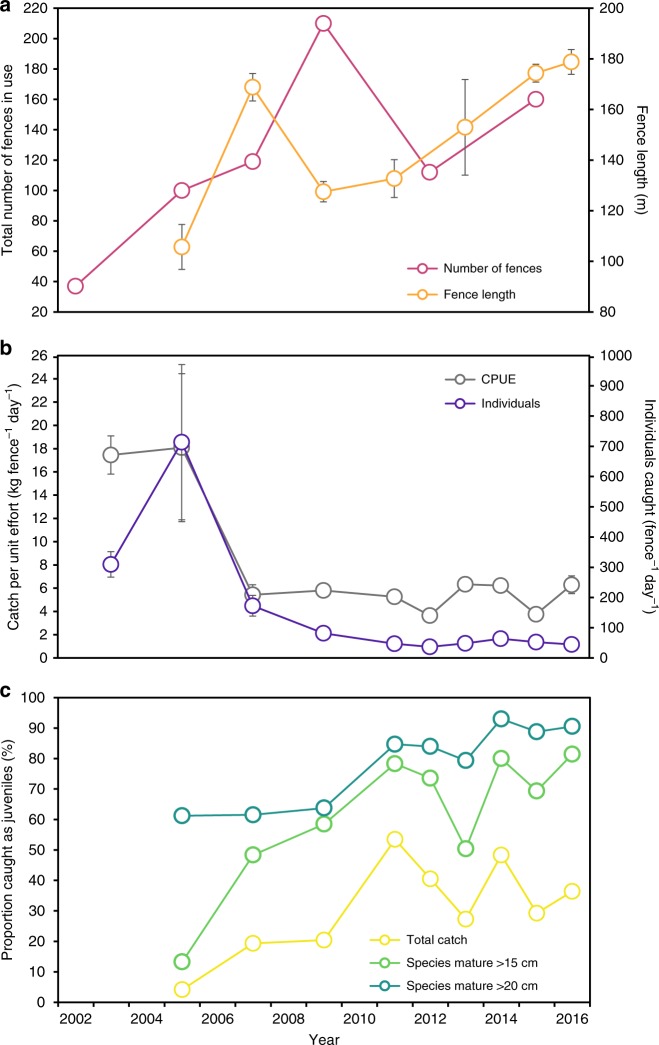
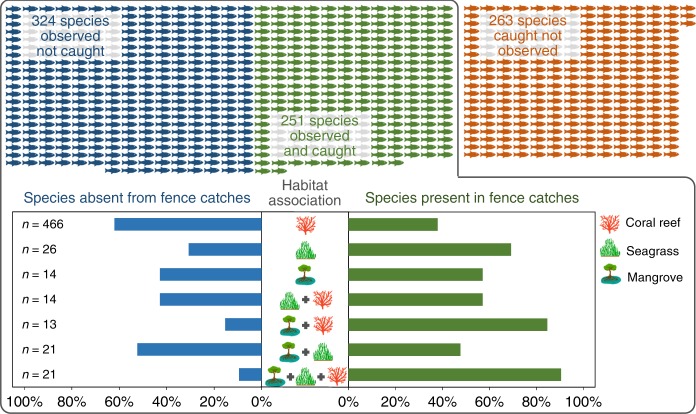
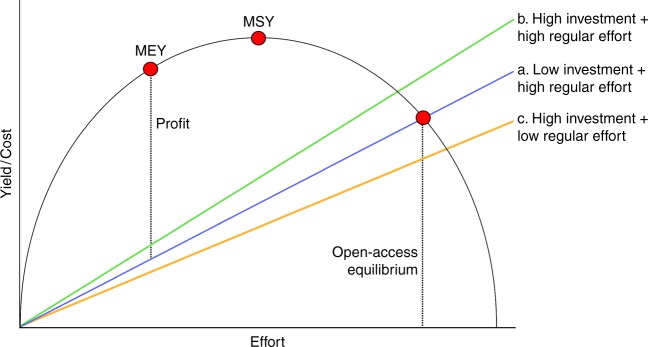
Gear restrictions are an important management tool in small-scale tropical fisheries, improving sustainability and building resilience to climate change. Yet to identify the management challenges and complete footprint of individual gears, a broader systems approach is required that integrates ecological, economic and social sciences. Here we apply this approach to artisanal fish fences, intensively used across three oceans, to identify a previously underrecognized gear requiring urgent management attention. A longitudinal case study shows increased effort matched with large declines in catch success and corresponding reef fish abundance. We find fish fences to disrupt vital ecological connectivity, exploit > 500 species with high juvenile removal, and directly damage seagrass ecosystems with cascading impacts on connected coral reefs and mangroves. As semi-permanent structures in otherwise open-access fisheries, they create social conflict by assuming unofficial and unregulated property rights, while their unique high-investment-low-effort nature removes traditional economic and social barriers to overfishing.


Conflict of interest statement

The authors declare no competing interests.

Figures

Fig. 1
Fig. 1
Indonesian fish fences on intertidal reef flats, showing a an 80 m long fence at low tide, b a halo of benthic habitat loss caused by direct clearance and/or the use of poison, c a fence acting as an artificial barrier preventing a healthy benthic community from persisting on the landward side and d cleared seagrass within the fence structure. Photo credits: Benjamin Jones, Project Seagrass
Fig. 2
Fig. 2
Global distribution of artisanal fish fence use, showing the location of mentions in the literature (black diamonds), Google Earth visual surveys showing intensive use of fish fences (inset maps corresponding by colour to squares on main map), study site location used for this study in Wakatobi National Park, Indonesia (pink star), and an example fish fence viewed via Google Earth (inset photo). Where literature mentions describe regional studies with ranges of hundreds of kilometres, symbols denote the approximate centre point of those studies. Map data are from Google
Fig. 3
Fig. 3
a Total fish fence effort around Kaledupa Island between 2002 and 2016, showing total number of fish fences in use (pink), and length of fences measured along the central spine (orange). b Catch statistics from fish fences between 2003 and 2016 during intensive 5-week study periods July–August, showing catch per unit effort (CPUE; grey) and number of individual fish caught (purple). c Overall proportion of fish caught as juveniles for the total catch (all species combined; yellow), for species that mature above 15 cm (green) and for species that mature above 20 cm (blue). Data shown in a and b are mean ± 1 standard error (SE) where applicable. For n of fences and catches surveyed at each time point see Supplementary Table 1
Fig. 4
Fig. 4
Visual representation of the 838 fish species recorded locally, separated by their presence in visual surveys only (blue fish), fish fence catch monitoring only (red fish) or both (green fish). All 575 species recorded in visual surveys (inside 'box) were then allocated habitat associations, based on which visual surveys they were recorded in (coral reef, seagrass, mangrove). For each habitat association, the proportion (%) of species present in (blue bars) and absent from (green bars) fish fence catches are shown, with the total number of species allocated to that habitat association (n). Symbol artwork produced by Olivia Farman, Operation Wallacea
Fig. 5
Fig. 5
The Gordon-Schaefer fixed price bioeconomic model indicating the open-access equilibrium where cost equals the effort–yield curve. Also shown are theoretical variations of this relationship based on differing levels of initial investment and regular effort. The high-investment–low-effort nature of fish fences could exacerbate overfishing by removing some traditional bioeconomic barriers

References

    1. Hughes TP, et al. Coral reefs in the anthropocene. Nature. 2017;546:82–90. doi: 10.1038/nature22901. - DOI - PubMed
    1. Eyre BD, et al. Coral reefs will transition to net dissolving before end of century. Science. 2018;359:908–911. doi: 10.1126/science.aao1118. - DOI - PubMed
    1. Hoegh-Guldberg O, Kennedy EV, Beyer HL, McClennen C, Possingham HP. Securing a long-term future for coral reefs. Trends Ecol. Evol. 2018;33:936–944. doi: 10.1016/j.tree.2018.09.006. - DOI - PubMed
    1. Arias-Ortiz A, et al. A marine heatwave drives massive losses from the world’s largest seagrass carbon stocks. Nat. Clim. Chang. 2018;8:338–344. doi: 10.1038/s41558-018-0096-y. - DOI
    1. Harborne AR, Rogers A, Bozec YM, Mumby PJ. Multiple stressors and the functioning of coral reefs. Ann. Rev. Mar. Sci. 2017;9:445–468. doi: 10.1146/annurev-marine-010816-060551. - DOI - PubMed

Publication types