. 2019 May 21;9(1):7667.
doi: 10.1038/s41598-019-43409-x.

TGFβ-induced cytoskeletal remodeling mediates elevation of cell stiffness and invasiveness in NSCLC

Affiliations

TGFβ-induced cytoskeletal remodeling mediates elevation of cell stiffness and invasiveness in NSCLC

E Gladilin et al. Sci Rep. .

Abstract

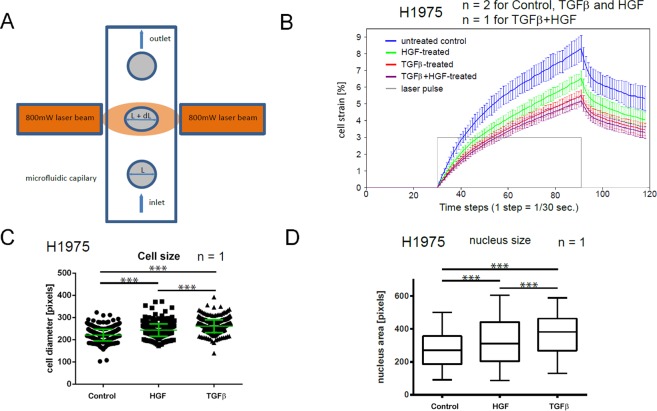
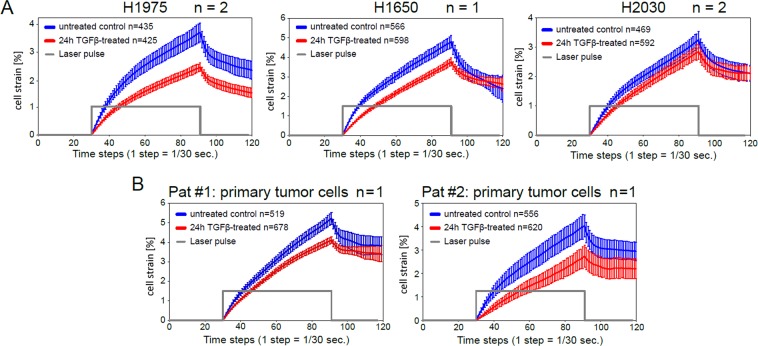
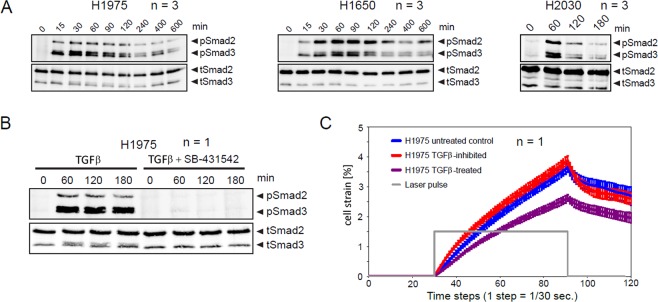
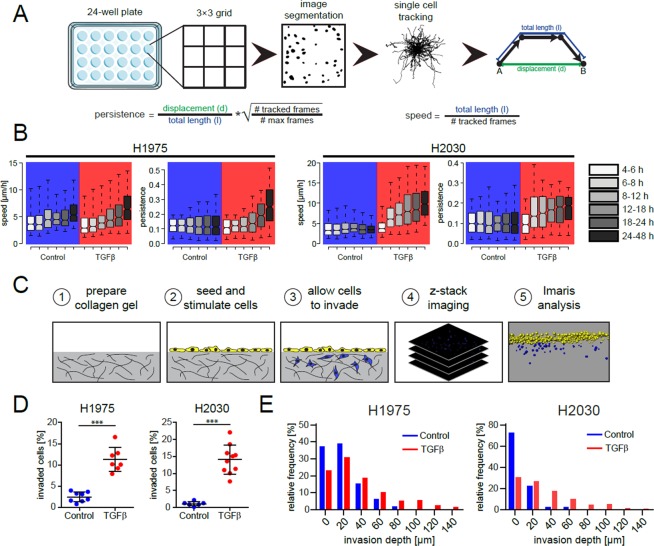
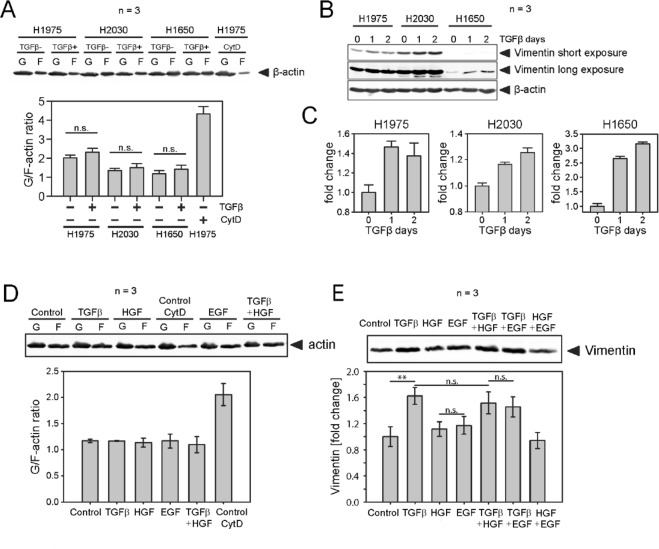
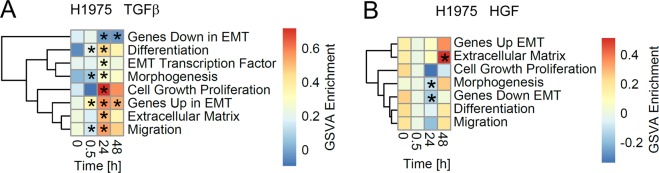
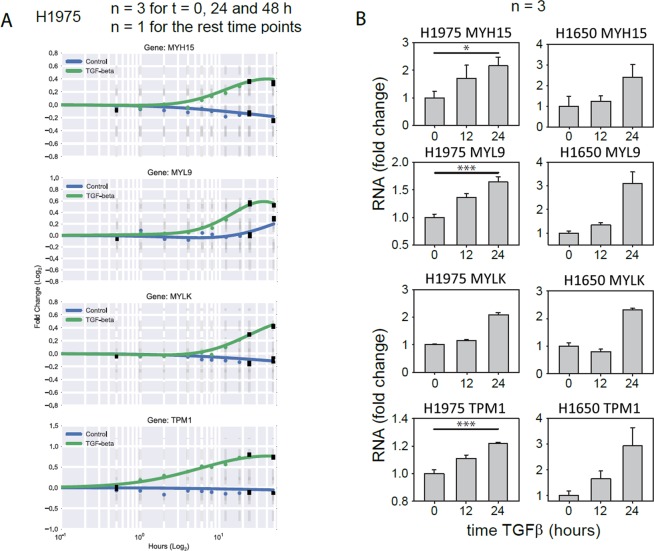
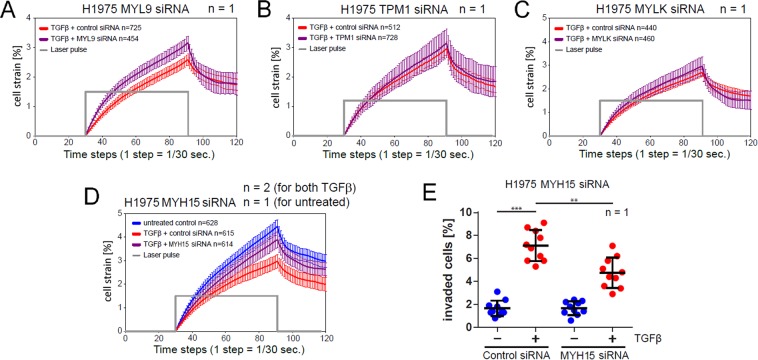
Importance of growth factor (GF) signaling in cancer progression is widely acknowledged. Transforming growth factor beta (TGFβ) is known to play a key role in epithelial-to-mesenchymal transition (EMT) and metastatic cell transformation that are characterized by alterations in cell mechanical architecture and behavior towards a more robust and motile single cell phenotype. However, mechanisms mediating cancer type specific enhancement of cell mechanical phenotype in response to TGFβ remain poorly understood. Here, we combine high-throughput mechanical cell phenotyping, microarray analysis and gene-silencing to dissect cytoskeletal mediators of TGFβ-induced changes in mechanical properties of on-small-cell lung carcinoma (NSCLC) cells. Our experimental results show that elevation of rigidity and invasiveness of TGFβ-stimulated NSCLC cells correlates with upregulation of several cytoskeletal and motor proteins including vimentin, a canonical marker of EMT, and less-known unconventional myosins. Selective probing of gene-silenced cells lead to identification of unconventional myosin MYH15 as a novel mediator of elevated cell rigidity and invasiveness in TGFβ-stimulated NSCLC cells. Our experimental results provide insights into TGFβ-induced cytoskeletal remodeling of NSCLC cells and suggest that mediators of elevated cell stiffness and migratory activity such as unconventional cytoskeletal and motor proteins may represent promising pharmaceutical targets for restraining invasive spread of lung cancer.


Conflict of interest statement

The authors declare no competing interests.

Figures

Figure 1
Figure 1
Effects of TGFβ- and HGF-stimulation on rigidity and morphology of NSCLC cells. (A) Working principle of the cell optical stretcher: uniaxial cell elongation from the inital diameter L to L′ = L + dL under the impact of optical forces. (B) Creep-and-recovery curves of untreated, HGF-, TGFβ-treated and co-stimulated H1975 cells. Solid lines show the mean cell strain of bootstrap sample means. Error bars indicate 95% confidence interval which is given by two-fold standard deviation of bootstrap sample means. Cells were treated with 2 ng/ml TGFβ, or 80 ng/ml HGF or combination of both for 24 h in growth factor-depleted medium. Trypsinized cells were injected into the microfluidic system of cell optical stretcher. At least 300 cells per condition were measured. (C) Growth factor treatment leads to the increase of cell size of H1975 cells. Cells were treated with 2 ng/ml TGFβ, or 80 ng/ml HGF or left untreated for 24 h in growth factor-depleted medium, trypsinized and measured on cell optical stretcher. Cell diameter prior to laser-induced cell stretching was measured and compared between the conditions. (D) H1975 cells were seeded on 24-well plate, treated with 2 ng/ml TGFβ, or 80 ng/ml HGF or left untreated for 24 h in growth factor-depleted medium, stained with Hoechst and imaged with a wide-field fluorescence microscope (Olympus). ImageJ was used to quantify the nuclei area. Center lines show the medians; box limits indicate the 25th and 75th percentiles; whiskers extend 1.5 times the interquartile range from the 25th and 75th percentiles. ***p < 0.001 according to Mann–Whitney test. n indicates the number of independent repetitions.
Figure 2
Figure 2
TGFβ-stimulation elevates rigidity of stable and primary NSCLC cell lines. Creep-and-recovery curves of untreated and TGFβ-stimulated H1975, H1650, H2030 cell lines (A) and primary lung adenocarcinoma cells derived from two donors (B). Cells were treated with 2 ng/ml TGFβ, or left untreated in growth factor-depleted medium for 24 h. Trypsinized cells were injected into the microfluidic system of cell optical stretcher. n inside the boxes indicates the number of cells measured per condition, n outside the boxes corresponds to the number of independent repetitions.
Figure 3
Figure 3
TGFβ/Smad signaling pathway activation in response to TGFβ-stimulation. H1975, H1650 and H2030 cells were kept in serum-free medium overnight. Cells were stimulated with 2 ng/ml TGFβ and lysed at the indicated time points. Subsequently, Smad2/3 immunoprecipitation was followed by immunoblotting. (A) Immunoblotting data of H1975, H1650 and H2030 cells. One representative example is shown. (B) Treatment with TGFβR inhibitor SB-431542 (10 μM) completely abolishes Smad2/3 phosphorylation upon TGFβ-treatment. (C) TGFβ-induced reduction of cell deformability is abolished upon application of TGFβR inhibitor. H1975 cells were treated with 2 ng/ml TGFβ, in presence or absence of 10 μM SB-431542 inhibitor for 24 h. Trypsinized cells were injected into the microfluidic system of cell optical stretcher. At least 300 cells per condition were measured. n indicates number of independent repetitions.
Figure 4
Figure 4
TGFβ-treatment results in the increase of migratory and invasive properties of NSCLC cells. (A) Schematic representation of 2D in-vitro cell migration assay and parameters describing the migration phenotype. (B) Time-resolved effects of TGFβ-stimulation on migration speed and persistence of H1975 and H2030 cells. Center lines show the medians; box limits indicate the 25th and 75th percentiles; whiskers extend to 5th and 95th percentiles. The notches are defined as ±1.58 IQR/n and represent the 95% confidence interval for each median. At least 300 cells per box from three biological replicates were used. (C) Experimental setup of 3D cell invasion in collagen gel. (D) Percentage of invaded cells of unstimulated and TGFβ-treated cells after 3 days. (E) Frequency diagrams of invasion depth of invaded cells. ***p < 0.001.
Figure 5
Figure 5
TGFβ-treatment does not change G/F-actin ratio in NSCLC cells, but rather results in increase of vimentin amount. (A) G/F-actin ratio in H1975, H1650 and H2030 cells upon treatment with TGFβ was assessed by immunoblot. Equal fractions of G- and F-actin pools were compared. Untreated cells exposed to 20 μM of CytochalazinD for 3 h were used as experimental control. (B,C) Representative immunoblot of vimentin expression in H1975, H1650 and H2030 cells treated with 2 ng/ml TGFβ for 24 h and respective quantification. (D) H1975 cells were treated with 2 ng/ml TGFβ, or 80 ng/ml HGF, or 5 ng/ml EGF, or combination of TGFβ and HGF, or left untreated for 24 h in growth-factor depleted medium. G/F-actin ratio in H1975 cells upon treatment with different growth factors was assessed by immunoblot. Untreated cells exposed to 20 μM of CytochalazinD for 3 h were used as experimental control. (E) Vimentin expression in H1975 cells treated with different growth factors for 24 h vs. untreated control. **p < 0.01 and n.s. indicate significant and non-significant differences according to one-way ANOVA. n indicates the number of independent repetitions.
Figure 6
Figure 6
Gene Set Variation Analysis (GSVA) on the longitudinal gene expression data in the H1975 cells upon stimulation with growth factors TGFβ and HGF. The heatmap depicts the average GSVA enrichment scores at 0.5, 24 and 48 hours after TGFβ (A) and HGF (B) stimulation for time matched (n = 3). Gene sets have been taken from the epithelial-to-mesenchymal transition RT2 Profiler™ PCR Arrays by QIAGEN and are provided as Supplementary Table S1. Stars indicate a significant differential GSVA enrichment score according to a moderated t-test (FDR corrected p-value < 0.05). Rows have been clustered according to their Euclidean distance using complete linkage.
Figure 7
Figure 7
Dynamic response of MYH15, MYL9, MYLK and TPM1 to TGFβ-stimulation in NSCLC cell lines. (A) Single gene dynamics of candidates genes from the microarray. (B) Validation of the microarray candidate genes with qPCR in H1975 and H1650 cells. Cells were stimulated with 2 ng/ml TGFβ and RNA was extracted at the indicated time points. Gene expression was assessed using qRT-PCR. mRNA expression was normalized to the geometric mean of two housekeeper genes: G6PD and HPRT. *p < 0.05 and ***p < 0.001 significance levels were determined using one-way ANOVA. n indicates the number of independent repetitions.
Figure 8
Figure 8
siRNA-mediated knockdown of MYH15 and MYL9, but not MYLK and TPM1 reduces TGFβ-induced stiffening of H1975 cells. (AD) Creep-and-recovery curves of H1975 transfected with either non-targeting siRNA or siRNA specific to one of the candidate genes for 36 h followed by stimulation with 2 ng/ml TGFβ for 24 h. Afterwards cells were trypsinized and injected into the microfluidic system of optical stretcher. MYH15 siRNA-silenced H1975 cells exhibit the largest softening in comparison to control probes among four tested candidate genes. (E) TGFβ-induced 3D collagen gel invasion of H1975 cells upon siRNA-mediated MYH15 knockdown. Cells were siRNA-transfected and seeded on collagen gels, allowed to adhere overnight and stimulated with 2 ng/ml TGFβ for 3 days. Afterwards cells were fixed, stained with Hoechst and imaged on confocal microscope (Zeiss LSM710). n inside the boxes indicates the number of cells measured per condition, n outside the boxes corresponds to the number of independent repetitions. **p < 0.01 and ***p < 0.001 significance levels are according to one-way ANOVA.

References

    1. Siegel R, Naishadham D, Jemal A. Cancer statistics. CA Cancer J Clin. 2013;63:11–30. doi: 10.3322/caac.21166. - DOI - PubMed
    1. Morgensztern D, Ng S, Gao F, Govindan R. Trends in stage distribution for patients with non–small cell lung cancer: a National Cancer Database survey. J Thorac. Oncol. 2010;5:29–33. doi: 10.1097/JTO.0b013e3181c5920c. - DOI - PubMed
    1. Friedl P, Wolf K. Tumour–cell invasion and migration: diversity and escape mechanisms. Nat. Rev. Can. 2003;3:362–374. doi: 10.1038/nrc1075. - DOI - PubMed
    1. Birkedal-Hansen H. Proteolytic remodeling of extracellular matrix. Curr. Opin. Cell Biol. 1995;7:728–735. doi: 10.1016/0955-0674(95)80116-2. - DOI - PubMed
    1. Lauffenburger D, Horwitz A. Cell migration: a physically integrated molecular process. Cell. 1996;84:359–369. doi: 10.1016/S0092-8674(00)81280-5. - DOI - PubMed

MeSH terms