. 2019 Apr 23:13:1311-1321.
doi: 10.2147/DDDT.S192683. eCollection 2019.

Epigallocatechin-3-gallate enhances the osteoblastogenic differentiation of human adipose-derived stem cells

Affiliations

Epigallocatechin-3-gallate enhances the osteoblastogenic differentiation of human adipose-derived stem cells

Jing Zhang et al. Drug Des Devel Ther. .

Abstract

Purpose: The aim of this study is to investigate the effects of epigallocatechin-3-gallate (EGCG), a major polyphenol extracted from green tea, on the osteoblastogenic differentiation of human adipose-derived stem cells (hASCs).

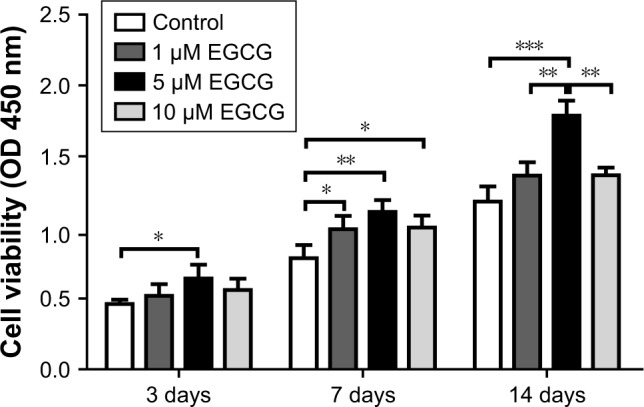
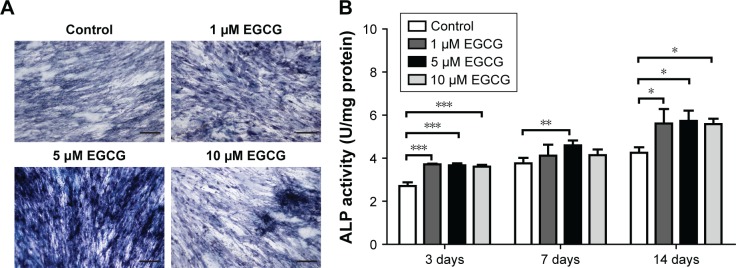
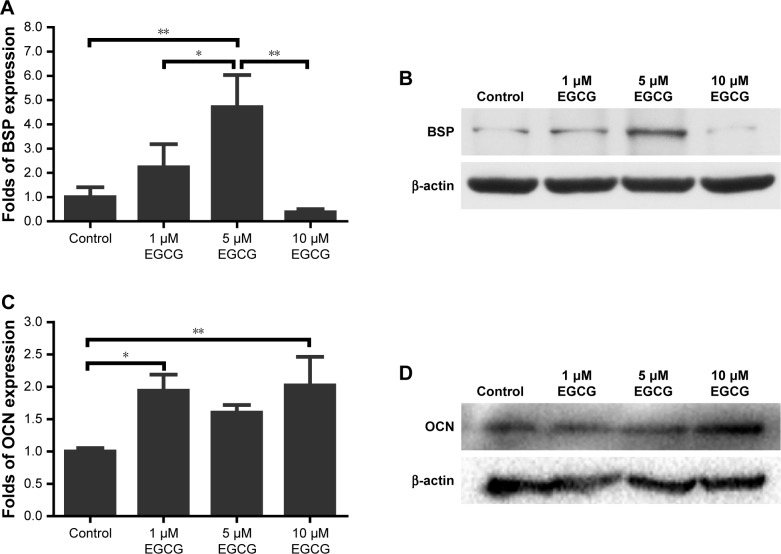
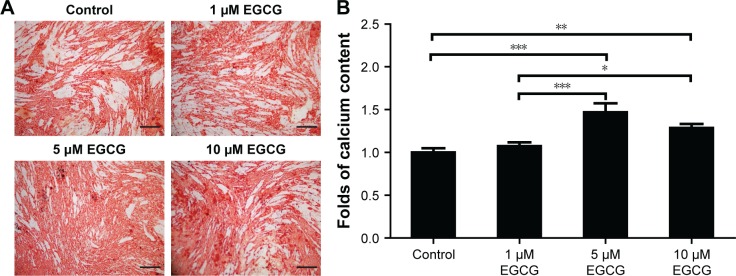
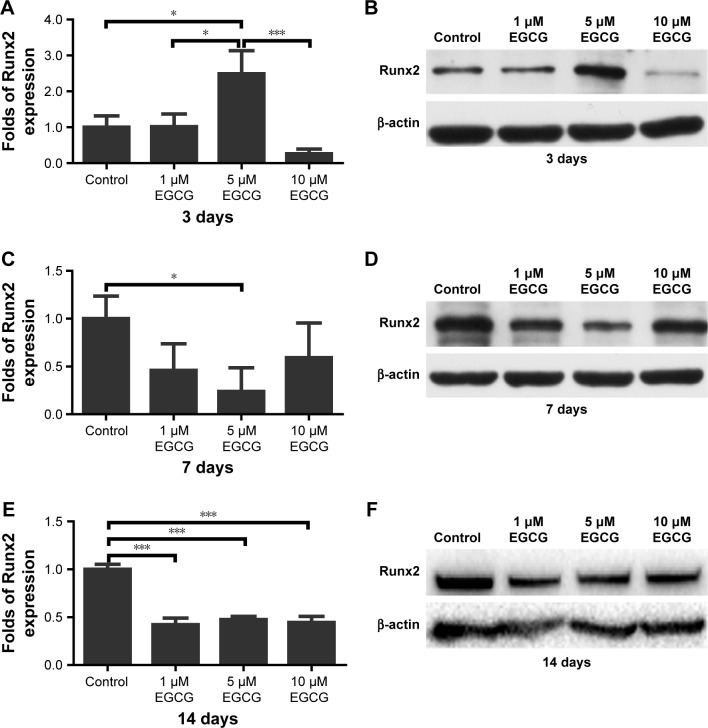
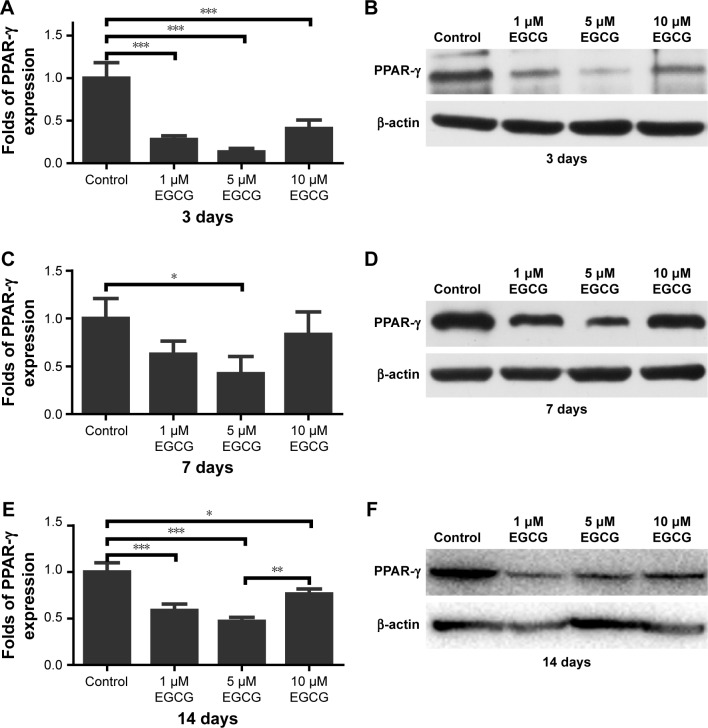
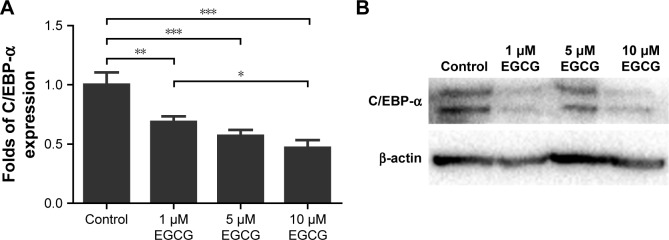
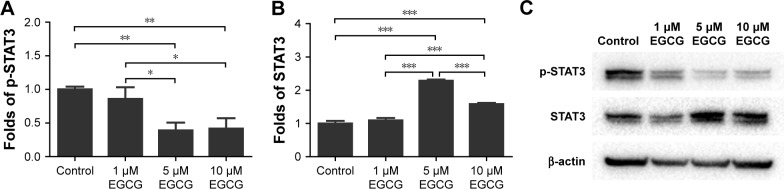
Patients and methods: hASCs were acquired from human adipose tissue. With informed consent, subcutaneous adipose tissue samples were harvested from periorbital fat pad resections from ten healthy female adults who underwent double eyelid surgery. hASCs were cultured in osteogenic medium with or without EGCG (1 μM, 5 μM, or 10 μM) for 14 days. We evaluated the effects of EGCG by quantifying cell growth, ALP activity (an early osteoblastogenic differentiation marker), BSP, OCN (a late osteoblastogenic differentiation marker), and extracellular matrix mineralization. We also performed Western blots to measure osteoblastogenesis-related proteins such as Runx2 and adipoblastogenesis-related transcription factors, such as STAT3, C/EBP-α, and PPAR-γ.

Results: EGCG at 5 μM resulted in significantly higher cell proliferation and ALP activity than did the control on days 3, 7, and 14. On day 7, 5 μM EGCG significantly enhanced BSP expression. On day 14, EGCG at all concentrations promoted OCN expression. In addition, EGCG at 5 μM resulted in the highest level of extracellular matrix mineralization. On day 3, the expression levels of Runx2 were significantly higher in the 5 μM EGCG group than in the other groups, whereas later, on days 7 and 14, Runx2 expression levels in the EGCG group were significantly lower than those of the control group. EGCG at all three concentrations was associated with significantly lower levels of phosphorylated STAT3, C/EBP-α, and PPAR-γ.

Conclusion: EGCG at 5 μM significantly enhanced the osteoblastogenic differentiation of hASCs.

Keywords: EGCG; STAT3; bone regeneration; hASCs; osteoblastogenesis.


Conflict of interest statement

Disclosure The authors report no conflicts of interest in this work.

Figures

Figure 1
Figure 1
CCK-8 was used to analyze cell proliferation of hASCs at various concentrations of EGCG. Notes: Cell growth in EGCG groups was higher than in the control group on days 3, 7, and 14; 5 μM was optimal to enhance cell proliferation. All data are presented as mean and SD. *p<0.05; **p<0.01; and ***p<0.001 (N=4). Abbreviations: CCK-8, cell counting kit-8; EGCG, epigallocatechin-3-gallate; hASCs, human adipose-derived stem cells.
Figure 2
Figure 2
Effects of EGCG on ALP activity. Notes: (A) Dose effect of EGCG on ALP staining in hASCs was determined under osteogenic induction on day 14. The ALP staining method revealed that the number of ALP-positive cells was increased by EGCG. ALP staining in the 5 μM EGCG group was strongest among all EGCG groups. (B) The ALP activity of hASCs for all groups at various time points was quantitatively analyzed. Compared to the control group, ALP activity was strengthened by EGCG through the whole period (days 3, 7, and 14). All data are presented as mean and SD. *p<0.05; **p<0.01; and ***p<0.001 (N=5). Bar=200 μM. Abbreviations: EGCG, epigallocatechin-3-gallate; hASCs, human adipose-derived stem cells.
Figure 3
Figure 3
Western blotting was used to analyze the expression of osteogenic genes BSP and OCN in hASCs cultured at various concentrations of EGCG for 7 days and 14 days. Notes: (A) The level of BSP was significantly promoted in the 5 μM EGCG group. (B) BSP mRNA expression of osteogenic induction on day 7. (C) The level of OCN was strengthened in the EGCG groups. (D) OCN mRNA expression at day 14 of osteogenic induction. All data are presented as mean and SD. *p<0.05; **p<0.01 (N=3). Abbreviations: BSP, bone sialoprotein; EGCG, epigallocatechin-3-gallate; hASCs, human adipose-derived stem cells; OCN, osteocalcin.
Figure 4
Figure 4
Effect of EGCG on mineralization. Notes: (A) Dose effect of EGCG on matrix mineralization in hASCs was determined under osteogenic induction conditions on day 14 by ARS. ARS in the 5 μM EGCG group was much stronger than in the other groups. (B) Mineralization was quantitatively analyzed. The calcium content in the 5 μM EGCG group was 1.47 times greater than that of the control group. In the 10 μM EGCG group, the calcium content was 1.29-fold greater than that of the control group. All data are presented as mean and SD. *p<0.05, **p<0.01 and ***p<0.001 (N=3). Bar=200 μM. Abbreviations: ARS, Alizarin red staining; EGCG, epigallocatechin-3-gallate; hASCs, human adipose-derived stem cells.
Figure 5
Figure 5
Western blotting was used to analyze the expression of osteogenic genes Runx2 in hASCs cultured in various concentrations of EGCG for 14 days. Notes: (A) The level of Runx2 in the 5 μM EGCG group was significantly higher than that of the control and other EGCG groups. (B) Runx2 mRNA expression at day 3 of osteogenic induction. (C) On day 7, Runx2 expression was significantly downregulated in the 5 μM EGCG group. (D) Runx2 mRNA expression at day 7 of osteogenic induction. (E) The levels of Runx2 in EGCG groups were significantly lower than those in the control group on day 14. (F) Runx2 mRNA expression on day 14 of osteogenic induction. All data are presented as mean and SD. *p<0.05; ***p<0.001 (N=3). Abbreviations: EGCG, epigallocatechin-3-gallate; hASCs, human adipose-derived stem cells.
Figure 6
Figure 6
Western blotting was used to analyze the expression of adipogenic genes PPAR-γ in hASCs cultured in various concentrations of EGCG for 14 days. EGCG suppressed the expression of PPAR-γ, and 5 μM was optimal for suppressing PPAR-γ expression. Notes: (A) On day 3, EGCG at all concentrations significantly suppressed PPAR-γ expression. (B) PPAR-γ expression at day 3 of osteogenic induction. (C) On day 7, EGCG at 5 μM significantly downregulated PPAR-γ expression. (D) PPAR-γ expression at day 7 of osteogenic induction. (E) EGCG at all concentrations significantly suppressed PPAR-γ expression on day 14, and the expression level in the 5 μM EGCG group was lowest. (F) PPAR-γ mRNA expression at day 14 of osteogenic induction. All data are presented as mean and SD. *p<0.05; **p<0.01; and ***p<0.001 (N=3). Abbreviations: EGCG, epigallocatechin-3-gallate; hASCs, human adipose-derived stem cells.
Figure 7
Figure 7
Western blotting was used to analyze the expression of adipogenic genes C/EBP-α in hASCs cultured in various concentrations of EGCG for 14 days. Notes: (A) EGCG at all concentrations significantly suppressed the expression of C/EBP-α at day 14. The level of C/EBP-α expression was lowest in 10 μM EGCG. (B) C/EBP-α expression at day 14 of osteogenic induction. All data are presented as mean and SD. *p<0.05; **p<0.01; and ***p<0.001 (N=3). Abbreviations: EGCG, epigallocatechin-3-gallate; hASCs, human adipose-derived stem cells.
Figure 8
Figure 8
Western blotting was used to analyze the expression of p-STAT3 (A) and STAT3 (B) in hASCs cultured in various concentrations of EGCG for 14 days. Notes: Compared to the control group, EGCG with the concentration of 5 μM and 10 μM decreased the phosphorylation of STAT3. (C) p-STAT3 and STAT3 mRNA expression at day 14 of osteogenic induction. All data are presented as mean and SD. *p<0.05; **p<0.01; and ***p<0.001 (N=3). Abbreviations: EGCG, epigallocatechin-3-gallate; hASCs, human adipose-derived stem cells.

References

    1. Zhang X, Guo J, Zhou Y, Wu G. The roles of bone morphogenetic proteins and their signaling in the osteogenesis of adipose-derived stem cells. Tissue Eng Part B Rev. 2014;20(1):84–92. doi: 10.1089/ten.TEB.2013.0204. - DOI - PMC - PubMed
    1. Calori GM, Albisetti W, Agus A, Iori S, Tagliabue L. Risk factors contributing to fracture non-unions. Injury. 2007;38(Suppl 2):S11–S18. - PubMed
    1. Einhorn TA. Enhancement of fracture-healing. J Bone Joint Surg Am. 1995;77(6):940–956. - PubMed
    1. Tzioupis C, Giannoudis PV. Prevalence of long-bone non-unions. Injury. 2007;38(Suppl 2):S3–S9. - PubMed
    1. Quarto R, Mastrogiacomo M, Cancedda R, et al. Repair of large bone defects with the use of autologous bone marrow stromal cells. N Engl J Med. 2001;344(5):385–386. doi: 10.1056/NEJM200102013440516. - DOI - PubMed