. 2019 Apr 24:10:838.
doi: 10.3389/fmicb.2019.00838. eCollection 2019.

The Phenotypic Analysis of Lactobacillus plantarum shsp Mutants Reveals a Potential Role for hsp1 in Cryotolerance

Affiliations

The Phenotypic Analysis of Lactobacillus plantarum shsp Mutants Reveals a Potential Role for hsp1 in Cryotolerance

Mattia Pia Arena et al. Front Microbiol. .

Abstract

Small heat shock proteins (sHSPs) are ubiquitous, low molecular weight (MW) proteins that share a conserved alpha-crystallin domain. sHSPs oligomers exhibit chaperon-like activities by interacting with unfolded substrates, thereby preventing their aggregation and precipitation. Unlike most lactobacilli, which have single shsp genes, three different sHSP-encoding genes, i.e., hsp1, hsp2, and hsp3, were previously identified in the probiotic Lactobacillus plantarum WCFS1. Early studies, including the characterization of the knock out (KO) mutant for hsp2, indicated a different organization and transcriptional regulation of these genes and suggested that the three L. plantarum sHSPs might accomplish different tasks in stress response. To unravel the role of sHSPs, KO mutants of hsp1 and hsp3 were generated using a Cre-lox based system. Mutation of either genes resulted in impaired growth capacity under normal conditions, heat-stress and stresses typically found during host interactions and food technological process. However, survival to heat shock and the level of thermal stabilization of cytoplasmic proteins were similar between mutants and parental strain. Transcriptional analysis revealed that in the mutant genetic backgrounds there is an upregulated basal expression of the un-mutated mate hsps and other stress-related genes, which may compensate for the loss of HSP function, hence possibly accounting for the lack of a remarkable susceptibility to heat challenge. HSP3 seemed relevant for the induction of thermotolerance, while HSP1 was required for improved cryotolerance. Cell surface properties and plasma membrane fluidity were investigated to ascertain the possible membrane association of sHSP. Intriguingly, the loss of hsp1 was associated to a lower level of maximal membrane fluidity upon heat stress. A role for HSP1 in controlling and improving membrane fluidity is suggested which may pertains its cryoprotective function.

Keywords: Lactobacillus plantarum; chaperone; membrane fluidity; probiotic; small heat shock proteins (sHSP); stress.


Figures
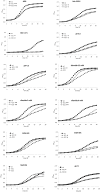
FIGURE 1
FIGURE 1
Growth curves of Lactobacillus plantarum wild type (WT) and derivative mutant strains. The optical density at 600 nm (OD600) was monitored over a 16 h period for cultures of WT, solid square, hsp1 mutant (KO1), solid triangle, and hsp3 mutant (KO3), crosses, under optimal growth conditions at 30°C in unsupplemented MRS broth (pH 6.2), in acidified medium, or with the addition of different chemical stressors, or under heat stress (incubation at 42°C). Values are mean from at least two independent experiments run in triplicates (SD was omitted for improved clarity). The asterisks indicate the mutant growth curve with significantly different OD600 values (P ≤ 0.05) from that of WT for over 50% (∗∗) or 30% () of the reported time points, as assessed by Student t-test.
FIGURE 2
FIGURE 2
Survival to heat shock. The death index of L. plantarum WCFS1 WT and its derivative mutants for hsp1 (KO1) and hsp3 (KO3) was determined by comparing the viable counts before and after 25 min incubation at 55°C, with (solid bars) or without (open bars) a thermal pre-adaptation step (i.e., 30 min incubation at 40°C). Data are mean and SD of three independent experiments. Different letters indicate statistically significant differences (P ≤ 0.05), as determined by ANOVA test.
FIGURE 3
FIGURE 3
Thermostabilization of cell proteins. Protein extracts from WT and mutant clones (KO1 and KO3) were obtained from cultures either grown at 30°C or grown at 30°C and upshifted to 40°C for 30 min prior protein extraction. After heating the protein samples at 55°C for 30 min, the amount of aggregated (white) and soluble (black) proteins was determined and expressed as a percentage of the total proteins. Data are mean and SD of two independent experiments with two replicates. Statistically significant difference relative to WT (P ≤ 0.05; Student t-test).
FIGURE 4
FIGURE 4
Cryotolerance of L. plantarum WCFS1 WT and its derivative mutants. The death index of (WT, open bars), hsp1 mutant (KO1, gray bars), and hsp3 mutant (KO3, solid bars) from log (A) and stationary (B) phase cultures was determined by comparing the viable counts before and after freezing and it is reported as a function of the number of freeze-thaw cycles. Data are mean and SD from 2 independent experiments runs in triplicates. Statistical significance relative to WT values, ∗∗P ≤ 0.01; P ≤ 0.05 (Student t-test).
FIGURE 5
FIGURE 5
Biofilm formation by L. plantarum WCFS1 WT and its derivatives. Cultures were grown in MRS broth in 24-well cell culture plates at 30°C. Optical density at 570 nm (OD570) of the crystal violet-stained 2 days- and 7 days-biofilms is reported. Mean and standard deviations from at least three independent experiments, run in triplicates. Open bars, WT; gray bars, hsp1 mutant (KO1); solid bars, hsp3 mutant (KO3). ∗∗P ≤ 0.01; P ≤ 0.05(Student t-test).
FIGURE 6
FIGURE 6
Evaluation of cell surface physicochemical properties of L. plantarum WCFS1 WT and its derivative mutants. Percentage of adhesion to chloroform (CH), ethyl acetate (EA), hexadecane (HE) of L. plantarum WT (open circles), hsp1 mutant (open triangles) and hsp3 mutant (solid circles). Individual mean data points from at least five experiments, run in triplicate, and the medians (bars) are shown. ∗∗∗P ≤ 0.001; ∗∗P ≤ 0.05; P ≤ 0.1(Student t-test).
FIGURE 7
FIGURE 7
Evolution of in vivo membrane fluidity (fluorescence anisotropy percentage) in L. plantarum cells upon heat shock. Cells were heated at 44°C for 30 min and fluorescence anisotropy of inserted DPH was monitored continuously in L. plantarum (WT, solid circles), hsp1 (KO1, gray circles) and hsp3 mutants (KO3, open triangles). The graph reports averages of the values recorded over one minute, at characteristic time points. Results are expressed as percent anisotropy of the initial values (i.e., before stress exposure). The asterisk () indicates the maximal level of membrane fluidity (reached approximately 8 minutes after stress start), which is significantly different between KO1 and WT (P ≤ 0.0001) and between KO1 and KO3 (P ≤ 0.01), as assessed by Student t-test.
FIGURE 8
FIGURE 8
mRNA expression of stress-related genes in the L. plantarum shsp mutants compared to WT. (A) Relative mRNA expression of selected, significantly dysregulated stress genes under physiological condition (i.e., RNA extracted from log phase cultures grown at 30°C). mRNA levels were calculated relative to the transcript levels detected in the WT (i.e., WT level set at 1 for each gene). (B) Relative heat induction (i.e., RNA from log phase cultures grown at 30°C before and after heat challenge) of selected genes in the mutants compared to WT. mRNA levels, upon 30 min, solid bars, and 1 h, open bars, heat exposure (42°C), were calculated relative to the corresponding unstressed condition and normalized to the heat induction level observed in the WT (set at 1 for each gene and stress period, i.e., values above 1 indicate a higher induction relative to WT, values below 1 indicate a lower induction compared to WT). Data are means and SD from at least 2 independent experiments. Only genes whose transcription was significantly different compared to WT (P ≤ 0.05, Student t-test) are shown. ldhD and tuf were used as the internal control genes. KO1, hsp1 mutant; KO2, hsp2 mutant; KO3, hsp3 mutant.

References

    1. Arena M. P., Capozzi V., Spano G., Fiocco D. (2017). The potential of lactic acid bacteria to colonize biotic and abiotic surfaces and the investigation of their interactions and mechanisms. Appl. Microbiol. Biotechnol. 101 2641–2657. 10.1007/s00253-017-8182-z - DOI - PubMed
    1. Arena M. P., Romano A., Capozzi V., Beneduce L., Ghariani M., Grieco F., et al. (2011). Expression of Lactobacillus brevis IOEB 9809 tyrosine decarboxylase and agmatine deiminase genes in wine correlates with substrate availability. Lett. Appl. Microbiol. 53 395–402. 10.1111/j.1472-765X.2011.03120.x - DOI - PubMed
    1. Beal C., Fonseca F. (2015). “Freezing of probiotic bacteria,” in Advances in Probiotic Technology, eds Foerst P., Santivarangkna C. (Boca Raton, FL: CRC Press; ), 179–212. 10.1201/b18807-14 - DOI
    1. Bellon-Fontaine M. N., Rault J., Van Oss C. J. (1996). Microbial adhesion to solvents: a novel method to determine the electron–donor/electron–acceptor or Lewis acid–base properties of microbial-cells. Colloids Surf. 7 47–53. 10.1016/0927-7765(96)01272-6 - DOI
    1. Bove P., Capozzi V., Fiocco D., Spano G. (2011). Involvement of the sigma factor sigma H in the regulation of a small heat shock protein gene in Lactobacillus plantarum WCFS1. Ann. Microbiol. 61 973–977. 10.1007/s13213-011-0283-9 - DOI