. 2019 Jul 9;47(12):6519-6537.
doi: 10.1093/nar/gkz406.

DNA specificities modulate the binding of human transcription factor A to mitochondrial DNA control region

Affiliations

DNA specificities modulate the binding of human transcription factor A to mitochondrial DNA control region

Anna Cuppari et al. Nucleic Acids Res. .

Abstract

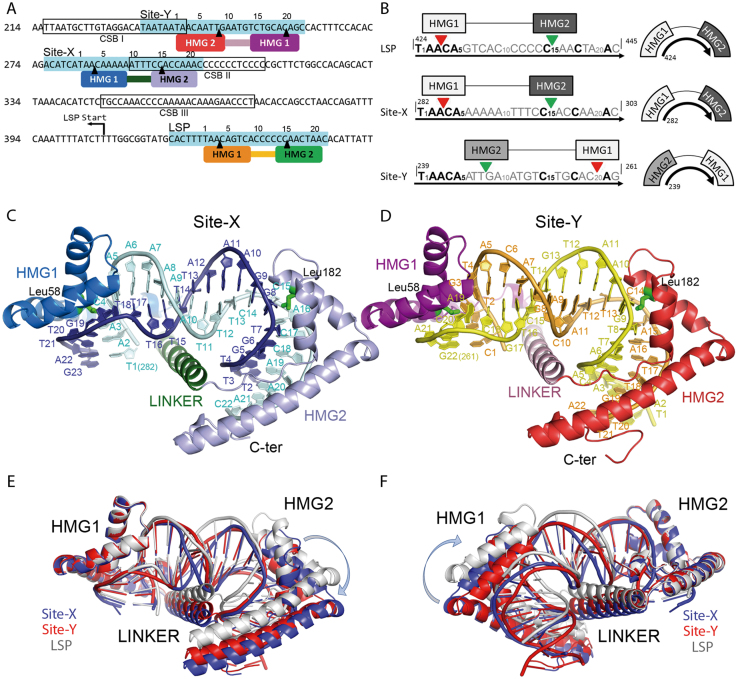
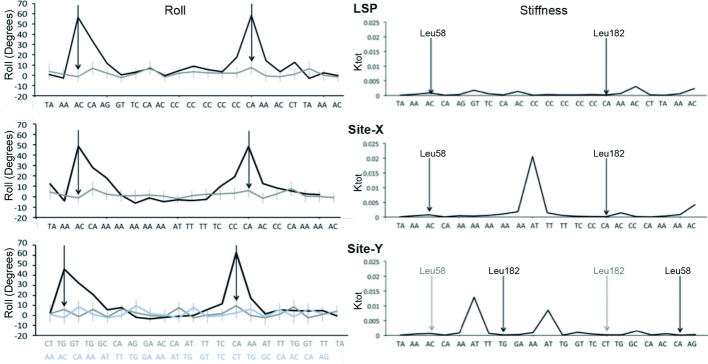
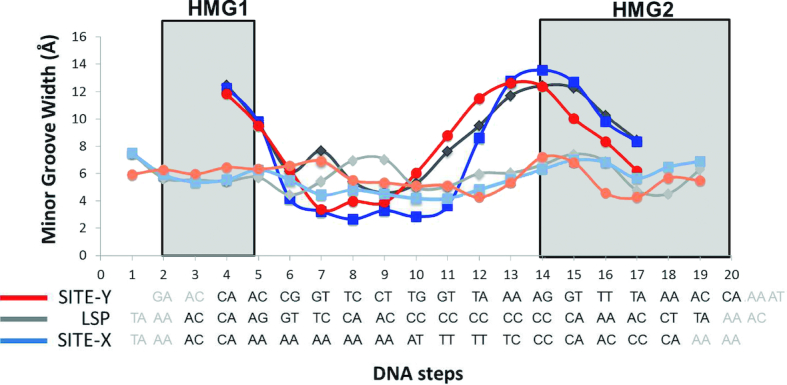
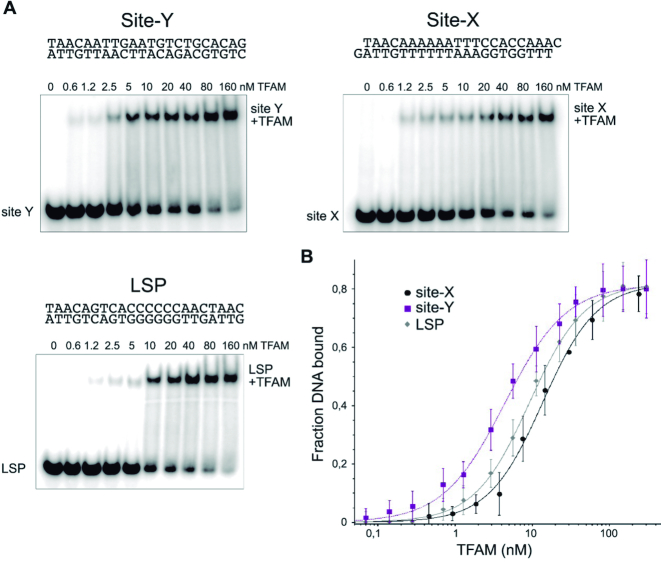
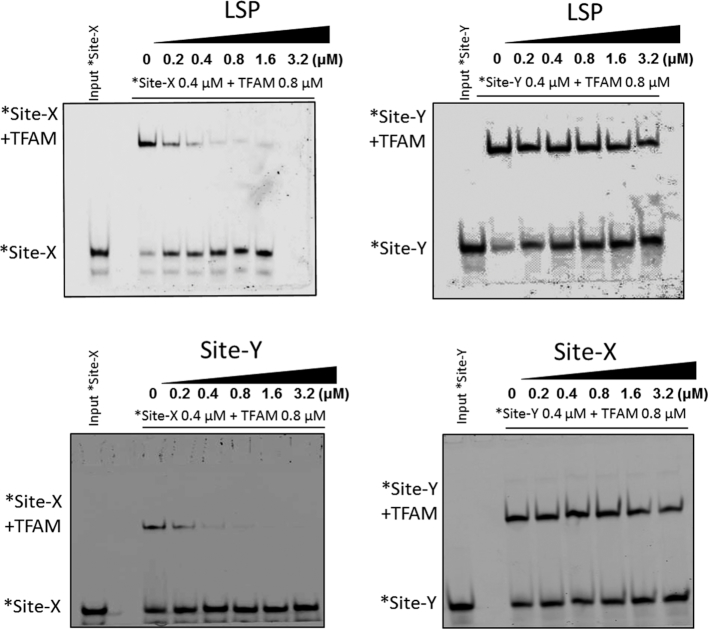
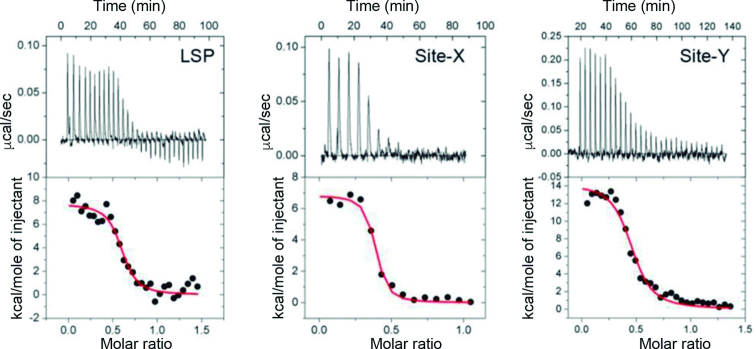
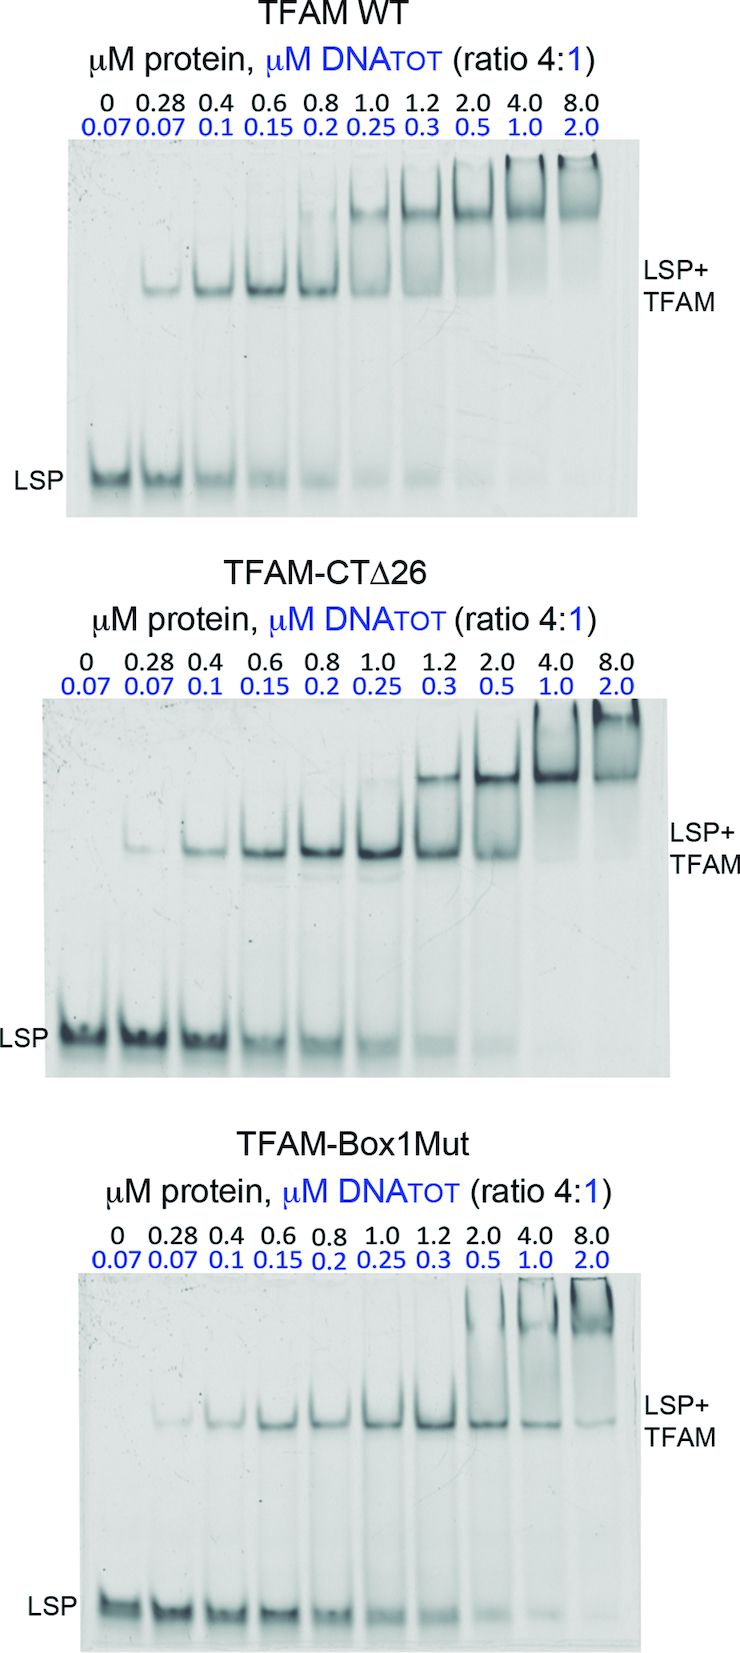
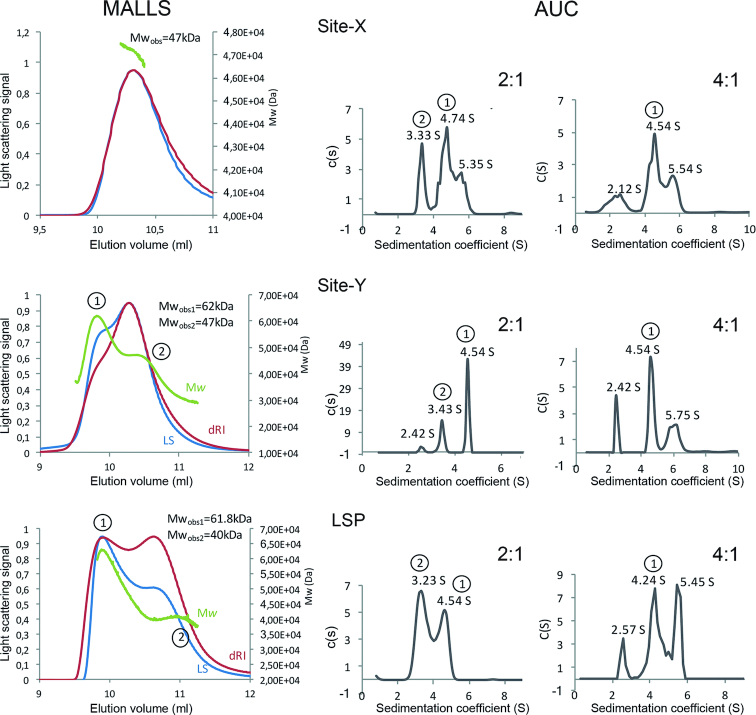
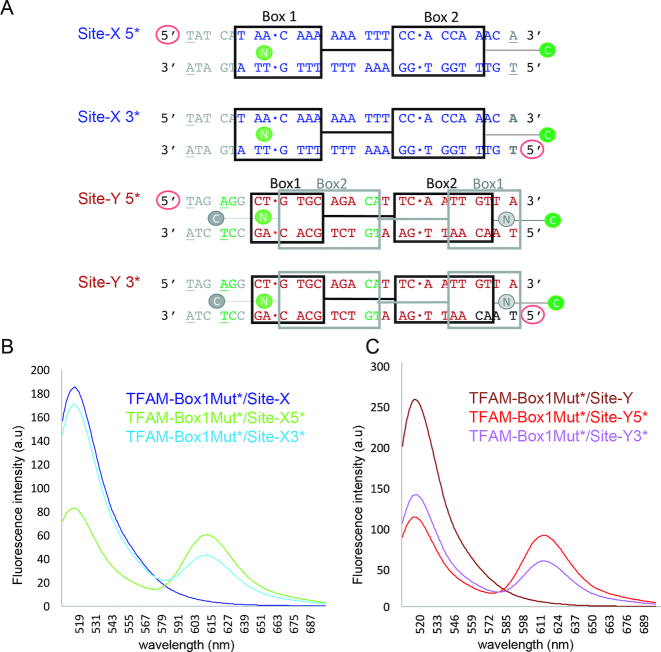
Human mitochondrial DNA (h-mtDNA) codes for 13 subunits of the oxidative phosphorylation pathway, the essential route that produces ATP. H-mtDNA transcription and replication depends on the transcription factor TFAM, which also maintains and compacts this genome. It is well-established that TFAM activates the mtDNA promoters LSP and HSP1 at the mtDNA control region where DNA regulatory elements cluster. Previous studies identified still uncharacterized, additional binding sites at the control region downstream from and slightly similar to LSP, namely sequences X and Y (Site-X and Site-Y) (Fisher et al., Cell 50, pp 247-258, 1987). Here, we explore TFAM binding at these two sites and compare them to LSP by multiple experimental and in silico methods. Our results show that TFAM binding is strongly modulated by the sequence-dependent properties of Site-X, Site-Y and LSP. The high binding versatility of Site-Y or the considerable stiffness of Site-X tune TFAM interactions. In addition, we show that increase in TFAM/DNA complex concentration induces multimerization, which at a very high concentration triggers disruption of preformed complexes. Therefore, our results suggest that mtDNA sequences induce non-uniform TFAM binding and, consequently, direct an uneven distribution of TFAM aggregation sites during the essential process of mtDNA compaction.


Figures

Figure 1.
Figure 1.
Site-X and Site-Y sites and their complexes with TFAM. (A) The sequences of Site-Y, Site-X and LSP described by Fisher and collaborators (14) are indicated in turquoise. Conserved Sequence Block (CSB) I, II and III are framed and indicated. TFAM Hmg-box1 (HMG1) and HMG-box2 (HMG2) domains are represented on Site-Y (HMG1 in dark magenta, HMG2 in red), Site-X (HMG1 in blue, HMG2 in violet), and on LSP (HMG1 in orange, HMG2 in green). Note the inverted orientation of TFAM on Site-Y with respect to the other two sequences. Black arrowheads indicate the insertion sites. mtDNA sequence numbering is shown on the left, numbering of the DNA sequence, on the top. (B) Aligned sequences used for crystallization (corresponding to dsDNA) are shown from 5′ to 3′ (black arrow). mtDNA sequence numbering is indicated. Sites inserted by HMG-box1 and HMG-box2 are indicated by red and green arrowheads, respectively. In the right column, the orientation of the HMG boxes on the DNAs is represented. (C) TFAM/Site-X complex. Coloring as in panel (A); the domains Hmg-box1 (HMG1), HMG-box2 (HMG2), and linker are indicated, together with the N-and C-terminal ends. Leu58 and Leu182 side chains are depicted in green. The DNA sequence is indicated in one-letter code. (D) TFAM/Site-Y complex, representation as in (C). Note the DNA sequence assignment is tentative. (E) Superposition of crystal structures of TFAM/LSP (in gray), TFAM/Site-X (blue) and TFAM/Site-Y (red) by respective HMG-box1 domains. (F) Superimposition by HMG-box2.
Figure 2.
Figure 2.
DNA parameters from complexes (from crystals) or naked (MD-derived) LSP (top), Site-X (middle) and Site-Y (bottom). Left column: the roll values (in degrees) for protein-bound (black) and naked DNA (gray) are shown. The high roll peaks in the crystal structures correspond to the insertion sites, indicated by the arrows (left arrow, Leu58 insertion site; right arrow Leu182 site). For Site-Y, the tentative orientation assigned in the crystal (in gray) and the previously predicted orientation (14) (in light blue) are shown. Right column, the stiffness (Ktot) of LSP, Site-X and Site-Y are shown along the sequences, which are aligned. The sites inserted by Leu58 and Leu182 in the X-ray structures are indicated by black vertical arrows. For Site-Y, the previously proposed insertion sites (14) are indicated by gray arrows.
Figure 3.
Figure 3.
The minor groove width (Y axis) is shown for each DNA step (X axis, each DNA step is numbered). Below, the sequences are represented. Site-X is shown in light (naked) and dark (crystal) blue, Site-Y in orange and red, LSP in light and dark gray.
Figure 4.
Figure 4.
Binding of TFAM to Site-Y, Site-X and LSP. In (A), gel-shift assays (EMSA) show TFAM-inducing equivalent DNA migration to all sequences. Lane ‘0’ contains free DNA (1 nM). In subsequent lanes from left to right, 32P-labeled DNA at 1 nM was titrated with TFAM at increasing amounts (as indicated above the corresponding lanes). The DNA shift corresponding to the complexes is indicated as ‘DNA+TFAM’. In (B), the measurements of TFAM binding to DNA are fitted to a modified Hill equation (see Materials and Methods). TFAM in complex with Site-X is shown with black circles; in complex with Site-Y with squares; and in complex with LSP with diamonds.
Figure 5.
Figure 5.
Differential binding of TFAM to Site-X, Site-Y, and LSP. The upper left panel shows competition of TFAM-bound *Site-X (0.4 μM of DNA, 0.8 μM of TFAM) labeled with fluorescein) with increasing concentrations of unlabeled LSP (from 0.2 to 3.2μM), by EMSA. Right upper panel: similar competition of LSP, here against *Site-Y (also labeled). The lower panels show competition of TFAM-bound *Site-X (left) or *Site-Y (right) by increasing amounts (from 0.2 to 3.2 μM) of unlabeled Site-Y or Site-X, respectively. Lane 0 contains complexes with labeled DNA (0.4 μM *DNA + 0.8 μM TFAM). The input labeled *DNA control is shown at the far-left lane of the gels.
Figure 6.
Figure 6.
Isothermal titration calorimetry of TFAM binding to LSP, Site-X and Site-Y. Top: representative isothermal titration calorimetry thermograms from the measurements done with LSP (left), Site-X (centre) and Site-Y (right). Below: fitting of the binding isotherms to a model with one binding site (red curve).
Figure 7.
Figure 7.
Multimerization of TFAM on the DNA depends on complex concentration. Non-denaturing polyacrylamide gels (10%) that contain, from left to right, increasing concentrations of a mixture of TFAM WT (top gel), TFAM-CTΔ26 (middle gel) and TFAM-Box1Mut (bottom gel) proteins mixed with LSP (22 bp used for crystallization) in a protein/DNA ratio of 4:1. DNATOT refers to total DNA, from which 10 nM was labeled. At low concentrations, the complex runs as a single band (LSP+TFAM) corresponding to a 1:1 protein:DNA ratio. At 0.8 μM of protein (0.2 μM DNA), an upper shift appears in TFAM-WT concomitant with progressive fading of both the first shift and the free DNA (LSP).
Figure 8.
Figure 8.
SEC-MALLS and AUC analyses of TFAM in complex with Site-X, Site-Y and LSP. Left graphs column: SEC-MALLS experiments are shown. The light scattering curve (LS) is shown in red, the differential refracting index curve (dRI-curve) in blue and the molecular weight peaks in green. The Y axis on the left reports the light scattering signal while the Y axis on the right shows the molecular weight. Central and right graphs columns correspond to analytical ultracentrifugation measurements (AUC) at Protein:DNA ratios of 2:1 and 4:1 respectively. In each graph, the continuous size distribution coefficient (S) is represented for the sedimentation coefficient (c(s)) values. First row corresponds to analyses of TFAM/Site-X complexes, second row to TFAM/Site-Y, and bottom row to TFAM/LSP. Peaks encircled as 1 and 2 in MALLS correspond to the same peaks in SV (AUC).
Figure 9.
Figure 9.
Confirmation of TFAM orientation on Site-X and Site-Y by FRET. (A) Design of the DNAs used for FRET assays. The 22 bp sequences from Site-X (blue sequence) and Site-Y (in red) are aligned based on the protein structure superposition. Note that the sequences follow opposite directions (compare with Figure 1B). Black squares Box 1 and 2 correspond to HMGbox1 and 2, respectively. The gray squares indicate the formerly predicted position of TFAM domains on Site-Y (note the inversion of the HMGboxes). Full-length TFAM is labeled with A488 at the C-terminal Cys246 (green C dot). The TFAM-Box1Mut non-dimerizing mutant is labeled at Cys49 (green N dot). Gray ‘N’ and ‘C’ dots correspond to the positions of labeled cysteines in case the orientation of TFAM on Site-Y followed the initial prediction (14). The red circle symbolizes the DNA 5′ end labeled with A594. Regarding the DNA sequences, the dots between bp indicate the insertion sites. In gray, the added bp of the mtDNA sequence to enlarge Site-X and Site-Y to 28 bp (upon superposition with the 28 bp TFAM/LSP structure (17)) is shown. Due to this enlargement, a new potential insertion site, TG-10bp-CA (in green), appeared in Site-Y, which was mutated to AG-10bp-CA. In addition, bases at the 5′ ends were mutated to Thy (underlined) to avoid stacking interactions with the dye. (B) Fluorescence emission spectra of single (TFAM-Box1Mut*/Site-X, dark blue curve) and double-labeled TFAM-Box1Mut*/Site-X5* (in green), and TFAM-Box1Mut*/Site-X3* (in sky blue) complexes excited at 495 nm (a.u., arbitrary units). (C) Same as in (B) but for complexes TFAM-Box1Mut*/Site-Y (dark red curve), TFAM-Box1Mut*/Site-Y5* (red curve) and TFAM-Box1Mut*/Site-Y3* (in violet).

Similar articles

Cited by

References

    1. Ruiz-Pesini E., Lott M.T., Procaccio V., Poole J.C., Brandon M.C., Mishmar D., Yi C., Kreuziger J., Baldi P., Wallace D.C.. An enhanced MITOMAP with a global mtDNA mutational phylogeny. Nucleic Acids Res. 2007; 35:D823–D828. - PMC - PubMed
    1. Herst P.M., Rowe M.R., Carson G.M., Berridge M.V.. Functional mitochondria in health and disease. Front. Endocrinol. (Lausanne). 2017; 8:296. - PMC - PubMed
    1. Lopez-Lluch G. Mitochondrial activity and dynamics changes regarding metabolism in ageing and obesity. Mech. Ageing. Dev. 2017; 162:108–121. - PubMed
    1. Burte F., Carelli V., Chinnery P.F., Yu-Wai-Man P.. Disturbed mitochondrial dynamics and neurodegenerative disorders. Nat. Rev. Neurol. 2015; 11:11–24. - PubMed
    1. Chang D.D., Clayton D.A.. Precise identification of individual promoters for transcription of each strand of human mitochondrial DNA. Cell. 1984; 36:635–643. - PubMed

Publication types