. 2019 Oct 18;25(11):1788-1795.
doi: 10.1093/ibd/izz103.

CARMIL2 Deficiency Presenting as Very Early Onset Inflammatory Bowel Disease

Affiliations

CARMIL2 Deficiency Presenting as Very Early Onset Inflammatory Bowel Disease

Thomas Magg et al. Inflamm Bowel Dis. .

Abstract

Background: Children with very early onset inflammatory bowel diseases (VEO-IBD) often have a refractory and severe disease course. A significant number of described VEO-IBD-causing monogenic disorders can be attributed to defects in immune-related genes. The diagnosis of the underlying primary immunodeficiency (PID) often has critical implications for the treatment of patients with IBD-like phenotypes.

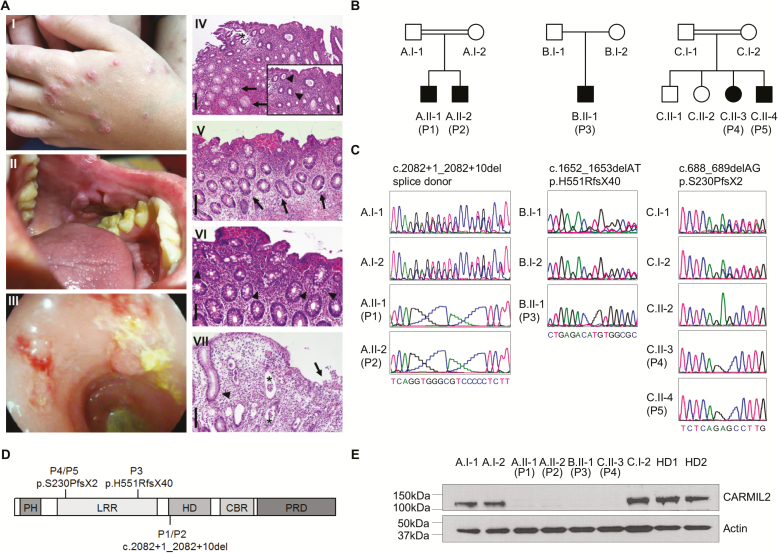
Methods: To identify the molecular etiology in 5 patients from 3 unrelated kindred with IBD-like symptoms, we conducted whole exome sequencing. Immune workup confirmed an underlying PID.

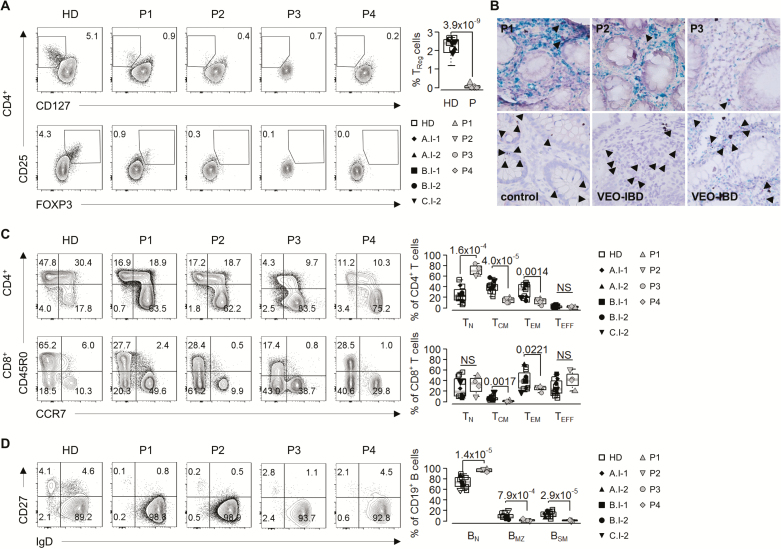
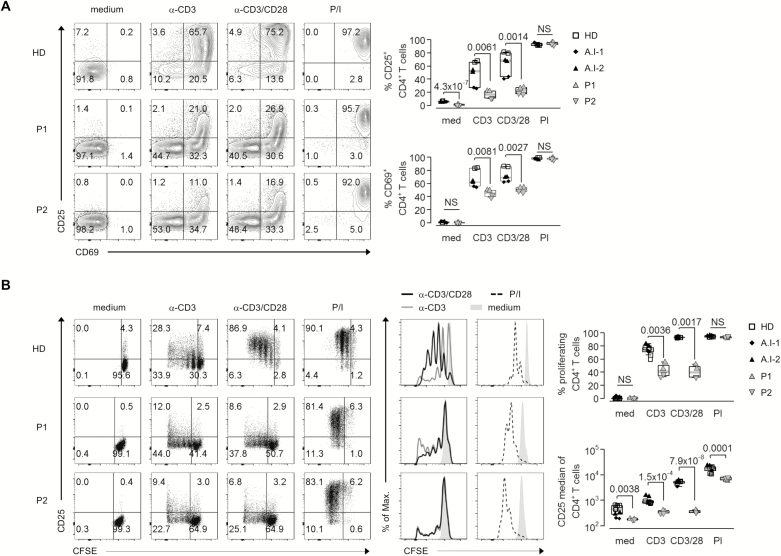
Results: Whole exome sequencing revealed 3 novel CARMIL2 loss-of-function mutations in our patients. Immunophenotyping of peripheral blood mononuclear cells showed reduction of regulatory and effector memory T cells and impaired B cell class switching. The T cell proliferation and activation assays confirmed defective responses to CD28 costimulation, consistent with CARMIL2 deficiency.

Conclusion: Our study highlights that human CARMIL2 deficiency can manifest with IBD-like symptoms. This example illustrates that early diagnosis of underlying PID is crucial for the treatment and prognosis of children with VEO-IBD.

Keywords: CARMIL2; immunodeficiency; very early onset inflammatory bowel diseases.


Figures

FIGURE 1.
FIGURE 1.
Identification of patients with IBD-like phenotypes and novel loss-of-function mutations in CARMIL2. A, The index patient P2 presented with nodular dermatitis (I), oral aphthous lesions (II), and pancolitis with edematous colonic mucosa with loss of vascularity, ulcerations, fresh bleeding, and pseudopolypoid lesions (III). Histopathological analysis of colonic biopsies from P1, P2, and P3 confirmed active colitis: P1 displayed a moderately active colitis with granulocytic accentuation in the upper third of the mucosa and the surface epithelial layer (inlay; arrowheads) and mucoid metaplasia (arrows) (IV). The asterisk indicates an artificial defect. P2 showed a mildly chronic active colitis with increased epithelial regeneration (arrows, V) and marked increase of eosinophilic granulocytes (arrowheads, VI). P3 displayed a moderately chronic and highly active colitis with mucosal edema and ulceration (arrow), the formation of numerous crypt abscesses (astericks) and regenerative crypt hyperplasia (arrowhead) (VII). Scale bars indicate 200 µm in (IV, V, VII) and 100 µm in (VI, inlay of IV), respectively. B, Pedigrees of 5 patients from 3 unrelated kindred (A–C) with IBD-like symptoms (P1–P5). C, DNA Sanger sequencing confirmed biallelic CARMIL2 mutations. D, Schematic representation of CARMIL2 and localization of the identified mutations. Abbreviations: PH, pleckstrin homology domain; LRR, leucine-rich repeat; HD, homodimerization domain; CBR, capping protein binding region; PRD, proline-rich region. E, Immunoblotting of CARMIL2 protein expression in T lymphoblasts derived from healthy donors (HD), parents, and patients. Actin was used as loading control. Data are representative for 3 experiments.
FIGURE 2.
FIGURE 2.
Impaired regulatory and effector T cell development and defective B cell maturation in patients with CARMIL2 deficiency. A, Representative contour plots of CD4+CD25+CD127low and CD4+CD25+FOXP3+ Treg cell percentages in PBMC from healthy donors (HD) and patients (P1, P2, P3, P4) (left panel). Graphical representation of CD4+CD25+CD127lowFOXP3+ Treg cell percentages (right panel) of 3 independent experiments with individual data points from five HD, parents, and patients. B, Representative RNAscope duplex in situ hybridization of CD4 (green, blue) and FOXP3 (red, arrowheads) in formalin-fixed paraffin-embedded colonic sections from CARMIL2-deficient patients (P1, P2, and P3), patients without IBD (control), and unrelated patients with undefined VEO-IBD. Images are 40X. C, Contour plots of CD45R0-CCR7+ naive (TN), CD45R0+CCR7+ central memory (TCM), CD45R0+CCR7-effector memory (TEM), and CD45R0-CCR7-effector (TE) CD4+ and CD8+ T cells from healthy donors (HD) and patients (P1, P2, P3, P4) (left panel). Graphs indicate CD4+ and CD8+ T cell subtypes for 6 different HD, parents and patients (right panel). D, Contour plots of IgD+CD27-naïve (BN), IgD+CD27+ marginal zone (BMZ), and IgDCD27+ switched memory (BSM) CD19+ B cells from healthy donors (HD) and patients (left panel). Graphs show CD19+ B cell subtypes for 6 different HD, parents, and patients (right panel). HD (white square), A.I-1 (black rhomb), A.I-2 (black up-pointing triangle), B.I-1 (black square), B.I-2 (black circle), C.I-2 (black down-pointing triangle), P1 (gray up-pointing triangle), P2 (gray down-pointing triangle), P3 (gray circle), and P4 (gray rhomb).
FIGURE 3.
FIGURE 3.
Defective proliferation and activation of CARMIL2-deficient T cells upon CD28 costimulation. A, Flow cytometric analysis of CD4+ T cell activation in PBMC from HD, P1, and P2 based on CD25 and CD69 surface expression without (medium) and 2d after stimulation with anti-CD3 coupled beads (α-CD3), anti-CD3 coupled beads plus soluble anti-CD28 (αCD3/CD28), or PMA/ionomycin (P/I) (left panel). B, Dot plots and overlay histogram plots of CFSE dilution and CD25 expression for CD4+ T cells in PBMC from HD, P1, and P2 without (medium) and after stimulation for 5d with anti-CD3 coupled beads (α-CD3), anti-CD3 coupled beads plus soluble anti-CD28 (αCD3/CD28), or PMA/ionomycin (P/I) (left panel). Graphs showing activated CD4+ T cells (A) and proliferated CD4+ T cells and median of CD25 expression (B) in HD (white square), A.I-1 (black rhomb), A.I-2 (black up-pointing triangle), P1 (gray up-pointing triangle), and P2 (gray down-pointing triangle), n = 2 (right panels).

References

    1. Uhlig HH. Monogenic diseases associated with intestinal inflammation: implications for the understanding of inflammatory bowel disease. Gut. 2013;62:1795–1805. - PubMed
    1. Bousfiha A, Jeddane L, Picard C, et al. . The 2017 IUIS phenotypic classification for primary immunodeficiencies. J Clin Immunol. 2018;38:129–143. - PMC - PubMed
    1. Fischer A. Human primary immunodeficiency diseases: a perspective. Nat Immunol. 2004;5:23–30. - PubMed
    1. Glocker EO, Kotlarz D, Boztug K, et al. . Inflammatory bowel disease and mutations affecting the interleukin-10 receptor. N Engl J Med. 2009;361:2033–2045. - PMC - PubMed
    1. Pachlopnik Schmid J, Canioni D, Moshous D, et al. . Clinical similarities and differences of patients with X-linked lymphoproliferative syndrome type 1 (XLP-1/SAP deficiency) versus type 2 (XLP-2/XIAP deficiency). Blood. 2011;117:1522–1529. - PubMed

Publication types

Substances