. 2019 Jun 21;144(12):3790-3799.
doi: 10.1039/c9an00500e. Epub 2019 May 22.

Inkjet-printed micro-calibration standards for ultraquantitative Raman spectral cytometry

Affiliations

Inkjet-printed micro-calibration standards for ultraquantitative Raman spectral cytometry

Vernon LaLone et al. Analyst. .

Abstract

Herein we report the development of a cytometric analysis platform for measuring the contents of individual cells in absolute (picogram) scales; this study represents the first report of Raman-based quantitation of the absolute mass - or the total amount - of multiple endogenous biomolecules within single-cells. To enable ultraquantitative calibration, we engineered single-cell-sized micro-calibration standards of known composition by inkjet-printer deposition of biomolecular components in microarrays across the surface of silicon chips. We demonstrate clinical feasibility by characterizing the compositional phenotype of human skin fibroblast and porcine alveolar macrophage cell populations in the respective contexts of Niemann-Pick disease and drug-induced phospholipidosis: two types of lipid storage disorders. We envision this microanalytical platform as the foundation for many future biomedical applications, ranging from diagnostic assays to pathological analysis to advanced pharmaco/toxicokinetic research studies.


Conflict of interest statement

Conflicts of interest

The authors declare the following competing interest(s): Dr. Gus R. Rosania is a consultant for Bristol-Myers Squibb.

Figures

Figure 1.
Figure 1.
Reflected light images of 1000pg protein (a), 900pg HDL (b), and fibroblast (c) samples; scale bars: 20μm. Respective AFM surface profiles (d-f); scale bars: 20μm. Respective single-band Raman images reconstructed from C-H vibrations at 2930cm−1 (g-i) and calculated integrated Raman spectra for each overlaid on same y-axis (j); scale bars: 10μm.
Figure 2.
Figure 2.
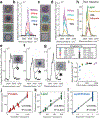
Reflected brightfield images, analysis areas and corresponding integrated spectra for (a-b) protein, (c-d) HDL, and (e-g) mixed composition micro-calibration standards; scale bars: 20μm. (h) Reference spectra library for linear combination modelling. (i) Accuracy of spectral fits. Linear regression of measured component content in relation to expected amount for protein (j), lipid (k), and lipid-to-protein ratio (l); shaded regions: 95% confidence interval.
Figure 3.
Figure 3.
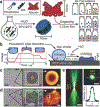
(a) Data acquisition and processing procedure; scale bars (from top-left to bottom-right): 1000μm, 100μm, and 10μm. Multi-band Raman images for (b) human skin fibroblasts (scale bar: 20μm) and (c) pig alveolar macrophages (scale bar: 10μm). (d) Reference spectra for linear combination modelling. (e) Single-cell compositional correlation plot and histograms showing fibroblast population distributions; each data point represents a single cell. WT in black, NPC in red. (f) First two PCA loading spectra and PCA score distribution plots (WT in black, NPC in red). (g) Single-cell compositional correlation plot and histograms showing alveolar macrophage population distributions; each data point represents a single cell. Untreated control group in black, drug-treated group in green. (h) First two PCA loading spectra and PCA score distribution plots (untreated in black, drug-treated in green).
Scheme 1.
Scheme 1.
(a) Procedure for HDL synthesis and biomolecular ink formulations. (b) Piezoelectric jetting waveform for controlled-deposition of 10pL ink droplets onto silicon substrate. Reflected brightfield images of 5×5mm silicon chips (scale bars: 1000μm) and sample areas of interest with corresponding Raman area scan (white box; scale bars: 10μm) data for (c) fabricated micro-calibration standards and (d) fibroblasts. Raman images reconstructed from C-H vibration intensity at 2930cm−1. (e) Vertical cross-section of confocal voxel; reflected light image stack was used to reconstruct in 3D. Scale bars: 3μm (left) and 1μm (right).

References

    1. Yang Y, Huang Y, Wu J, Liu N, Deng J and Luan T, TrAC Trends in Analytical Chemistry, 2017, 90, 14–26.
    1. Wassif CA, Cross JL, Iben J, Sanchez-Pulido L, Cougnoux A, Platt FM, Ory DS, Ponting CP, Bailey-Wilson JE, Biesecker LGand Porter FD, Genetics In Medicine, 2015, 18, 41. - PMC - PubMed
    1. Liscum L, Ruggiero RM and Faust JR, The Journal of Cell Biology, 1989, 108, 1625–1636. - PMC - PubMed
    1. Tängemo C, Weber D, Theiss S, Mengel E and Runz H, Journal of Lipid Research, 2011, 52, 813–825. - PMC - PubMed
    1. Martin WJ and Standing JE, Journal of Pharmacology and Experimental Therapeutics, 1988, 244, 774–779. - PubMed