. 2019 May 22;15(5):e1007787.
doi: 10.1371/journal.ppat.1007787. eCollection 2019 May.

Circuit diversification in a biofilm regulatory network

Affiliations

Circuit diversification in a biofilm regulatory network

Manning Y Huang et al. PLoS Pathog. .

Erratum in

Abstract

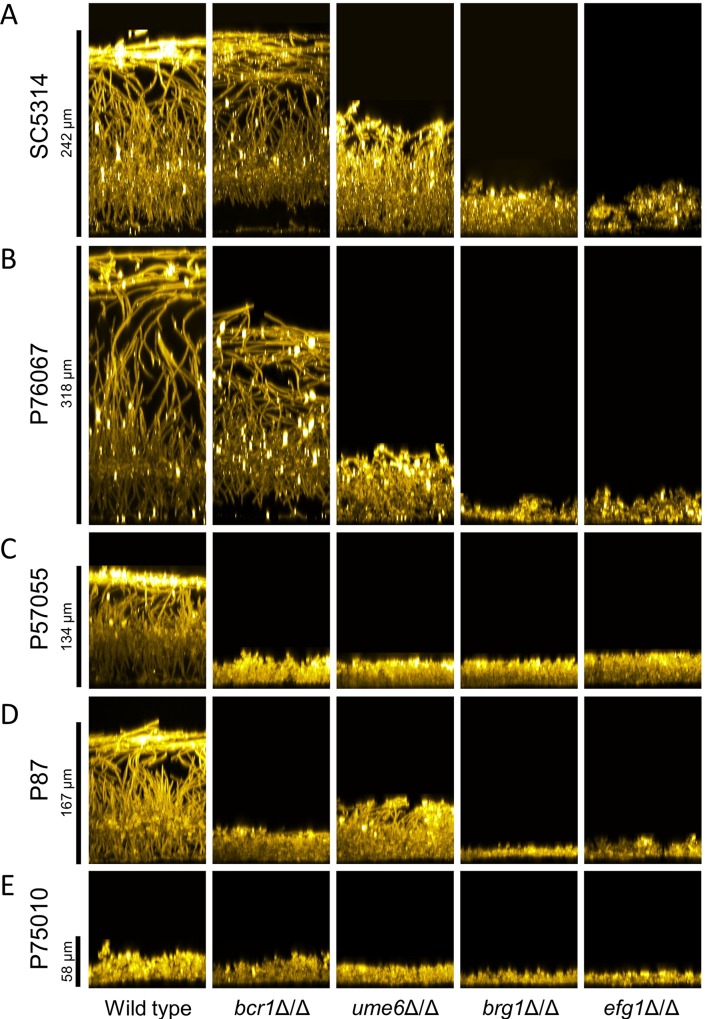
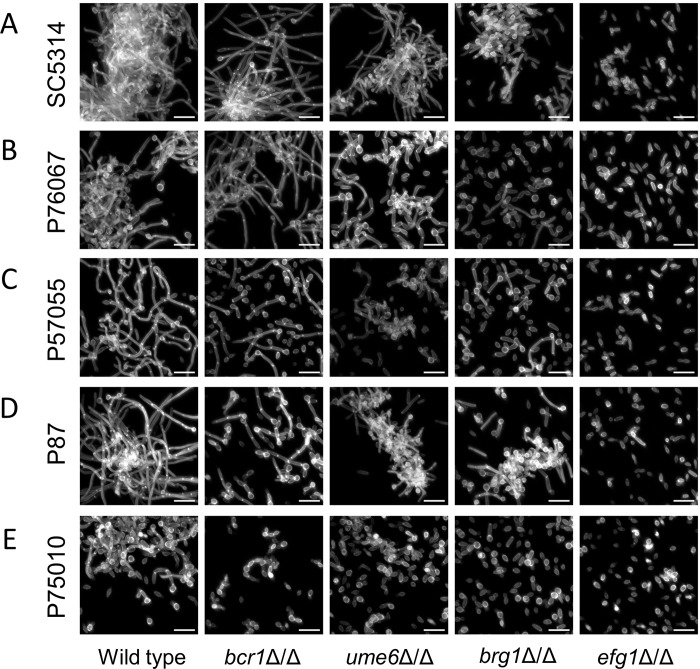
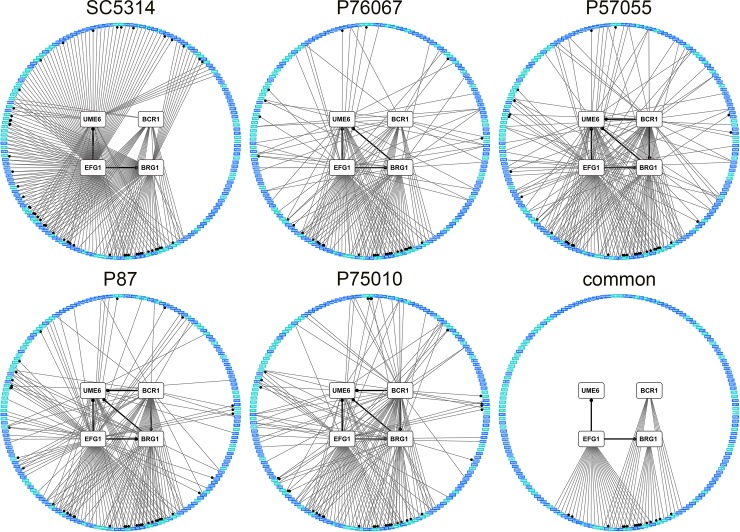
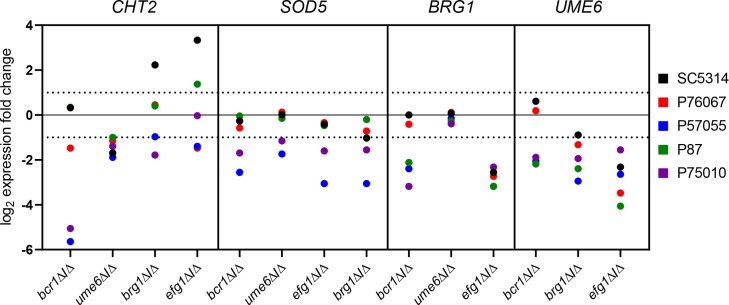
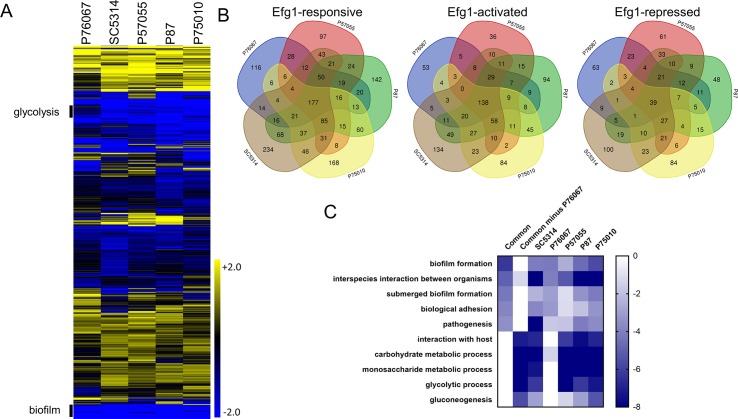
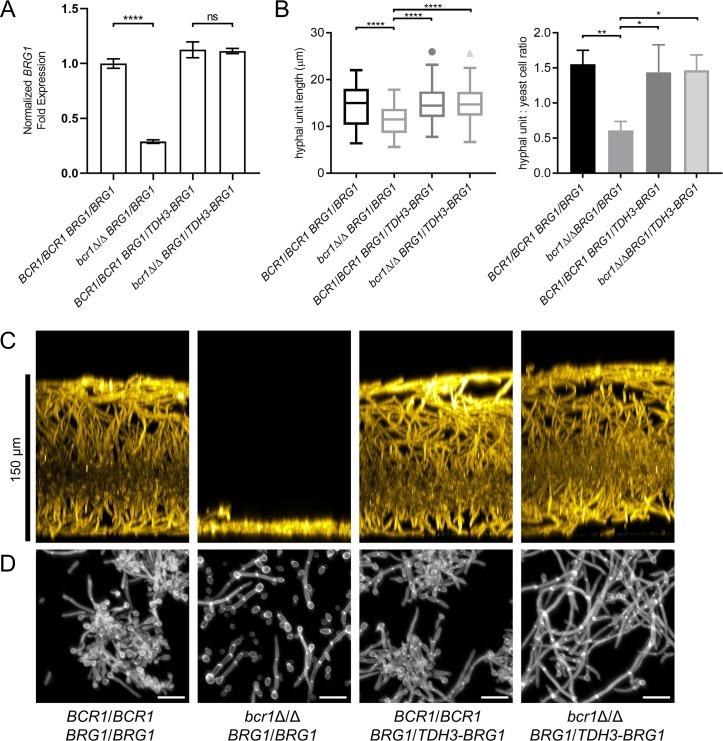
Genotype-phenotype relationships can vary extensively among members of a species. One cause of this variation is circuit diversification, the alteration of gene regulatory relationships among members of a species. Circuit diversification is thought to be a starting point for the circuit divergence or rewiring that occurs during speciation. How widespread is circuit diversification? Here we address this question with the fungal pathogen Candida albicans, which forms biofilms rich in distinctive hyphal cells as a prelude to infection. Our understanding of the biofilm/hyphal regulatory network comes primarily from studies of one clinical isolate, strain SC5314, and its marked derivatives. We used CRISPR-based methods to create mutations of four key biofilm transcription factor genes-BCR1, UME6, BRG1, and EFG1 -in SC5314 and four additional clinical isolates. Phenotypic analysis revealed that mutations in BCR1 or UME6 have variable impact across strains, while mutations in BRG1 or EFG1 had uniformly severe impact. Gene expression, sampled with Nanostring probes and examined comprehensively for EFG1 via RNA-Seq, indicates that regulatory relationships are highly variable among isolates. Our results suggest that genotype-phenotype relationships vary in this strain panel in part because of differences in control of BRG1 by BCR1, a hypothesis that is supported through engineered constitutive expression of BRG1. Overall, the data show that circuit diversification is the rule, not the exception, in this biofilm/hyphal regulatory network.


Conflict of interest statement

The authors have declared that no competing interests exist.

Figures

Fig 1
Fig 1. Biofilm side-view projections.
Wild-type and mutant strains in each clinical isolate background were assayed for biofilm formation under in vitro conditions. All strains were grown on silicone squares in RPMI + 10% serum at 37°C for 24 hours. Fixed biofilms were stained using Concanavalin A, Alexa Fluor 594 conjugate, then imaged by confocal microscopy. Representative sections from each biofilm are shown; relevant genotypes are given beneath each column. Scale bars indicate the depth of the corresponding wild-type biofilm. Strain backgrounds: A. SC5314. B. P76067. C. P57055. D. P87. E. P75010.
Fig 2
Fig 2. Biofilm apical-view projections.
Apical views of representative sections from each clinical isolate and mutant biofilm are shown. Relevant genotypes are given beneath each column. White scale bars in each panel are 20μm in length. Projections were generated with the same datasets used in Fig 1. Strain backgrounds: A. SC5314. B. P76067. C. P57055. D. P87. E. P75010.
Fig 3
Fig 3. Filamentation assays.
Wild-type and mutant strains of each background were assayed for filamentation under planktonic growth conditions. Strains were grown in RPMI + 10% serum at 37°C for 4 hours with shaking. Fixed cells were stained with Calcofluor-white for confocal microscopy. White scale bars in each panel are 20μm in length. Strain backgrounds: A. SC5314. B. P76067. C. P57055. D. P87. E. P75010.
Fig 4
Fig 4. Variation in the C. albicans biofilm/hyphal regulatory network.
Network diagrams are presented for each clinical isolate as well as for features shared among them ("Common"). Nodes represent genes analyzed by Nanostring, with white denoting the four TF genes, and blue and teal denoting prospective target genes. Node positions are identical across network graphs. The teal color indicates that the gene is annotated for function in biofilm or hyphal formation. A significant gene expression alteration by a TF gene mutation is denoted by an edge between two nodes; a dot on an edge indicates the connected TF was reported to bind in the upstream region of the target gene [16,23]. A significant gene expression alteration was defined as a two-fold difference in mRNA level difference between mutant and wild type, and a significant difference in mean mRNA Nanostring counts between mutant and wild type (Benjamini-Hochberg step-up procedure, FDR = 0.1). Three biological replicates were analyzed using Nanostring for all strains.
Fig 5
Fig 5. Range of TF mutant gene expression impact.
Fold-change values are plotted for RNAs from the CHT2, SOD5, BRG1, and UME6 genes in each TF mutant in all five strain backgrounds. Three biological replicates were analyzed using Nanostring for all strains. Data are extracted from S1 Table.
Fig 6
Fig 6. Genome-wide Efg1 regulons.
Global expression was assayed using RNA-Seq. Three biological replicates were analyzed for each efg1Δ/Δ mutant and clinical isolate. Fold change values were determined using DeSeq2. A. Heatmap depicting log2 fold change in gene expression. Upper (Yellow) and lower bounds (Blue) correspond to a log2 fold change value of 2 and -2 respectively. Sections labeled glycolysis and biofilm are enriched for genes annotated for roles in glycolysis and biofilm formation respectively. B. Venn diagrams depicting intersection of genes dependent upon EFG1 in each clinical isolate background. We considered all genes that were significantly differentially expressed (p<0.05, Benjamini-Hochberg adjustment), and had at least a 2 fold difference in expression between efg1Δ/Δ mutant and wild type. C. Heatmap depicting p-values from GO term analysis of sets of genes that had significantly lower expression in the efg1Δ/Δ mutant vs matched wild type. The analyzed sets were the set of genes dependent upon SC5134, P76067, P57055, P87, and P75010, the set of genes common to all 5 clinical isolates (SC5134 ∩ P76067 ∩ P57055 ∩ P87 ∩ P75010), and the set of genes common to all clinical isolates except P76067 (SC5134 ∩ P57055 ∩ P87 ∩ P75010—P76067). Upper (white) and lower bounds (dark blue) corresponding to a log10 P-value of 0 and -8 respectively.
Fig 7
Fig 7. Impact of constitutive BRG1 expression in a Bcr1-dependent strain background.
Parental BRG1/BRG1 strains and derived BRG1/TDH3-BRG1 were assayed for planktonic hyphal formation and biofilm production in RPMI + 10% serum at 37°C. Planktonic cultures were grown for 4 hours, and biofilm cultures were grown for 24 hours. A. Fold change in expression of BRG1 mRNA analyzed by Nanostring. Values shown are mean (SD). Significance is indicated above horizontal bars (Tukey-Kramer test; “****”, P < 0.0001). Three biological replicates were analyzed. B. Hyphal length and hypha to yeast ratios were quantified in planktonic culture samples. Values shown are mean (SD). Three technical replicates were performed for each strain. Pairs of means connected by a horizontal bar are significantly different (Tukey-Kramer test; “*”, P < 0.05; “**”, P < 0.01; “****”, P<0.0001); all unconnected pairs are not significantly different. C. Side-view projections of biofilms stained with ConA-Alexafluor 594 conjugate. Scale bar on left indicates depth of wild-type biofilm. D. Images of planktonic culture samples stained with Calcofluor-white. White scale bars in each panel are 20μm in length.

References

    1. Albert FW, Kruglyak L (2015) The role of regulatory variation in complex traits and disease. Nat Rev Genet 16: 197–212. 10.1038/nrg3891 - DOI - PubMed
    1. Sardi M, Gasch AP (2018) Genetic background effects in quantitative genetics: gene-by-system interactions. Curr Genet 64: 1173–1176. 10.1007/s00294-018-0835-7 - DOI - PubMed
    1. Schacherer J (2016) Beyond the simplicity of Mendelian inheritance. C R Biol 339: 284–288. 10.1016/j.crvi.2016.04.006 - DOI - PubMed
    1. Dowell RD, Ryan O, Jansen A, Cheung D, Agarwala S, et al. (2010) Genotype to phenotype: a complex problem. Science 328: 469 10.1126/science.1189015 - DOI - PMC - PubMed
    1. Ryan O, Shapiro RS, Kurat CF, Mayhew D, Baryshnikova A, et al. (2012) Global gene deletion analysis exploring yeast filamentous growth. Science 337: 1353–1356. 10.1126/science.1224339 - DOI - PubMed

Publication types