. 2019 May 21;27(8):2262-2271.e5.
doi: 10.1016/j.celrep.2019.04.094.

Oligodendrocytes Support Neuronal Glutamatergic Transmission via Expression of Glutamine Synthetase

Affiliations

Oligodendrocytes Support Neuronal Glutamatergic Transmission via Expression of Glutamine Synthetase

Wendy Xin et al. Cell Rep. .

Abstract

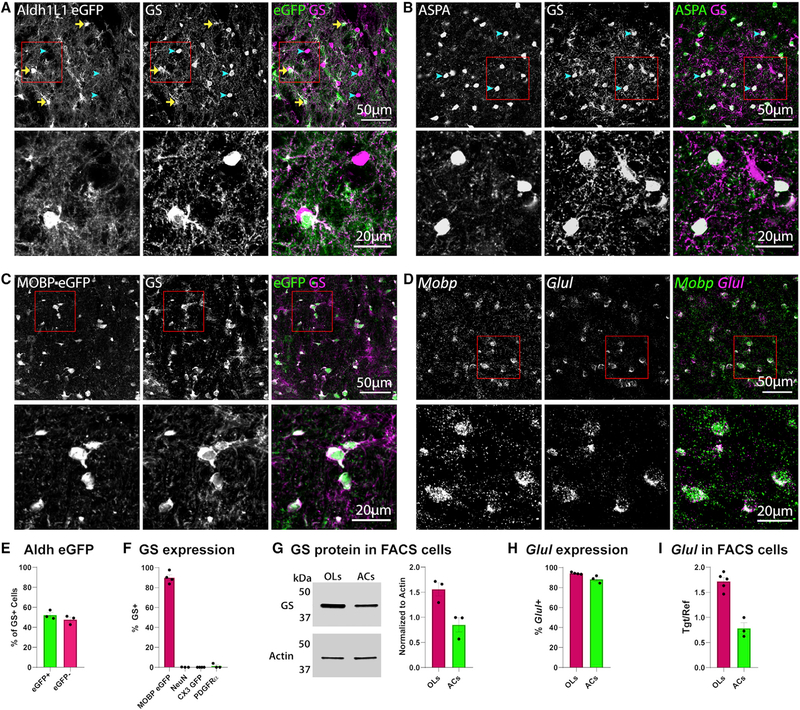
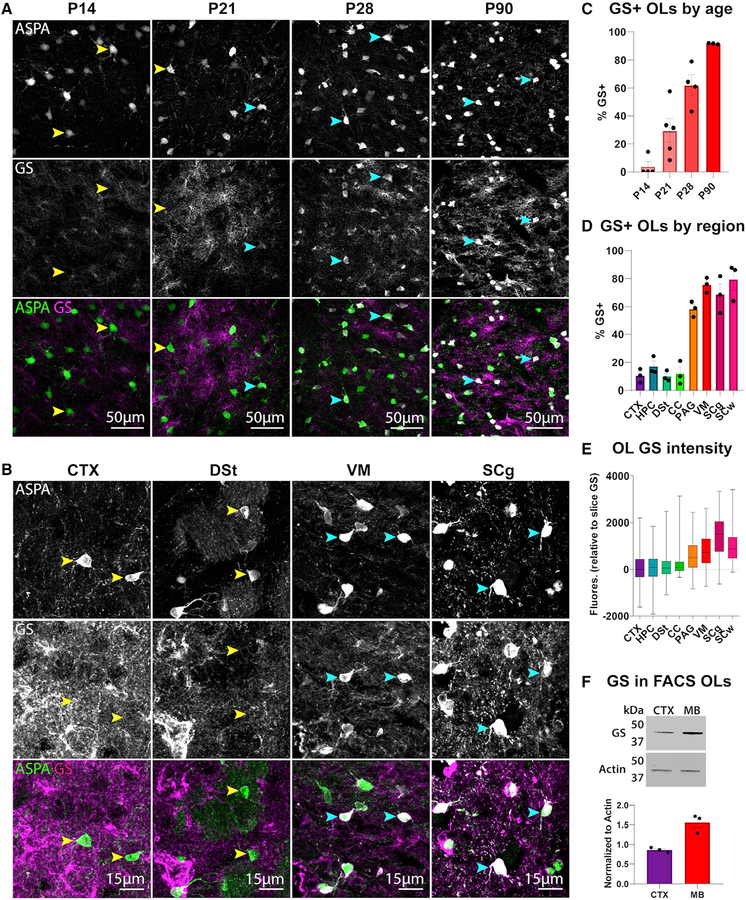
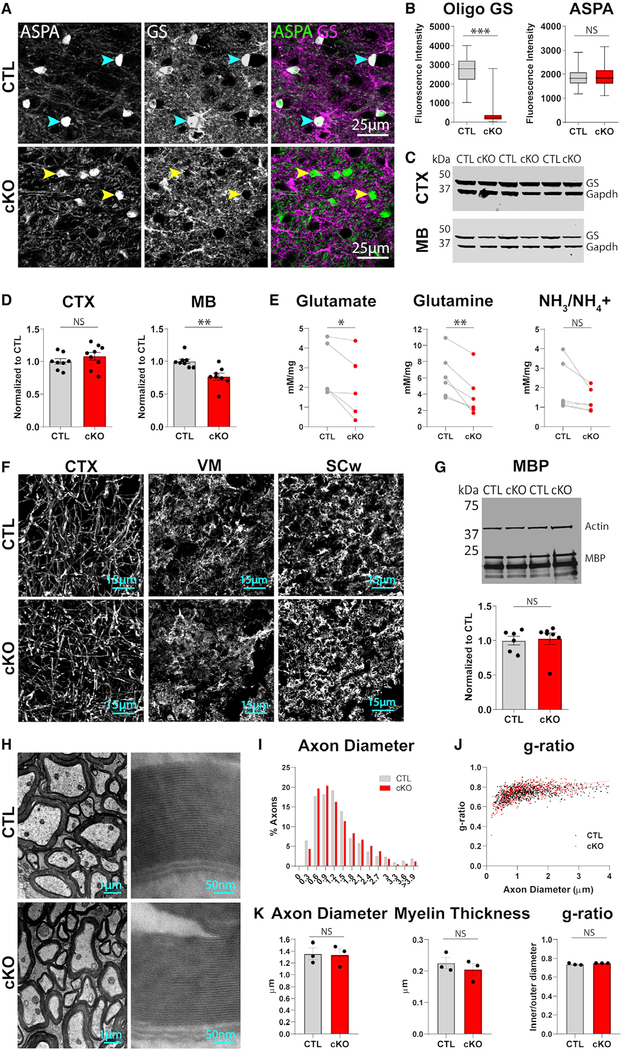
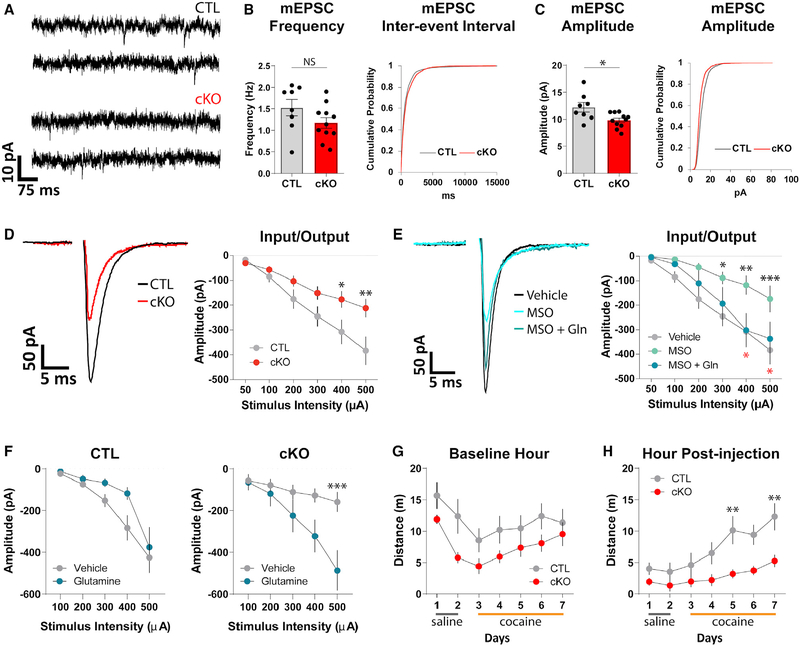
Glutamate has been implicated in a wide range of brain pathologies and is thought to be metabolized via the astrocyte-specific enzyme glutamine synthetase (GS). We show here that oligodendrocytes, the myelinating glia of the central nervous system, also express high levels of GS in caudal regions like the midbrain and the spinal cord. Selective removal of oligodendrocyte GS in mice led to reduced brain glutamate and glutamine levels and impaired glutamatergic synaptic transmission without disrupting myelination. Furthermore, animals lacking oligodendrocyte GS displayed deficits in cocaine-induced locomotor sensitization, a behavior that is dependent on glutamatergic signaling in the midbrain. Thus, oligodendrocytes support glutamatergic transmission through the actions of GS and may represent a therapeutic target for pathological conditions related to brain glutamate dysregulation.

Keywords: cocaine; glia; glutamate; glutamine; glutamine synthetase; midbrain; oligodendrocyte; transmission.


Conflict of interest statement

DECLARATION OF INTERESTS

The authors declare no competing interests.

Figures

Figure 1.
Figure 1.. Oligodendrocytes Express GS mRNA and Protein
(A) Confocal image taken in the ventral midbrain of a P60 Aldh1L1-EGFP mouse, immunolabeled with anti-GS. Yellow arrows indicate EGFP+ GS+ astrocytes; blue arrowheads indicate EGFP−GS+ cells. (B) Immunostaining for the mature oligodendrocyte marker aspartoacylase (ASPA) and GS in the ventral midbrain of a P60 wild-type mouse; blue arrowheads indicate GS+ oligodendrocytes. (C) Immunostaining for GS in the ventral midbrain of a P60 MOBP-EGFP mouse. (D) In situ hybridization for Mobp and Glul in the ventral midbrain of a P63 wild-type mouse. In (A)–(D), the bottom panel is a zoom of the area within the red box in the top image. (E) Quantification of the percentage of GS+ cells that are EGFP+ or EGFP−; n = 3 mice. (F) Quantification of % oligodendrocytes (MOBP EGFP+), neurons (NeuN+), microglia (CX3CR1 GFP+), or oligodendrocyte progenitors (PDGFRa+) expressing GS; n = 3–4 mice per cell type. For example images, see Figures S1A–S1C. (G) Western blot for GS in FACS-isolated oligodendrocytes and astrocytes. The cell number was the same in each sample. For quantification, GS signal was normalized to loading control Actin; n = 3 mice per cell type. (H) Quantification of % oligodendrocytes or astrocytes expressing Glul mRNA; n = 3–4 mice per cell type. For example images, see Figure S1E. (I) qPCR for Glul in FACS-isolated oligodendrocytes and astrocytes. For quantification, Glul was normalized to sample Gapdh; n = 3–5 mice per cell type. (E–I) Error bars indicate SEM.
Figure 2.
Figure 2.. Oligodendrocyte GS Expression Appears at 3 Weeks Postnatally and Is Regionally Heterogeneous
(A) Immunostaining of ASPA and GS in the ventral midbrain of wild-type mice at 14, 21, 28, and 90 days postnatally. (B) Immunostaining of ASPA and GS in the cortex (CTX), dorsal striatum (DSt), ventral midbrain (VM), and spinal cord gray matter (SCg) of P60 wild-type mice. In (A) and (B), yellow arrowheads indicate GS− oligodendrocytes, and blue arrowheads indicate GS+ oligodendrocytes. (C) Percentage of ASPA+ oligodendrocytes expressing GS per animal at different ages. Percentages are calculated from two sections per animal and averaged; n = 3–4 mice per age. (D) Quantification of % oligodendrocytes expressing GS in each region; n = 3 mice. One-way ANOVA, F(7,16) = 43.02, p < 0.0001. (E) Box and whisker plot of GS fluorescence intensity within ASPA+ oligodendrocytes relative to slice GS fluorescence; values represent GS fluorescence within individual oligodendrocytes minus mean slice GS fluorescence. Whiskers represent minimum and maximum values; n = 500–950 cells per region sampled from 3 animals. Kruskal-Wallis statistic = 1789, p < 0.0001. (F) Western blot for GS from FACS-isolated oligodendrocytes in the cortex or midbrain (MB); n = 3 mice per region. Cell number was the same in each sample. For quantification, GS signal was normalized to loading control Actin. Unpaired t test, t = 5.051, df = 4, p = 0.0072. (C, D, and F) Error bars indicate SEM.
Figure 3.
Figure 3.. Mice Lacking Oligodendrocyte GS Have Reduced Tissue Levels of GS Substrates but Normal Patterns of Myelination
(A) Immunostaining for ASPA and GS in the ventral midbrain of control (CTL) and conditional knockout (cKO) mice. Blue arrowheads indicate GS+ oligodendrocytes, and yellow arrowheads indicate GS− oligodendrocytes. (B) Box and whisker plots of GS and ASPA fluorescence within ASPA+ oligodendrocytes; whiskers represent minimum and maximum values. GS K-S D = 0.9871, p < 0.0001; n = 150−190 cells, 2 animals per group. ASPA K-S D = 0.09755, p = 0.438; n = 150 190 cells, 2 animals per group. (C) Western blot of GS and loading control Gapdh in the microdissected cortex or midbrain of control and cKO animals. (D) Quantification of GS protein relative to sample Gapdh. Cortex unpaired t = 1.073, df = 15, p = 0.3004; n = 8−9 animals per group. Midbrain unpaired t = 3.609, df = 14, p = 0.0028; n = 8 animals per group. (E) Quantification of GS metabolites in microdissected midbrains via colorimetric assays. One control and one cKO animal were processed in parallel per day; control and cKO values from the same day were paired for analysis. Glutamate paired t = 2.852, df = 4, p = 0.0463, n = 5 animals per group. Glutamine paired t = 5.037, df = 5, p = 0.004, n = 6 animals per group. NH3/NH4+ paired t = 2.075, df = 5, p = 0.0927, n = 6 animals per group. (F) Immunostaining for MBP in the cortex, ventral midbrain (VM), and spinal cord white matter (SCw) of control and cKO animals. (G) Western blot for MBP and loading control Actin in microdissected midbrain of control and cKO animals. Quantification of MBP protein relative to sample Gapdh, unpaired t = 0.2463, df = 11, p = 0.8100; n = 6[C0]7 animals per group. (H) TEM images of myelinated axons in spinal cord of control and cKO animals. (I) Histogram of axon diameter (feret) in control (673 axons) and cKO (671 axons) animals. (J) Scatterplot of axon diameter versus g-ratio (inner feret diameter/outer feret diameter). Linear regression control R2 = 0.1713, p < 0.0001; cKO R2 = 0.2448, p < 0.0001. (K) Axon diameter by animal, unpaired t = 0.1311, df = 4, p = 0.902; myelin thickness by animal, unpaired t = 0.7996, df = 4, p = 0.4688; g-ratio by animal, Welch-corrected t = 1.738, df = 2.029, p = 0.2225; n = 3 animals per group. (D, G, and K) Error bars indicate SEM.
Figure 4.
Figure 4.. Oligodendrocyte GS Deletion Disrupts Synaptic Glutamate Transmission in the Midbrain and Impairs Cocaine-Induced Locomotor Sensitization
(A) Example traces of mEPSCs. (B) Quantification of mEPSC frequency and cumulative probability plot of inter-event intervals of all mEPSC events. mEPSC frequency unpaired t = 1.605, df = 17, p = 0.1269; n = 8−11 cells, 4 animals per group. (C) Quantification and cumulative probability plot of amplitudes of all mEPSC events. mEPSC amplitude unpaired t = 2.682, df = 17, p = 0.0158; n = 8−11 cells, 4 animals per group. (D) Example traces and quantification of evoked EPSCs. Repeated-measures ANOVA (stimulus intensity 3 genotype), main effect of genotype F(1,41) = 4.705, p = 0.0359; main effect of stimulus intensity F(5,205) = 54.02, p < 0.0001; interaction F(5,205) = 5.636, p < 0.0001; n = 20−23 cells, 8−9 animals per group. *posthoc p < 0.05, **posthoc p < 0.01. (E) Example traces and quantification of evoked EPSCs. Repeated-measures ANOVA (stimulus intensity 3 treatment), main effect of treatment F(2,41) = 4.351, p = 0.0193; main effect of stimulus intensity F(5,205) = 46.11, p < 0.0001; interaction F(10,205) = 2.309, p = 0.0136; n = 11−20 cells, 4−8 animals per group. *posthoc Veh versus MSO p < 0.05, **posthoc Veh versus MSO p < 0.01, ***posthoc Veh versus MSO p < 0.001. *posthoc MSO versus MSO+Gln p < 0.05. (F) Quantification of evoked EPSC amplitude with vehicle and glutamine pre-incubation. Control repeated-measures ANOVA (stimulus intensity x treatment), main effect of treatment F(1,19) = 3.18, p = 0.0905; main effect of stimulus intensity F(4,76) = 26.18, p < 0.0001; interaction F(4,76) = 1.083, p = 0.371; n = 9−12 cells,4−6 animals per group. cKO repeated-measure ANOVA (stimulus intensity x treatment), main effect of treatment F(1,16) = 4.964, p = 0.0406; main effect of stimulus intensity F(4,64) = 18.94, p < 0.0001; interaction F(4,64) = 7.247, p < 0.0001; n = 8−10 cells, 3−4 animals per group. (G) Daily distance traveled during baseline hour. Repeated-measures ANOVA (day 3 genotype), main effect of day F(6,96) = 13.06, p < 0.0001; main effect of genotype F(1,16) = 2.784, p = 0.1147; interaction F(6,96) = 1.289, p = 0.2697; n = 8−10 animals per group. (H) Daily distance traveled following drug injection. Repeated-measures ANOVA (day 3 genotype), main effect of day F(6,96) = 9.992, p < 0.0001; main effect of genotype F(1,16) = 7.775, p = 0.0132; interaction F(6,96) = 2.109, p = 0.0591; n = 8−10 animals per group. **posthoc p < 0.01. (B–H) Error bars indicate SEM.

References

    1. Amaral AI (2013). Effects of hypoglycaemia on neuronal metabolism in the adult brain: role of alternative substrates to glucose. J. Inherit. Metab. Dis 36, 621–634. - PubMed
    1. Anlauf E, and Derouiche A (2013). Glutamine synthetase as an astrocytic marker: its cell type and vesicle localization. Front. Endocrinol 4, 144. - PMC - PubMed
    1. Armbruster M, Hanson E, and Dulla CG (2016). Glutamate Clearance Is Locally Modulated by Presynaptic Neuronal Activity in the Cerebral Cortex. J. Neurosci 36, 10404–10415. - PMC - PubMed
    1. Berg JM, Tymoczko JL, and Stryer L (2002). Gap Junctions Allow Ions and Small Molecules to Flow between Communicating Cells In Biochemistry, Fifth Edition (W.H. Freeman; ).
    1. Bernstein H-G, Bannier J, Meyer-Lotz G, Steiner J, Keilhoff G, Dobrowolny H, Walter M, and Bogerts B (2014). Distribution of immunoreactive glutamine synthetase in the adult human and mouse brain. Qualitative and quantitative observations with special emphasis on extra-astroglial protein localization. J. Chem. Neuroanat 61–62, 33–50. - PubMed

Publication types

LinkOut - more resources