. 2019 May 21;27(8):2493-2507.e4.
doi: 10.1016/j.celrep.2019.04.101.

The lncRNA SLNCR Recruits the Androgen Receptor to EGR1-Bound Genes in Melanoma and Inhibits Expression of Tumor Suppressor p21

Affiliations

The lncRNA SLNCR Recruits the Androgen Receptor to EGR1-Bound Genes in Melanoma and Inhibits Expression of Tumor Suppressor p21

Karyn Schmidt et al. Cell Rep. .

Abstract

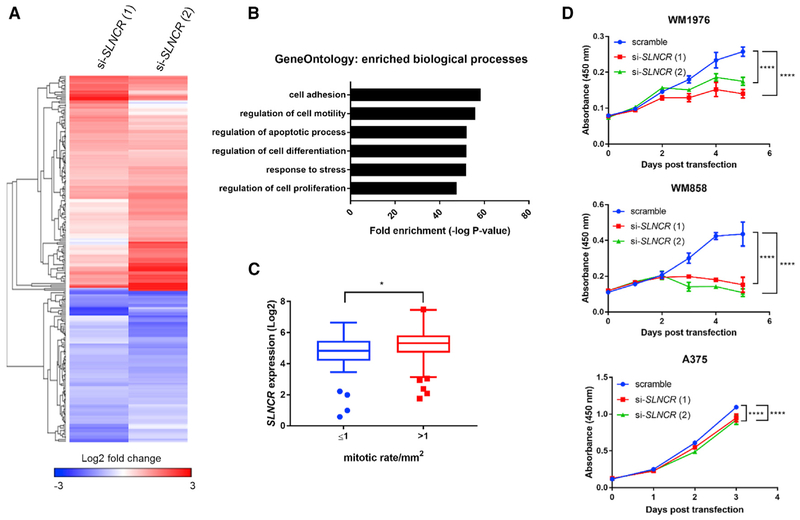
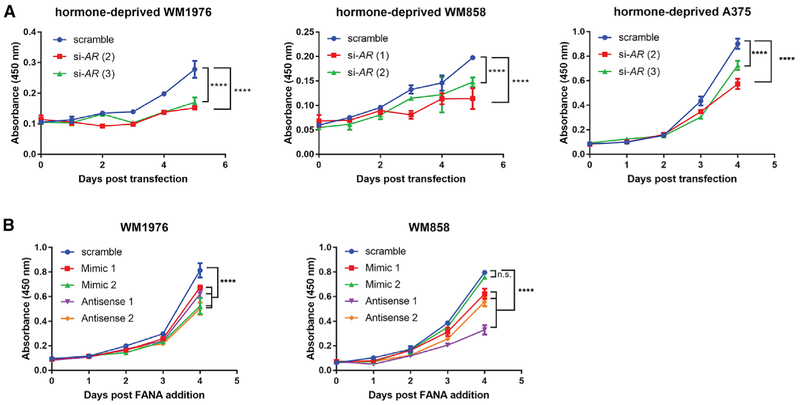
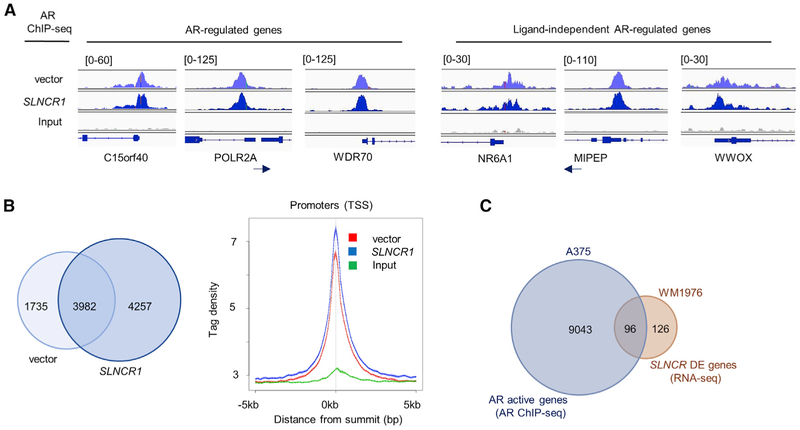
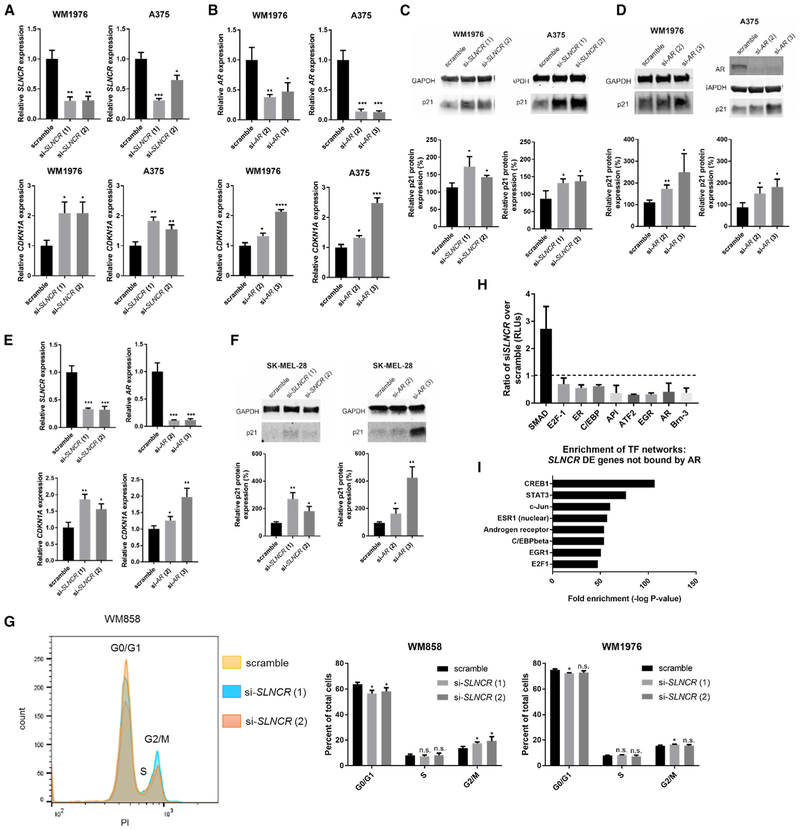
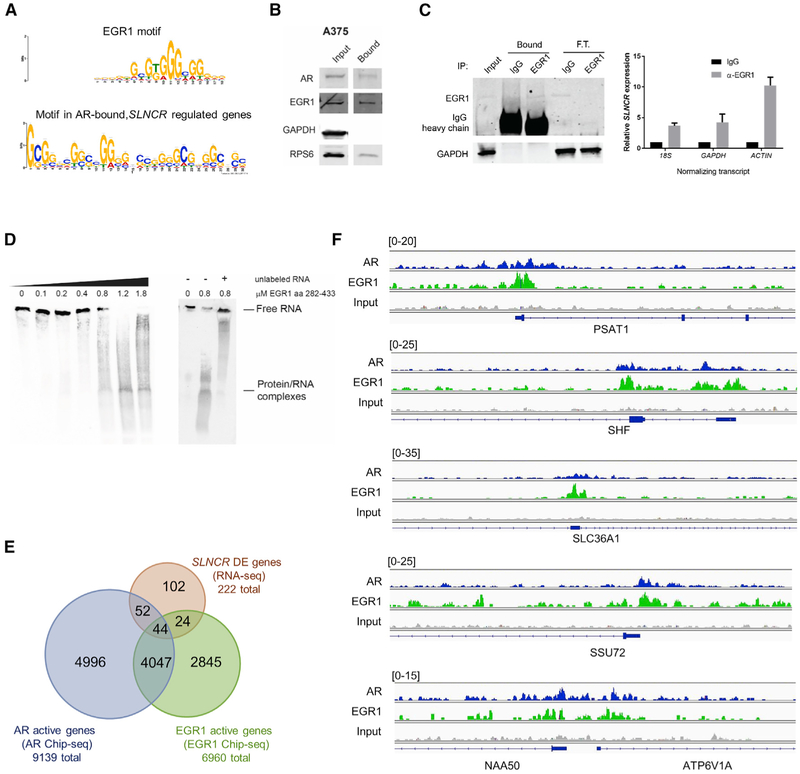
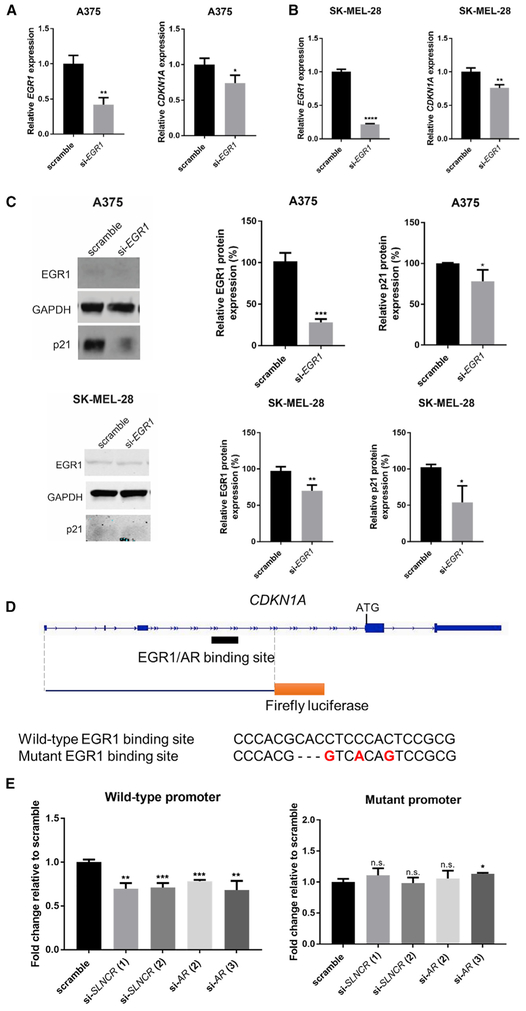
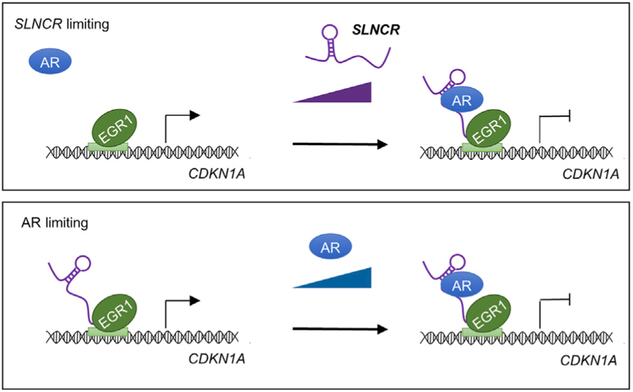
Melanoma is the deadliest form of skin cancer, affecting men more frequently and severely than women. Although recent studies suggest that differences in activity of the androgen receptor (AR) underlie the observed sex bias, little is known about AR activity in melanoma. Here we show that AR and EGR1 bind to the long non-coding RNA SLNCR and increase melanoma proliferation through coordinated transcriptional regulation of several growth-regulatory genes. ChIP-seq reveals that ligand-free AR is enriched on SLNCR-regulated melanoma genes and that AR genomic occupancy significantly overlaps with EGR1 at consensus EGR1 binding sites. We present a model in which SLNCR recruits AR to EGR1-bound genomic loci and switches EGR1-mediated transcriptional activation to repression of the tumor suppressor p21Waf1/Cip1. Our data implicate the regulatory triad of SLNCR, AR, and EGR1 in promoting oncogenesis and may help explain why men have a higher incidence of and more rapidly progressive melanomas compared with women.

Keywords: CDKN1A; EGR1; Waf1/Cip1; androgen receptor; linc00673; long non-coding RNA; melanoma; metastasis; p21; proliferation.


Conflict of interest statement

DECLARATION OF INTERESTS

K.S. and E.Y. are current employees of Alnylam Pharmaceuticals. J.C. is a current employee of the University of Toronto. D.D.T. is a current employee of Rubius Therapeutics. K.S. and C.N. are inventors of two patents based on work presented in this manuscript (PCT/US2016/041343 and PCT/US2018/050597).

Figures

Figure 1.
Figure 1.. SLNCR Regulates Melanoma Proliferation
(A) Heatmap of differentially expressed genes upon knockdown of SLNCR in MSTC WM1976. Shading represents the log2 fold change compared with the scramble siRNA control. Genes are clustered with Euclidean distance and average linkage clustering. (B) Gene Ontology (GO) biological process enriched in the differentially expressed genes represented in (A). (C) Tukey boxplots of SLNCR expression in TCGA melanomas (n = 172) exhibiting low(≤ 1)or high (>1) primary mitotic growth rates. Significance was calculated using a Mann-Whitney test: *p < 0.05. (D) The indicated MSTCs were seeded in 96-well plates and transfected with the indicated siRNAs, and cell proliferation was quantified at the indicated time points using WST-1 proliferation reagent. Each assay was repeated 2–3 times, and one representative assay is shown. Error bars represent the mean ± SD of 3 technical replicates. Significance was calculated using two-way ANOVA with Dunnett test for multiple comparisons testing. ****p < 0.0001. See also Figures S1 and S2.
Figure 2.
Figure 2.. SLNCR and AR Cooperatively Regulate Melanoma Proliferation in a Hormone-Independent Manner
The indicated cells were either transfected with the indicated siRNAs (A) or 2′-FANA-modified oligos were added to the cell medium (B) 24 h after cells were seeded in 96-well plates. Cell proliferation was quantified using WST-1 reagent, as in Figure 1D. Error bars represent the mean ± SD of 3 technical replicates. Significance was calculated using two-way ANOVA with Dunnett test for multiple comparisons testing. n.s., not significant; ****p < 0.0001. See also Figure S3.
Figure 3.
Figure 3.. AR Binds Many SLNCR-Regulated Genes
(A) Integrated Genome Viewer plots displaying AR ChIP-seq read intensities from vector control (light blue, top track), SLNCR1-expressing cells (dark blue, center track), or the input control (gray, bottom track) corresponding to the indicated genomic loci. Numbers on the top left indicate the plot height for the tracks. (B) Left panel: Venn diagram representing the numberof active genes (i.e., AR-bound genes) in A375 cells transfected with eitheran empty or SLNCR-expressing plasmid. Right panel: plot of tag densities for vector or SLNCR1-expressing cells. (C) Venn diagram representing AR active genes (as determined via AR ChIP-Seq of either vector or SLNCR-expressing cells), SLNCR differentially expressed genes (DEGs) (as determined via RNA-seq), and genes that are both AR-bound and SLNCR-regulated (significant enrichment, binomial test, p < 0.0001). See also Figure S4.
Figure 4.
Figure 4.. SLNCR and AR Inhibit Expression of CDKN1A/p21 Independent of p53
(A and B) Knockdown of SLNCR or AR increases CDKN1A levels. Shown is relative expression of the indicated transcripts 72 h post-transfection of the indicated cells with 10 nM of either scramble or SLNCR-targeting (A) or AR-targeting (B) siRNAs. qRT-PCR data are represented as the fold change compared with the scramble control, normalized to GAPDH. Error bars represent SD calculated from 3 reactions. (C and D) Knockdown of SLNCR (C) or AR (D) increases p21 protein levels. Protein levels were quantified using ImageJ and are presented as a fold change of p21 levels normalized to GAPDH levels. Bars represent mean ± SD from 3 independent biological replicates. (E) AR and SLNCR inhibit CDKN1A expression independent of p53. Shown is relative expression of the indicated transcripts 72 h post-transfection of the p53-deficient SK-MEL-28 melanoma cell line with 10 nM of either scramble or SLNCR- or AR-targeting siRNAs as in (A and B). (F) AR and SLNCR inhibit p21 expression independent of p53. The same as in (C) and (D), using the p53-deficient SK-MEL-28 melanoma cell line. Significance was calculated using Student’s t test: *p < 0.05, **p < 0.005, ***p < 0.0005. (G) SLNCR knockdown induces G2 cell cycle arrest. The cells were stained with propidium iodide (PI) 72 h post-transfection with the indicated siRNAs. Left panel: cell populations of one representative analysis. Right panels: cell populations were analyzed using FlowJo software, and significance was calculated using GraphPad Prism software. Bars represent the average percentage of total cells in the indicated stage of the cell cycle, and error bars represent SD from 3 independent replicates. Significance was calculated using a two-tailed Student’s t test via GraphPad Prism. *p < 0.05. See also Figures S1 and S2 (H) SLNCR regulates the activity of multiple transcription factors. Nuclear fractions were isolated from WM 1976 cells 72 h post-transfection with either scrambled or si-SLNCR (1) siRNA and entered directly in Signosis Transcription Factor Activation Array I. The ratio of relative luminescence units (RLUs) corresponds to the indicated transcription factor signals of si-SLNCR (1) versus the scramble control. Bars represent mean ± SD from 2 independent biological replicates. Shown are only transcription factors with significantly altered activity. (I) Transcription factor networks enriched among SLNCR-regulated genes that are not bound by AR. The analysis was performed using MetaCore (Thompson Reuters). See also Figure S5.
Figure 5.
Figure 5.. Co-binding of the SLNCR-Associated Transcription Factors EGR1 and AR Is Enriched on SLNCR-Regulated Genes
(A) TOMTOM analysis of AR ChIP-seq peaks found within 10,000 bp of SLNCR-regulated genes(as determined via RNA-seq) identified a significant enrichment of a motif (bottom) resembling the EGR1 DNA binding motif (top) (p = 2.24e—05). (B) EGR1 is significantly enriched in the SLNCR1 immunoprecipitate. Shown is western blot analysis of total A375 lysate (input) or immunoprecipitate enriched following incubation with in vitro-transcribed, biotinylated, full-length SLNCR1 (bound). AR and the S6 ribosomal protein serves as positive controls, whereas GAPDH served as a negative control. (C) RNA immunoprecipitations from A375 cells using α-EGR1 antibody or a matched immunoglobulin G (IgG) nonspecific control. Left panel: western blot analysis of input and either bound or flowthrough (F.T.) samples following immunoprecipitation with the indicated antibody. Right panel: relative enrichment of SLNCR measured via qRT-PCR compared with input after normalization to the indicated transcript. (D) EGR1 binds directly to SLNCR1. Shown is REMSA of in vitro-transcribed, biotinylated, full-length SLNCR1 following incubation with the indicated concentration of recombinant EGR1 corresponding to amino acids 282–433. Where indicated, 10 μM of unlabeled RNA competitor corresponding to full-length SLNCR1 was added prior to addition of biotinylated SLNCR1. (E) Venn diagram representing genes significantly differentially expressed upon SLNCR knockdown (SLNCR DEGs) in WM1976 cells (pink) and genes bound by either AR (blue) or EGR1 (green) within 10,000 bp of an annotated gene in A375 cells (Fisher’s exact test, p < 0.0001). (F)Integrated Genome Viewer plot displaying AR (blue) and EGR1 (green) ChIP-seq read intensities for the indicated transcripts. AR ChIP-seq reads are from a sample ectopically expressing SLNCR1. Numbers on the top left indicate the plot height for each track. See also Figure S6.
Figure 6.
Figure 6.. EGR1 Increases p21 Expression and Is Required for AR- and SLNCR-Mediated p21 Regulation
(A–C) Knockdown of EGR1 decreases CDKN1A levels independent of p53. (A and B) Relative expression of the indicated transcripts 72 h post-transfection in (A) A375 or (B) SK-MEL-28 cells with 10 nM of either scramble or EGR1-targeting siRNAs. qRT-PCR data are represented as the fold change compared with the scramble control, normalized to GAPDH. Error bars represent SD calculated from 3 reactions. (C) Left panel: representative western blot analysis of A375 (top) or SK-MEL-28 (bottom) cell lysates probed for EGR1, GAPDH, or p21 levels. Center and right panels: protein levels were quantified using ImageJ and are presented as relative expression of the indicated protein, normalized to GAPDH levels. Bars represent mean ± SD from 3 independent biological replicates. (D and E) Mutation of the EGR1 DNA binding site negates AR- and SLNCR-mediated CDKN1A regulation. (D) Schematic of the CDKN1A locus, highlighting the sequence incorporated into the firefly luciferase reporter. The EGR1/AR binding site is denoted, with the wild-type and mutant sequences shown below, with mutated bases shown in red. (E) A375 cells were transfected with the indicated siRNAs and, 24 h later, were subsequently transfected with the wild-type (top panel) or mutant (bottom panel) CDKN1A firefly (FL) reporter plasmid and a CMV-RL (cytomegalovirus-Renilla luciferase) control. Relative FL activity was calculated as a fold change compared with vector-only control cells after normalization to RL activity. Shown is one representative assay from four independent biological replicates. Error bars represent SD from four reactions within one biological replicate. Significance was calculated using Student’s t test: *p < 0.05, **p < 0.005, ***p < 0.0005. See also Figure S7.
Figure 7.
Figure 7.. Model of AR- and SLNCR-Mediated, EGR1-Dependent but p53-Independent Regulation of p21
In the absence of either SLNCR (top panel) or AR (bottom panel), EGR1 binds to its cognate DNA binding site in the CDKN1A promoter and increases expression. When SLNCR and AR levels exceed the required threshold, SLNCR recruits AR to EGR1-bound chromatin to repress gene expression. See also Figure S7 and Tables S4 and S5.

References

    1. Abbas T, and Dutta A (2009). p21 in cancer: intricate networks and multiple activities. Nat. Rev. Cancer 9, 400–414. - PMC - PubMed
    1. Ahmed MM, Venkatasubbarao K, Fruitwala SM, Muthukkumar S, Wood DP Jr., Sells SF, Mohiuddin M, and Rangnekar VM (1996). EGR-1 induction is required for maximal radiosensitivity in A375-C6 melanoma cells. J. Biol. Chem. 277, 29231–29237. - PubMed
    1. Alemu EA, Sjøttem E, Outzen H, Larsen KB, Holm T, Bjørkøy G, and Johansen T (2011). Transforming growth factor-β-inducible early response gene 1 is a novel substrate for atypical protein kinase Cs. Cell. Mol. Life Sci. 68, 1953–1968. - PMC - PubMed
    1. Alimirah F, Panchanathan R, Chen J, Zhang X, Ho SM, and Choubey D (2007). Expression of androgen receptor is negatively regulated by p53. Neoplasia 9, 1152–1159. - PMC - PubMed
    1. Arora S, Wang Y, Jia Z, Vardar-Sengul S, Munawar A, Doctor KS, Birrer M, McClelland M, Adamson E, and Mercola D (2008). Egr1 regulates the coordinated expression of numerous EGF receptor target genes as identified by ChIP-on-chip. Genome Biol. 9, R166. - PMC - PubMed

Publication types

MeSH terms