. 2019 May 21;20(10):2500.
doi: 10.3390/ijms20102500.

Mechanism of CK2.3, a Novel Mimetic Peptide of Bone Morphogenetic Protein Receptor Type IA, Mediated Osteogenesis

Affiliations

Mechanism of CK2.3, a Novel Mimetic Peptide of Bone Morphogenetic Protein Receptor Type IA, Mediated Osteogenesis

Vrathasha Vrathasha et al. Int J Mol Sci. .

Abstract

Background: Osteoporosis is a degenerative skeletal disease with a limited number of treatment options. CK2.3, a novel peptide, may be a potential therapeutic. It induces osteogenesis and bone formation in vitro and in vivo by acting downstream of BMPRIA through releasing CK2 from the receptor. However, the detailed signaling pathways, the time frame of signaling, and genes activated remain largely unknown.

Methods: Using a newly developed fluorescent CK2.3 analog, specific inhibitors for the BMP signaling pathways, Western blot, and RT-qPCR, we determined the mechanism of CK2.3 in C2C12 cells. We then confirmed the results in primary BMSCs.

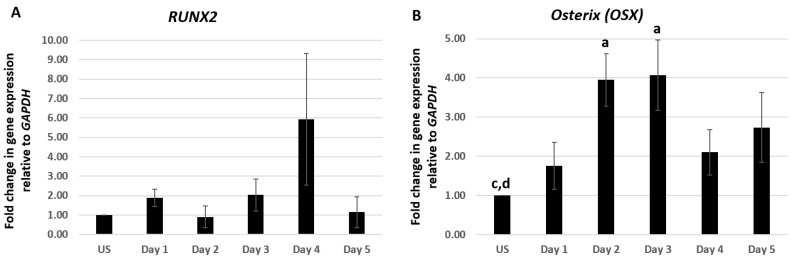
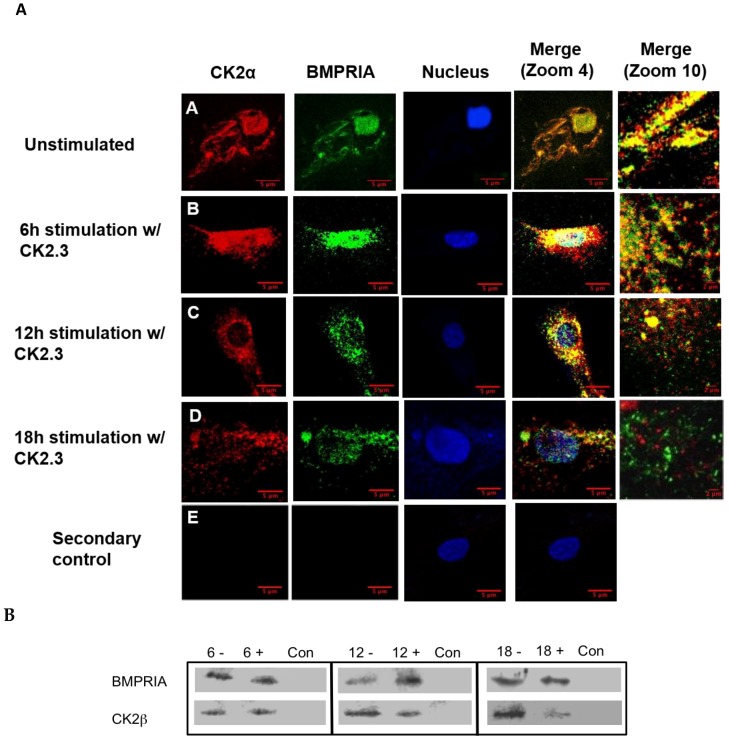
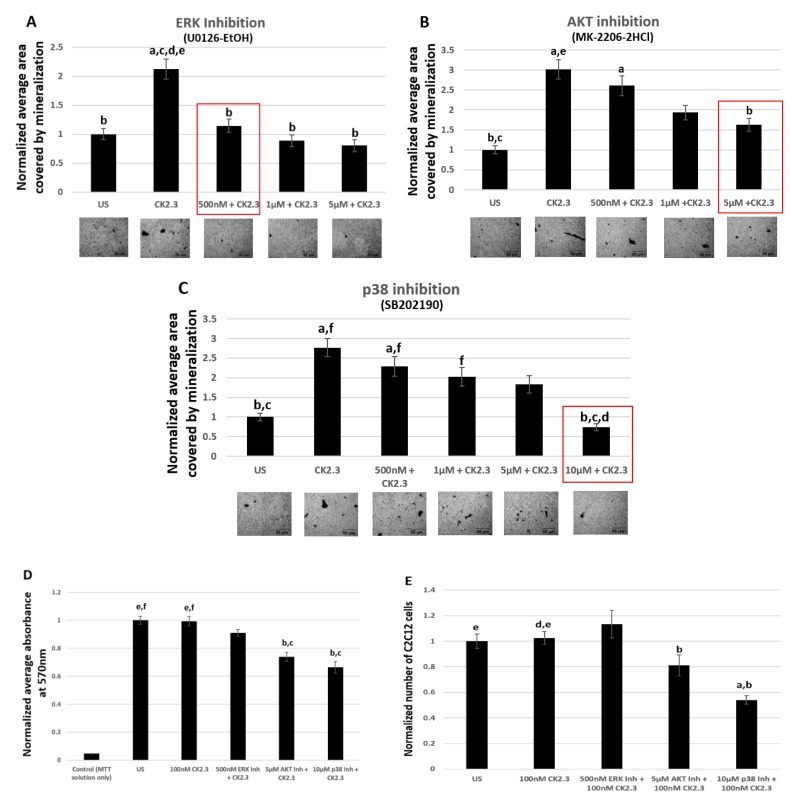
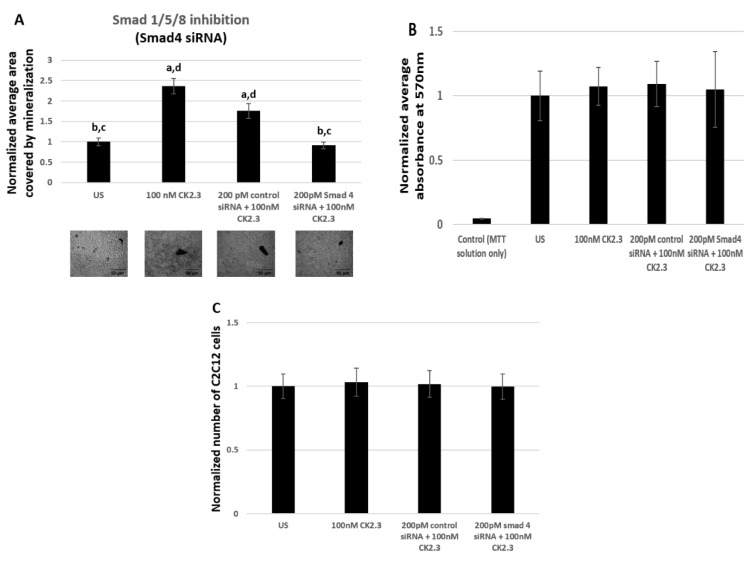
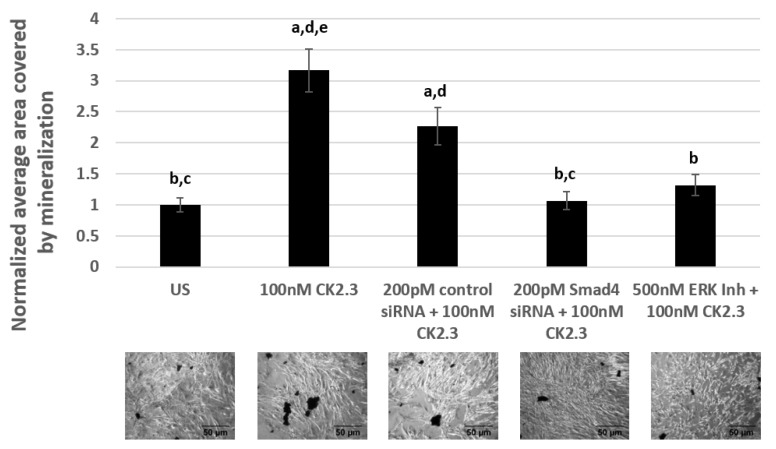
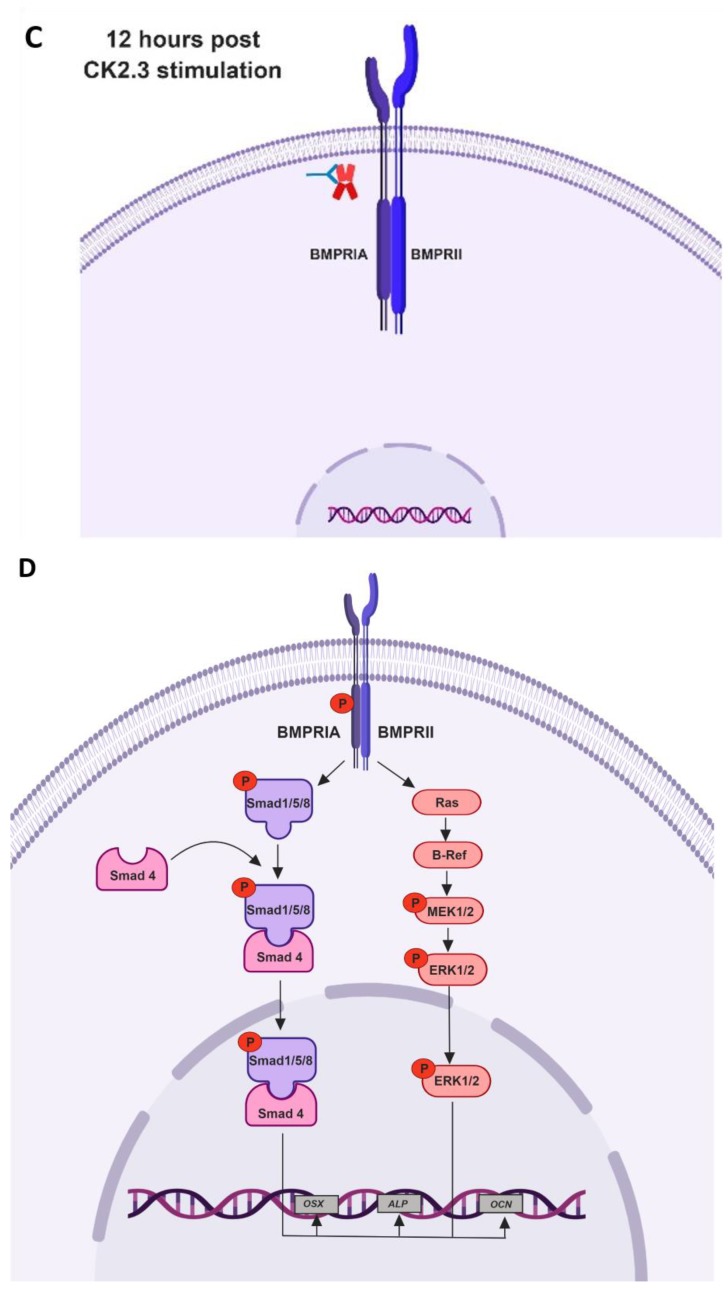
Results: Using these methods, we showed that CK2.3 stimulation activated OSX, ALP, and OCN. CK2.3 stimulation induced time dependent release of CK2β from BMPRIA and concurrently CK2.3 colocalized with CK2α. Furthermore, CK2.3 induced BMP signaling depends on ERK1/2 and Smad1/5/8 signaling pathways.

Conclusion: CK2.3 is a novel peptide that drives osteogenesis, and we detailed the molecular sequence of events that are triggered from the stimulation of CK2.3 until the induction of mineralization. This knowledge can be applied in the development of future therapeutics for osteoporosis.

Keywords: BMP2; CK2; CK2.3; RT-qPCR; bone; osteogenesis; osteogenic signal transduction; osteoporosis; western blots.


Conflict of interest statement

The authors declare no conflict of interest.

Figures

Figure 1
Figure 1
CK2.3 stimulation led to the upregulation of Osterix, Alkaline Phosphatase, and Osteocalcin genes in C2C12 cells. C2C12 cells were treated with 100 nM of CK2.3 and expression of (A) RUNX2, (B) OSX, (C) ALP, and (D) OCN were analyzed using RT-qPCR over the course of 5 days. GAPDH was used as the house-keeping gene. Data (n = 4) was normalized to unstimulated cells and analyzed using one-way anova and Tukey-Kramer post hoc statistical test (p < 0.05). a = statistically significant difference to unstimulated, b = statistically significant difference to Day 1, c = statistically significant difference to Day 2, d = statistically significant difference to Day 3, e = statistically significant difference to Day 4, and f = statistically significant difference to Day 5.
Figure 1
Figure 1
CK2.3 stimulation led to the upregulation of Osterix, Alkaline Phosphatase, and Osteocalcin genes in C2C12 cells. C2C12 cells were treated with 100 nM of CK2.3 and expression of (A) RUNX2, (B) OSX, (C) ALP, and (D) OCN were analyzed using RT-qPCR over the course of 5 days. GAPDH was used as the house-keeping gene. Data (n = 4) was normalized to unstimulated cells and analyzed using one-way anova and Tukey-Kramer post hoc statistical test (p < 0.05). a = statistically significant difference to unstimulated, b = statistically significant difference to Day 1, c = statistically significant difference to Day 2, d = statistically significant difference to Day 3, e = statistically significant difference to Day 4, and f = statistically significant difference to Day 5.
Figure 2
Figure 2
Time-dependent release of CK2 from BMPRIA at 12 h and 18 h post CK2.3 stimulation. (A) Visual analysis of the effect of CK2.3 on the interaction between endogenous BMPRIA and CK2α. Confocal images of fixed C2C12 cells that were either (A) unstimulated (-) or stimulated with 100 nM of CK2.3 (+) for (B) 6 h, (C) 12 h, and (D) 18 h. The images depict the interaction between endogenous BMPRIA (green) and CK2α (red) within the cell at different time intervals. The nucleus of the cells is depicted in blue. (E) In the secondary control, unstimulated cells were stained using only the fluorescent secondary antibody to determine their specificity, and lack of staining in the cells shows that the antibody was specific against the antigen. (B) Immuno-precipitation of BMPRIA in C2C12 cells, not stimulated (-) or stimulated (+) with 100 nM of CK2.3 for 6 h, 12 h, and 18 h; followed by a co-immuno-precipitation for CK2β that showed reduced interaction of CK2β with BMPRIA at 12 h and 18 h post-stimulation. Con represents the negative control of the immuno-precipitation, where lysis buffer was used instead of cell lysate.
Figure 3
Figure 3
Time-dependent co-localization of CK2 with CK2.3-Qdot®s at 6 h, 12 h, and 18 h post stimulation. C2C12 cells were either (A) unstimulated or stimulated with 100 nM of CK2.3-Qdot®s for (B) 6 h, (C) 12 h, and (D) 18 h. Cells were fixed, stained for CK2α and nucleus of the cell after each respective time points, and images were taken using the LSM 710 confocal microscopy. The images depict the interaction between endogenous CK2α (red) and CK2.3-Qdot®s (green) within the cell at different time intervals. The nuclei of the cells are depicted in blue. (E) In secondary control, unstimulated cells were stained using only the fluorescent secondary antibody to determine their specificity, and lack of staining in the cells implies that the antibody is specific against the antigen. (F) In Qdot®s control, cells were treated with Qdot®s fraction and lack of Qdot®s signal in the cells indicate that the interaction between CK2α and CK2.3-Qdot®s is driven by CK2.3.
Figure 4
Figure 4
Smad1/5/8, ERK1/2, and Akt1/2/3 signaling pathways are upregulated following stimulation with 100 nM of CK2.3 in C2C12 cells. C2C12 cells were either left unstimulated or stimulated with 100 nM of CK2.3 for 6 h, 12 h, and 18 h over days 1–5 and, after each respective time points, protein was extracted, normalized, and analyzed using SDS-PAGE, followed by Western blot. (A) p-Smad1/5/8 and total Smad1/5/8 expression gradually increased with CK2.3 treatment. (B) p-ERK expression was elevated and total ERK1/2 expression gradually increased through the 5-day experiment. Similarly, (C) p-Akt1/2/3 expression increased with CK2.3 treatment, however, (D) p38 MAPK expression stayed relatively constant. β-actin was used as the loading control. An absolute timing of the CK2.3 response was variable over the 5-day experiment. Thus, we did not include a quantitative representation of the Western blots.
Figure 5
Figure 5
500 nM of ERK1/2 inhibitor (U0126-EtOH) induces significant reduction in mineralization without affecting the viability of C2C12 cells. Mineralization levels in unstimulated C2C12 cells and cells treated with (A) 500 nM, 1 μM, and 5 μM of U0126-EtOH (ERK 1/2 inhibitor), (B) 500 nM, 1 μM, and 5 μM of MK-2206-2HCl (Akt inhibitor) and (C) 500 nM, 1 μM, 5 μM, and 10 μM of SB202190 (p38 inhibitor); followed by stimulation with 100 nM of CK2.3 was determined using von Kossa assay. (D) Viability of cells and (E) total number of cells after treatment with 500 nM of U0126-EtOH, 5 μM of MK-2206-2HCl, and 10 μM of SB202190 followed by stimulation with 100 nM of CK2.3 was determined using MTT assay and ImageJ analysis, respectively. Data (n = 3) was normalized to unstimulated cells and analyzed using one-way anova and Tukey-Kramer post hoc statistical test (p < 0.05). (A) a = statistically significant difference to unstimulated, b = statistically significant difference to 100 nM CK2.3, c = statistically significant difference to 500 nM ERK1/2 Inh + 100 nM CK2.3, d = statistically significant difference to 1 μM ERK1/2 Inh + 100 nM CK2.3, and e = statistically significant difference to 5 μM ERK1/2 Inh + 100 nM CK2.3. (B) a = statistically significant difference to unstimulated, b = statistically significant difference to 100 nM CK2.3, c = statistically significant difference to 500 nM Akt Inh + 100 nM CK2.3, d = statistically significant difference to 1 μM Akt Inh + 100 nM CK2.3, and e = statistically significant difference to 5 μM Akt Inh + 100 nM CK2.3. (C) a = statistically significant difference to unstimulated, b = statistically significant difference to 100 nM CK2.3, c = statistically significant difference to 500 nM p38 Inh + 100 nM CK2.3, d = statistically significant difference to 1 μM p38 Inh + 100 nM CK2.3, e = statistically significant difference to 5 μM p38 Inh + 100 nM CK2.3, and f = statistically significant difference to 10 μM p38 Inh + 100 nM CK2.3. (D) a = statistically significant difference to control, b = statistically significant difference to unstimulated, c = statistically significant difference to 100 nM CK2.3, d = statistically significant difference to 500 nM ERK1/2 Inh + 100 nM CK2.3, e = statistically significant difference to 5 μM Akt Inh + 100 nM CK2.3, and f = statistically significant difference to 10 μM p38 Inh + 100 nM CK2.3. (E): a = statistically significant difference to unstimulated, b = statistically significant difference to 100 nM CK2.3, c = statistically significant difference to 500 nM ERK1/2 Inh + 100 nM CK2.3, d = statistically significant difference to 5 μM Akt Inh + 100 nM CK2.3, and d = statistically significant difference to 10 μM p38 Inh + 100 nM CK2.3.
Figure 6
Figure 6
200 pM of Smad4 siRNA induces significant reduction in mineralization without affecting the viability of C2C12 cells. (A) Mineralization levels in unstimulated C2C12 cells and cells treated with 200 pM of control siRNA and 200 pM of Smad4 siRNA, followed by stimulation with 100 nM of CK2.3, was determined using von Kossa assay. (B) Viability of cells and (C) total number of cells after treatment with 200 pM of control siRNA and 200 pM of Smad4 siRNA followed by stimulation with 100 nM of CK2.3 was determined using MTT assay and imageJ software, respectively. Data (n = 3) was normalized to unstimulated cells and analyzed using one-way anova and Tukey-Kramer post hoc statistical test (p < 0.05). (A) and (C) a = statistically significant difference to unstimulated, b = statistically significant difference to 100 nM CK2.3, c = statistically significant difference to 200 pM control siRNA + 100 nM CK2.3, and d = statistically significant difference to 200 pM Smad4 siRNA + 100 nM CK2.3. (B) a = statistically significant difference to control, b= statistically significant difference to unstimulated, c = statistically significant difference to 100 nM CK2.3, d = statistically significant difference to 200 pM control siRNA + 100 nM CK2.3, and e = statistically significant difference to 200 pM Smad4 siRNA + 100 nM CK2.3.
Figure 7
Figure 7
CK2.3 mediates osteogenesis via Smad1/5/8 and ERK1/2 signaling pathways in primary BMSCs isolated from 4-month-old female C57BL/6J mice. Primary BMSCs were either left unstimulated or stimulated with 200 pM of control siRNA, 200 pM of Smad4 siRNA, and 500 nM of U0126-EtOH (ERK1/2 inhibitor) for 24 h, followed by stimulation with 100 nM of CK2.3. Treatment of cells with signaling inhibitor/siRNAs, followed by CK2.3 stimulation, was repeated for a total of two times over the course of a 6-day experiment. Later, the cells were fixed and stained for calcium deposits using von Kossa assay. Data (n = 4) was normalized to unstimulated cells and analyzed using one-way anova and Tukey-Kramer post hoc statistical test (p < 0.05). a = statistically significant difference to unstimulated, b = statistically significant difference to 100 nM CK2.3, c = statistically significant difference to 200 pM control siRNA + 100 nM CK2.3, d = statistically significant difference to 200 pM Smad4 siRNA + 100 nM CK2.3, and e = statistically significant difference to 500 nM ERK1/2 Inh + 100 nM CK2.3.
Figure 8
Figure 8
Proposed mechanism of CK2.3 mediated osteogenesis. (A) In unstimulated cells, protein kinase CK2 is hypothesized to be interacting with the receptor BMPRIA. (B) Stimulation of cells with CK2.3 results in its internalization starting at 6 h via caveolae-mediated endocytosis. (C) CK2.3 then interacts with endogenous CK2, causing its release from receptor BMPRIA. (D) Thereby activating BMPRIA downstream signaling pathways and genes.
Figure 8
Figure 8
Proposed mechanism of CK2.3 mediated osteogenesis. (A) In unstimulated cells, protein kinase CK2 is hypothesized to be interacting with the receptor BMPRIA. (B) Stimulation of cells with CK2.3 results in its internalization starting at 6 h via caveolae-mediated endocytosis. (C) CK2.3 then interacts with endogenous CK2, causing its release from receptor BMPRIA. (D) Thereby activating BMPRIA downstream signaling pathways and genes.

References

    1. Cauley J.A. Public Health Impact of Osteoporosis. J. Gerontol. Ser. A. 2013;68:1243–1251. doi: 10.1093/gerona/glt093. - DOI - PMC - PubMed
    1. Cosman F., de Beur S.J., LeBoff M.S., Lewiecki E.M., Tanner B., Randall S., Lindsay R. Clinician’s Guide to Prevention and Treatment of Osteoporosis. Osteoporos. Int. 2014;25:2359–2381. doi: 10.1007/s00198-014-2794-2. - DOI - PMC - PubMed
    1. Hadjidakis D.J., Androulakis I.I. Bone remodeling. Ann. N. Y. Acad. Sci. 2006;1092:385–396. doi: 10.1196/annals.1365.035. - DOI - PubMed
    1. Raisz L.G. Pathogenesis of osteoporosis: Concepts, conflicts, and prospects. J. Clin. Investig. 2005;115:3318–3325. doi: 10.1172/JCI27071. - DOI - PMC - PubMed
    1. Raisz L.G. Physiology and pathophysiology of bone remodeling. Clin. Chem. 1999;45:1353–1358. - PubMed

Substances

LinkOut - more resources