. 2019 Jun 5;141(22):9004-9017.
doi: 10.1021/jacs.9b03116. Epub 2019 May 23.

Remarkable Rigidity of the Single α-Helical Domain of Myosin-VI As Revealed by NMR Spectroscopy

Remarkable Rigidity of the Single α-Helical Domain of Myosin-VI As Revealed by NMR Spectroscopy

C Ashley Barnes et al. J Am Chem Soc. .

Abstract

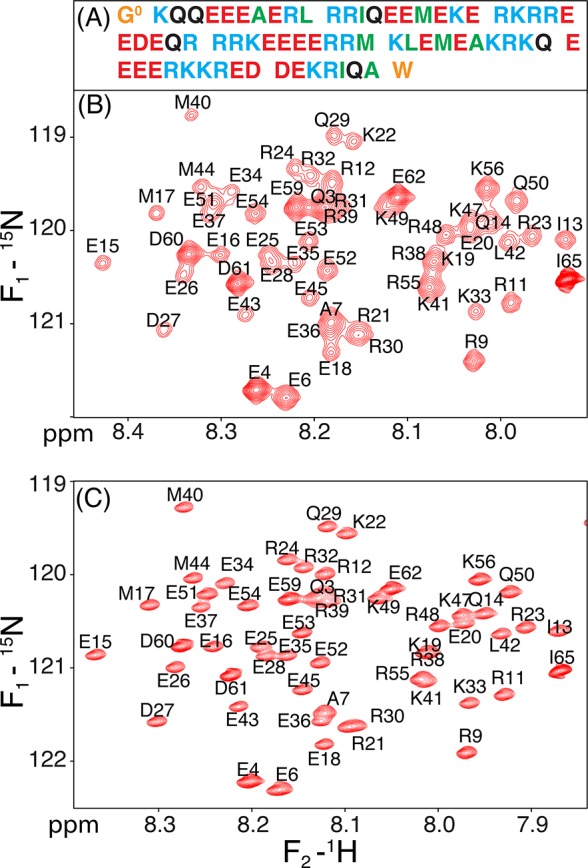
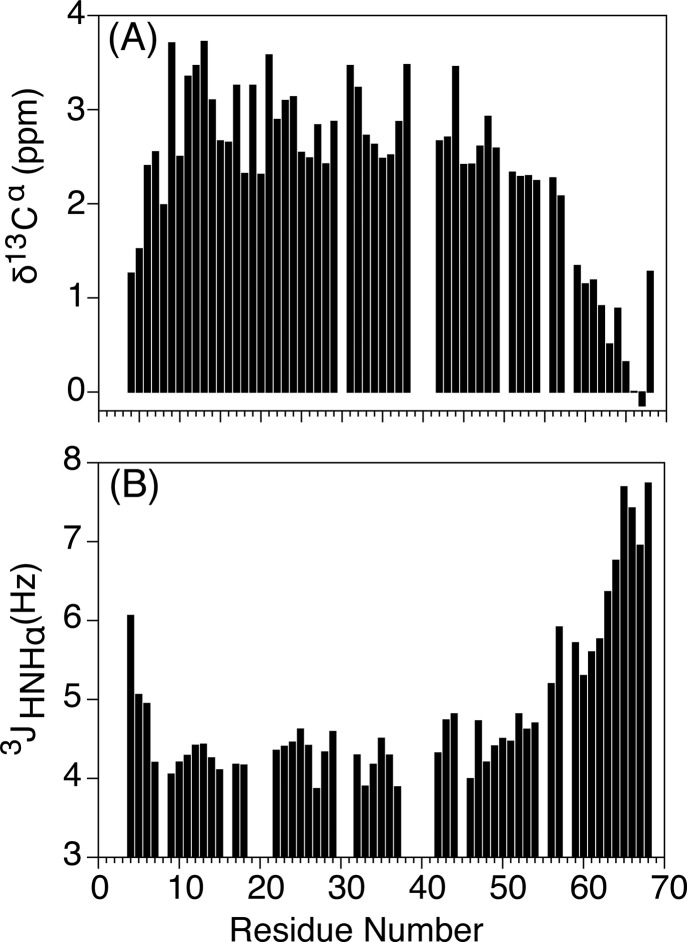
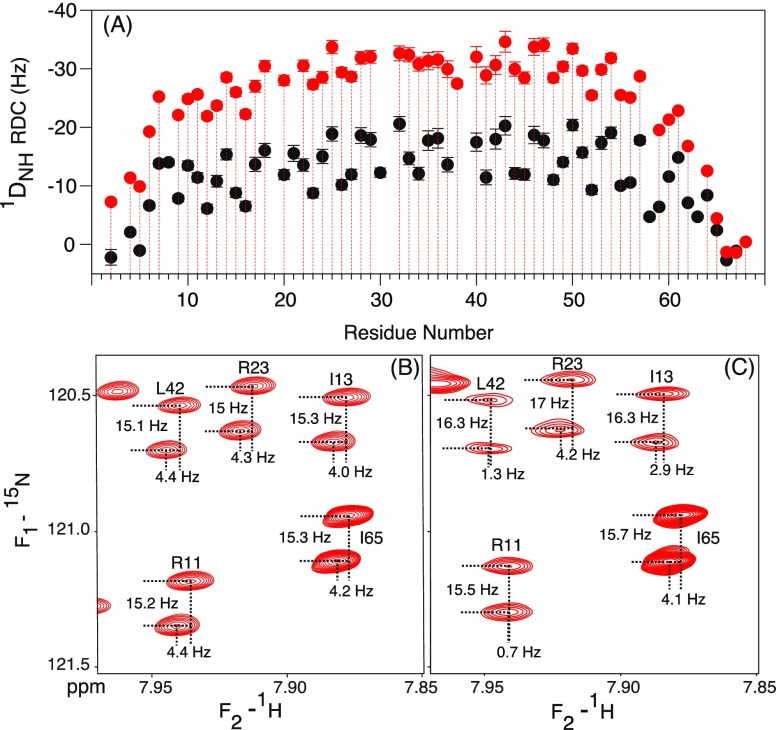
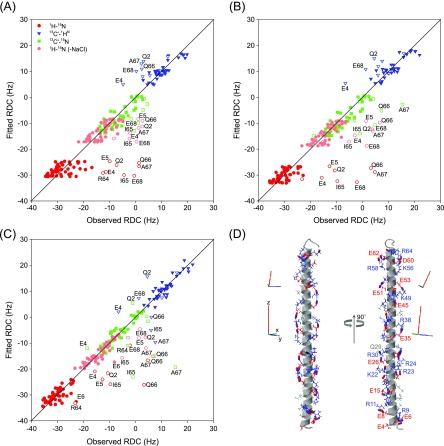
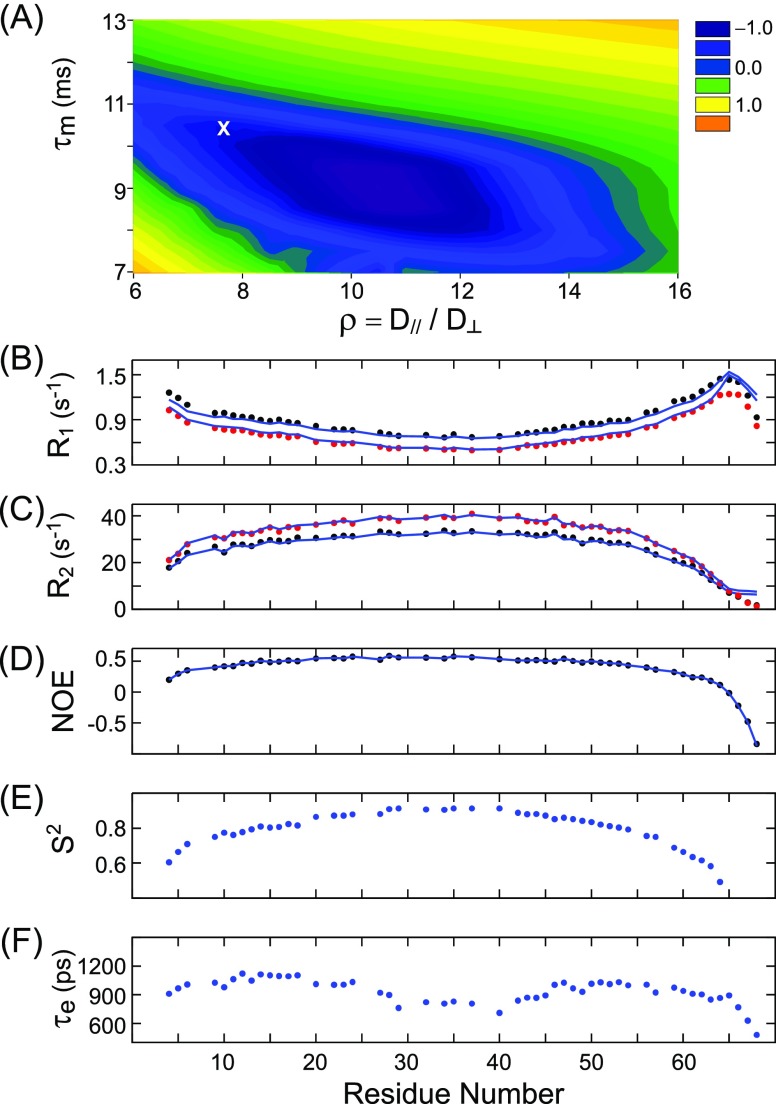
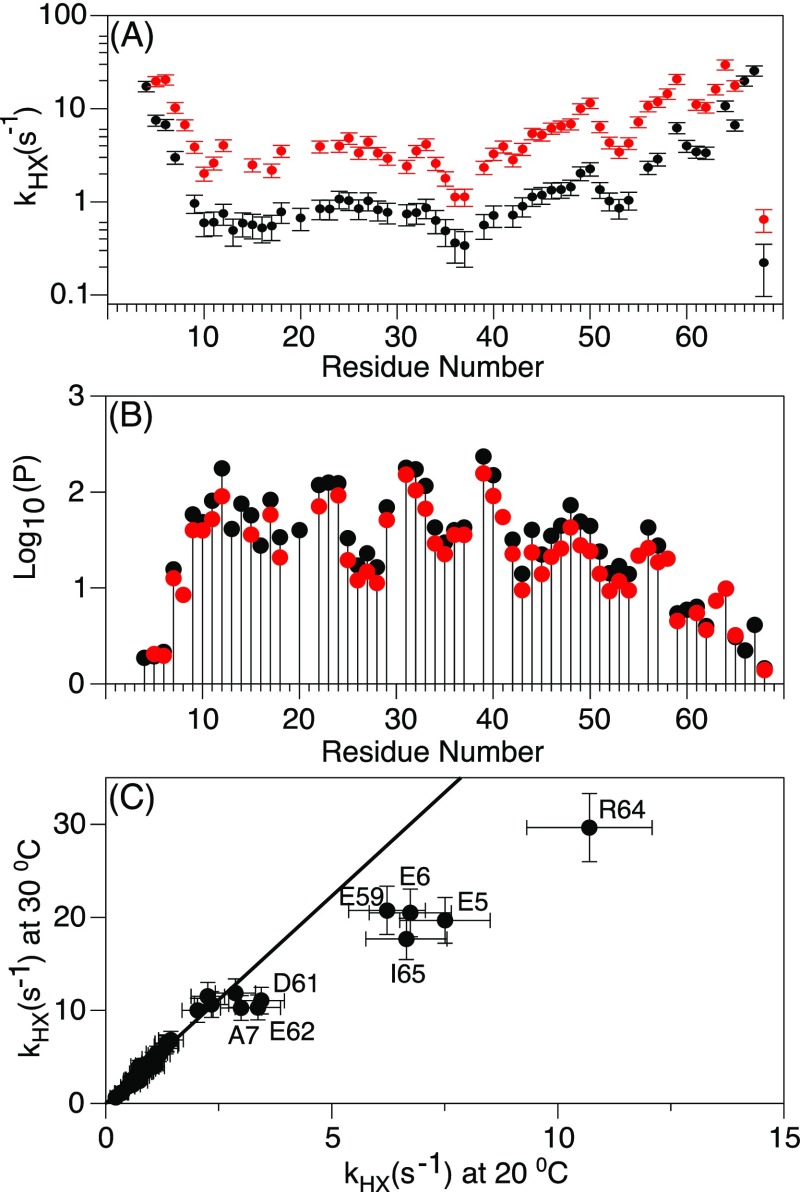
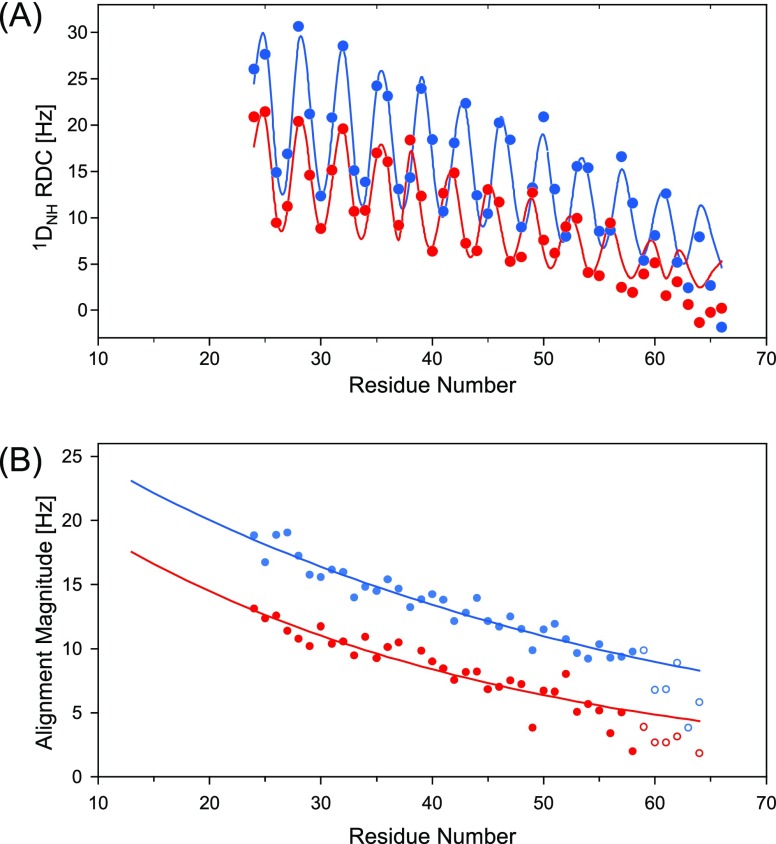
Although the α-helix has long been recognized as an all-important element of secondary structure, it generally requires stabilization by tertiary interactions with other parts of a protein's structure. Highly charged single α-helical (SAH) domains, consisting of a high percentage (>75%) of Arg, Lys, and Glu residues, are exceptions to this rule but have been difficult to characterize structurally. Our study focuses on the 68-residue medial tail domain of myosin-VI, which is found to contain a highly ordered α-helical structure extending from Glu-6 to Lys-63. High hydrogen exchange protection factors (15-150), small (ca. 4 Hz) 3 JHNHα couplings, and a near-perfect fit to an ideal model α-helix for its residual dipolar couplings (RDCs), measured in a filamentous phage medium, support the high regularity of this helix. Remarkably, the hydrogen exchange rates are far more homogeneous than the protection factors derived from them, suggesting that for these transiently broken helices the intrinsic exchange rates derived from the amino acid sequence are not appropriate reference values. 15N relaxation data indicate a very high degree of rotational diffusion anisotropy ( D/ D ≈ 7.6), consistent with the hydrodynamic behavior predicted for such a long, nearly straight α-helix. Alignment of the helix by a paramagnetic lanthanide ion attached to its N-terminal region shows a decrease in alignment as the distance from the tagging site increases. This decrease yields a precise measure for the persistence length of 224 ± 10 Å at 20 °C, supporting the idea that the role of the SAH helix is to act as an extension of the myosin-VI lever arm.


Conflict of interest statement

The authors declare no competing financial interest.

Figures

Figure 1
Figure 1
NMR spectra of myosin-VI E68W MT domain. (A) Sequence of the construct used, with residue types color coded as follows: Arg and Lys in blue; Glu and Asp in red; polar, neutral Gln in black; hydrophobic Ala, Leu, Ile and Met in green; and non-native N- and C-terminal residues in orange. (B) Most crowded region of the regular Rance-Kay HSQC spectrum of perdeuterated, amide-protonated 15N-enriched MT, recorded at 900 MHz 1H frequency, 20 °C, pH 6.3, 2 mM EDTA, yielding broad resonances. (C) TROSY-HSQC spectrum, recorded under identical conditions.
Figure 2
Figure 2
Depiction of the residue assignment protocol for the MT domain using a 4D amide–amide HMQC-NOESY-TROSY-HSQC spectrum (900 MHz; 250 ms NOE mixing time; 20 °C), recorded with nonuniform (0.49% sparsity) sampling. (A) Projection of the 4D spectrum on the (F3, F4) TROSY-HSQC plane. The chemical shift scales have been adjusted to make them consistent with the HSQC cross sections by adjustment for the 1JNH/2 displacement of cross peak positions in TROSY-HSQC spectra. (B,C) Two-dimensional (F1, F2) cross sections, orthogonal to the (F3, F4) planes, at the chemical shift positions of the amide resonances of (B) E34, marked by the red cross hairs, and (C) E35, marked by the blue cross hairs. Cross peaks to i ± 1 and i ± 2 are marked by residue type and number. E34 in (B) also displays a weak cross peak with i – 3 residue R31.
Figure 3
Figure 3
Residue-specific NMR parameters reporting on secondary structure of MT. (A) 13Cα secondary chemical shifts. Secondary chemical shifts are relative to the Poulsen random coil values, corrected for the effect of deuteration. (B) 3JHNHα couplings measured at 35 °C. Values were measured at 900 MHz 1H frequency using the ARTSY-J experiment, and corrected for the effect of R1(Hα). The secondary chemical shifts and 3JHNHα were measured at 35 °C, for a construct that includes E68.
Figure 4
Figure 4
Measurement of RDCs at 900 MHz, 20 °C. (A) 1DNH values measured in the presence of 13 mg/mL Pf1 in 20 mM sodium phosphate, 2 mM EDTA, pH 6.3 (black), and upon addition of 100 mM NaCl (red) on a 1 mM sample of perdeuterated 15N/13C enriched MT. Plotted values ignore the negative sign of γ(15N); i.e., the plotted negative values correspond to |1JNH + 1DNH| splittings smaller than 90 Hz. (B,C) Small regions of the TROSY-HSQC-E.COSY spectra on (B) the isotropic and (C) the aligned sample, illustrating the measurement of 1DNC′ and 2DC′H couplings in the sample containing 100 mM NaCl. RDCs are listed in Table S2.
Figure 5
Figure 5
Results of SVD fits of experimental RDCs to an idealized α-helical structure with backbone torsion angles of φ = −62.5°, ψ = −42.5°, ω = 180°. Only the RDCs for residues E6–R63 were used to carry out the fit, but the correlation is shown for all observed couplings. 1DNC′ and 2DC′H were upscaled by multiplication with the inverse of the respective dipolar interaction constants (2609 and 6962 Hz) relative to 1DNH (21 585 Hz), ignoring the effect of the sign of the 15N gyromagnetic ratio on the RDC, thereby ensuring that normalized RDCs of the same value correspond to the same orientational restraint. Thus, the uniformly negative values of 1DNH in the plot correspond to |1JNH + 1DNH| < 92 Hz. RDCs were measured in the presence of 13 mg/mL Pf1, 100 mM NaCl, except for the light red 1DNH values (no NaCl). (A) SVD fit of the RDCs (scaled for the interaction constants). (B) SVD fit of the RDCs after correction for the variation in 15N R2 value, as discussed in the text, to (B) the idealized α-helical structure and (C) the XPLOR-NIH structure, refined with the R2-corrected RDCs. (D) Two orthogonal views of the refined structure, with the backbone displayed as a ribbon diagram, and the corresponding alignment frames depicted next to them (top, no NaCl; bottom, with 100 mM NaCl); side chains are shown in full atom representation, but are restrained solely by the empirical force field terms (tDB and eefxpot) in the XPLOR-NIH structure calculation. Glu and Asp are in red; Lys and Arg in blue; and gray for all other residues. Salt bridges and H-bonds between the side chains are drawn as thick lines.
Figure 6
Figure 6
Analysis of MT backbone dynamics from 15N relaxation data using the Modelfree4 program. (A) Grid search over the mean rotational correlation time τm and the diffusion anisotropy ρ = D/D for the minimum normalized χ2 = {Σn=28,...,42[(R1,n800,obsR1,n800,fit)]212 + (R1,n600,obsR1,n600,fit)212 + (R2,n800,obsR2,n800,fit)222 + (R2,n600,obsR2,n600,fit)222 + (NOEn600,obs – NOEn600,fit)232 + (R1,C600,obsR1,C600,fit)242 + (R2,C600,obsR2,C600,fit)252 + (NOEC600,obs – NOEC600,fit)262}/N function when fitting the relaxation rates of residues n = 28–42 to the simple modelfree formalism with axially symmetric overall diffusion, using the coordinates of the RDC-refined MT domain. R1,n, R2,n, and NOEn refer to the longitudinal and transverse 15N relaxation rates of residue n, and its 15N{1H} NOE, whereas R1,C, R2,C, and NOEC are the corresponding average rates measured for the overlapping group of E/R/K/Q residues in Figure S5 and include the entire helix. N corresponds to the total number of fitted experimental constraints, and the colors correspond to log(χ2). Uncertainties in the experimental R1 rates (ε1) and R2 rates (ε2) were estimated to be 3% of their measured values; the error in the NOE was ε1 = 0.03 based on the signal-to-noise in the acquired spectra, and 13C errors were estimated at ε4 = 0.03 s–1, ε5 = 1 s–1, and ε6 = 0.01. The blue region of the plot marks the range of τm and ρ where the data can be fit to within their experimental uncertainty (log(χ2) ≤ 0). (B–D) Agreement between experimental (B) R1, (C) R2, and (D) 15N{1H} NOE data (black symbols, 600 MHz; red symbols, 800 MHz) and corresponding values predicted by Modelfree (solid blue lines) when using τm = 10.3 ns; ρ = 7.6 (position X in panel A), and the fitted residue-specific order parameters S2 (E) and internal correlation times τe (F) obtained by Modelfree4.
Figure 7
Figure 7
Backbone amide hydrogen exchange of the MT domain in 20 mM sodium phosphate, 2 mM EDTA, pH 7.8. (A) HX rates as a function of residue number at 20 °C (black) and 30 °C (red). (B) HX rates converted to protection factors, P, by dividing them by the corresponding intrinsic exchange rate number at 20 °C (black) and 30 °C (red). (C) Correlation graph between the hydrogen exchange rates at 20 and 30 °C. The slope of the correlation, when excluding the outlying, labeled terminal residues, is 4.5. For amides that are not H-bonded, the expected slope is 2.5.
Figure 8
Figure 8
Analysis of 1DNH RDCs, collected at 900 MHz for I13C MT, aligned by the DOTA-M8-Tm tag, attached to Cys-13. (A) RDCs collected at 20 (blue) and 35 °C (red). Amides of residues Q3–R23 could not be observed due to paramagnetic broadening. The superimposed sinusoids correspond to the dipolar wave pattern expected for an idealized α-helix, multiplied by a decaying exponential function with a decay constant of 49.75 (blue) or 36.63 (red) residues. (B) Local alignment strength (Da) as a function of residue number, N. Alignment tensor values, extrapolated to Cys-13, are listed in Table S8. Exponential fits to the decreasing Da values (solid lines) yield persistence lengths of 149 and 110 residues at 20 and 35 °C, respectively. Da values that are not used for the exponential fits are plotted as open circles; fitted exponential curves are 23.06 × exp[(−(i – 13)/49.75] Hz and 17.54 × exp[(−(i – 13)/36.63] Hz, where i is the residue number, and fitted rmsd errors are 0.8 and 0.9 Hz at 20 and 35 °C, respectively.

References

    1. Swanson C. J.; Sivaramakrishnan S. Harnessing the Unique Structural Properties of Isolated alpha-Helices. J. Biol. Chem. 2014, 289 (37), 25460–25467. 10.1074/jbc.R114.583906. - DOI - PMC - PubMed
    1. Knight P. J.; Thirumurugan K.; Xu Y. H.; Wang F.; Kalverda A. P.; Stafford W. F.; Sellers J. R.; Peckham M. The predicted coiled-coil domain of myosin 10 forms a novel elongated domain that lengthens the head. J. Biol. Chem. 2005, 280 (41), 34702–34708. 10.1074/jbc.M504887200. - DOI - PubMed
    1. Peckham M.; Knight P. J. When a predicted coiled coil is really a single alpha-helix, in myosins and other proteins. Soft Matter 2009, 5, 2493–2503. 10.1039/b822339d. - DOI
    1. Suveges D.; Gaspari Z.; Toth G.; Nyitray L. Charged single alpha-helix: A versatile protein structural motif. Proteins: Struct., Funct., Genet. 2009, 74 (4), 905–916. 10.1002/prot.22183. - DOI - PubMed
    1. Zagrovic B.; Jayachandran G.; Millett I. S.; Doniach S.; Pande V. S. How large is an alpha-helix? Studies of the radii of gyration of helical peptides by small-angle X-ray scattering and molecular dynamics. J. Mol. Biol. 2005, 353 (2), 232–241. 10.1016/j.jmb.2005.08.053. - DOI - PubMed

Publication types