. 2019 Oct 23;141(42):16624-16634.
doi: 10.1021/jacs.9b03908. Epub 2019 Jun 19.

Rapid Structure Determination of Molecular Solids Using Chemical Shifts Directed by Unambiguous Prior Constraints

Affiliations

Rapid Structure Determination of Molecular Solids Using Chemical Shifts Directed by Unambiguous Prior Constraints

Albert Hofstetter et al. J Am Chem Soc. .

Abstract

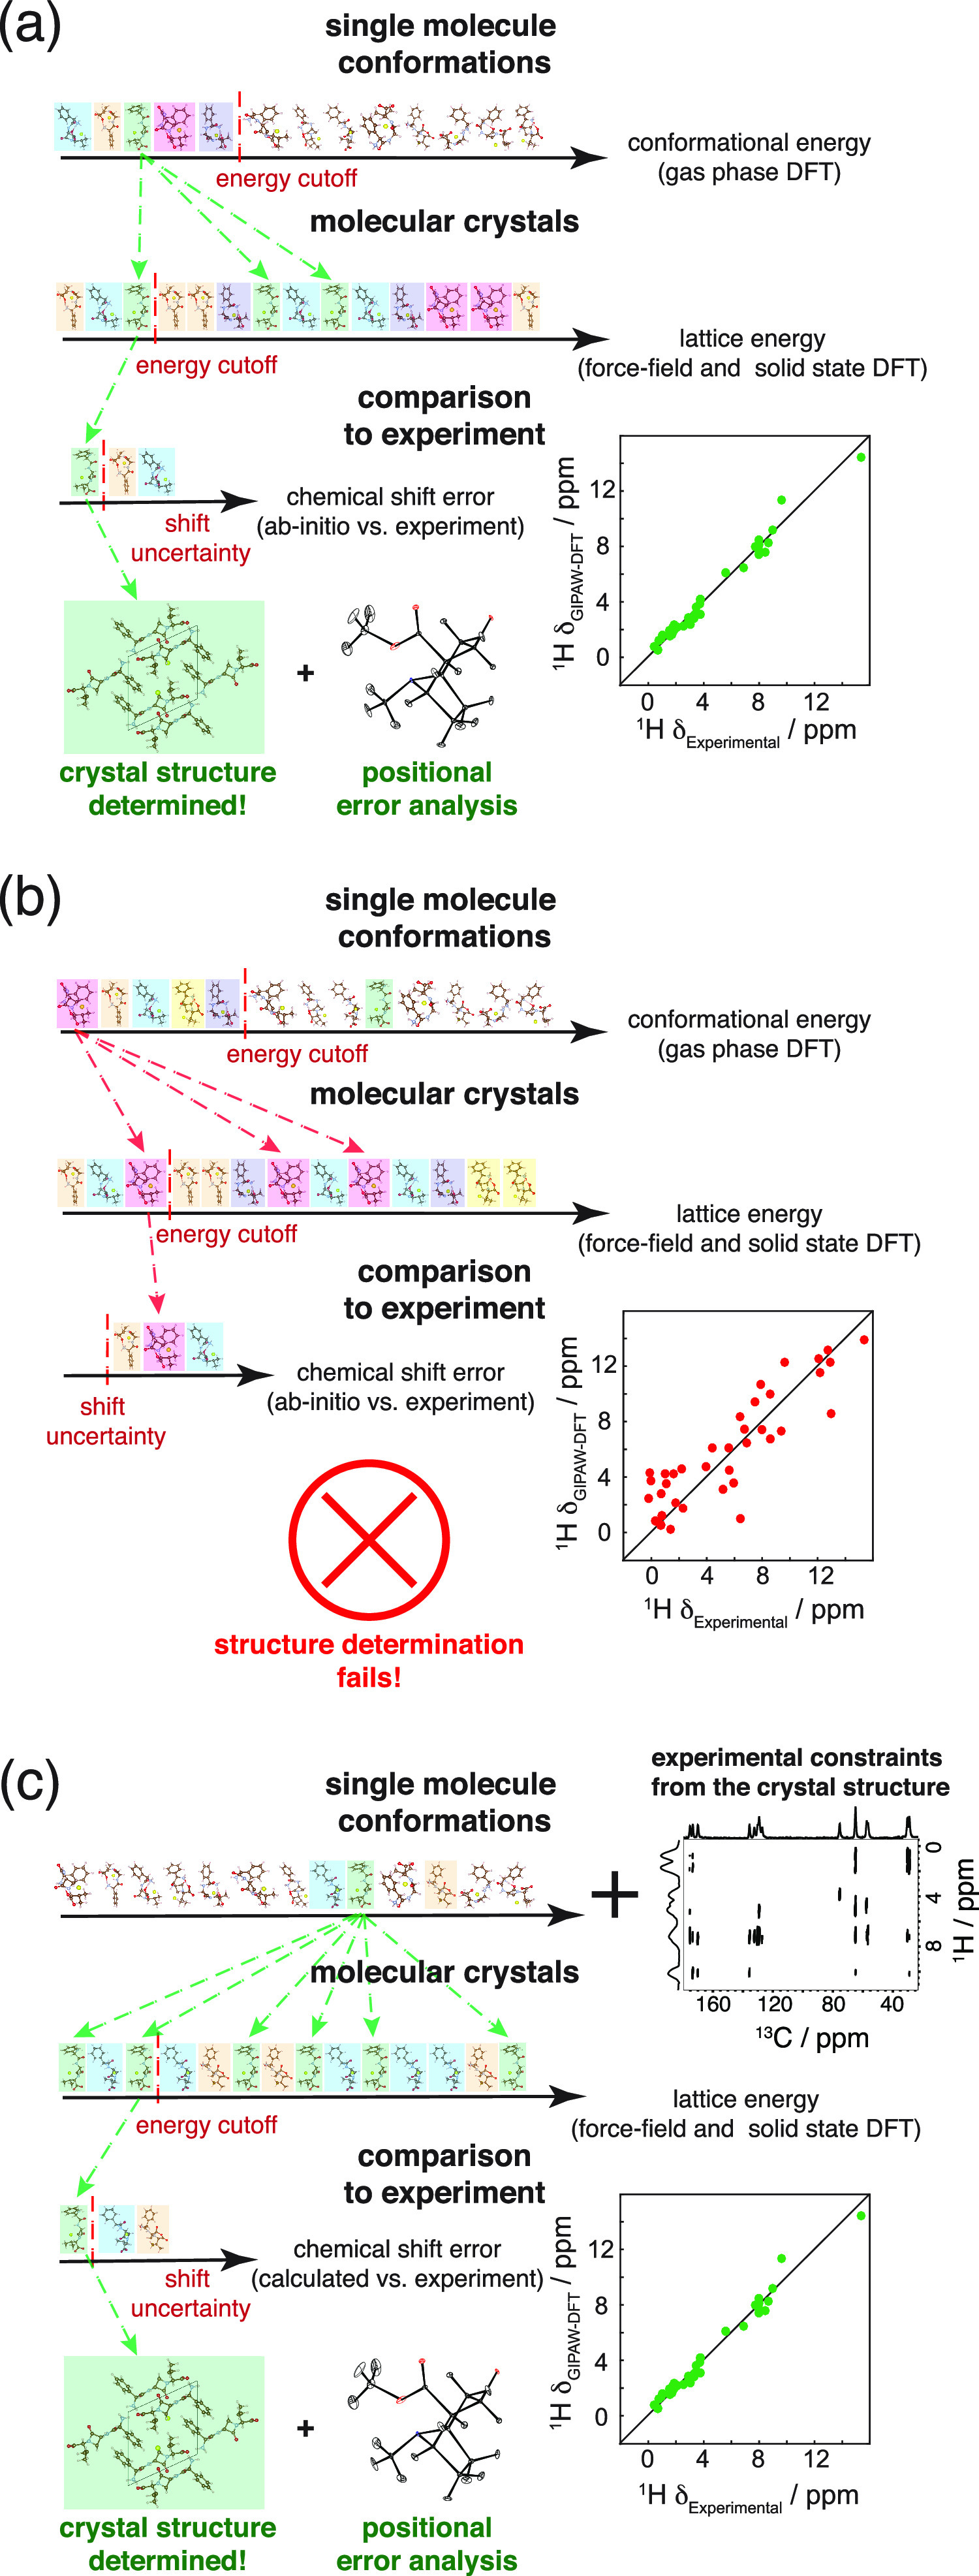
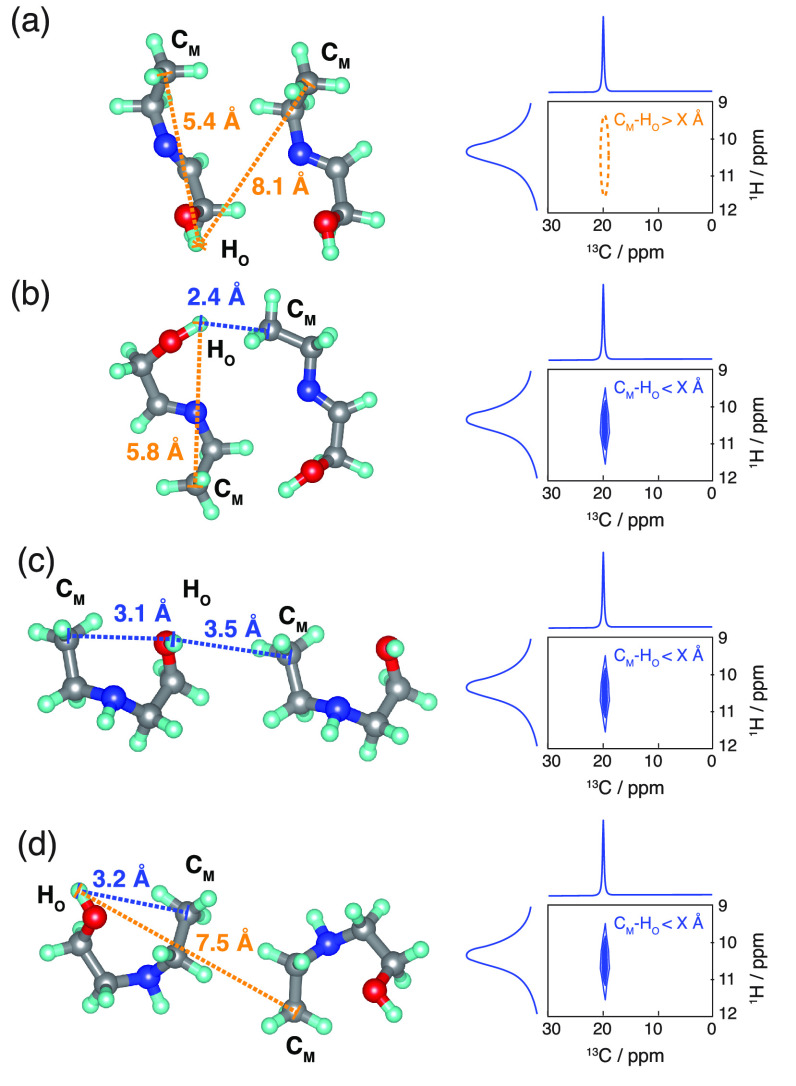
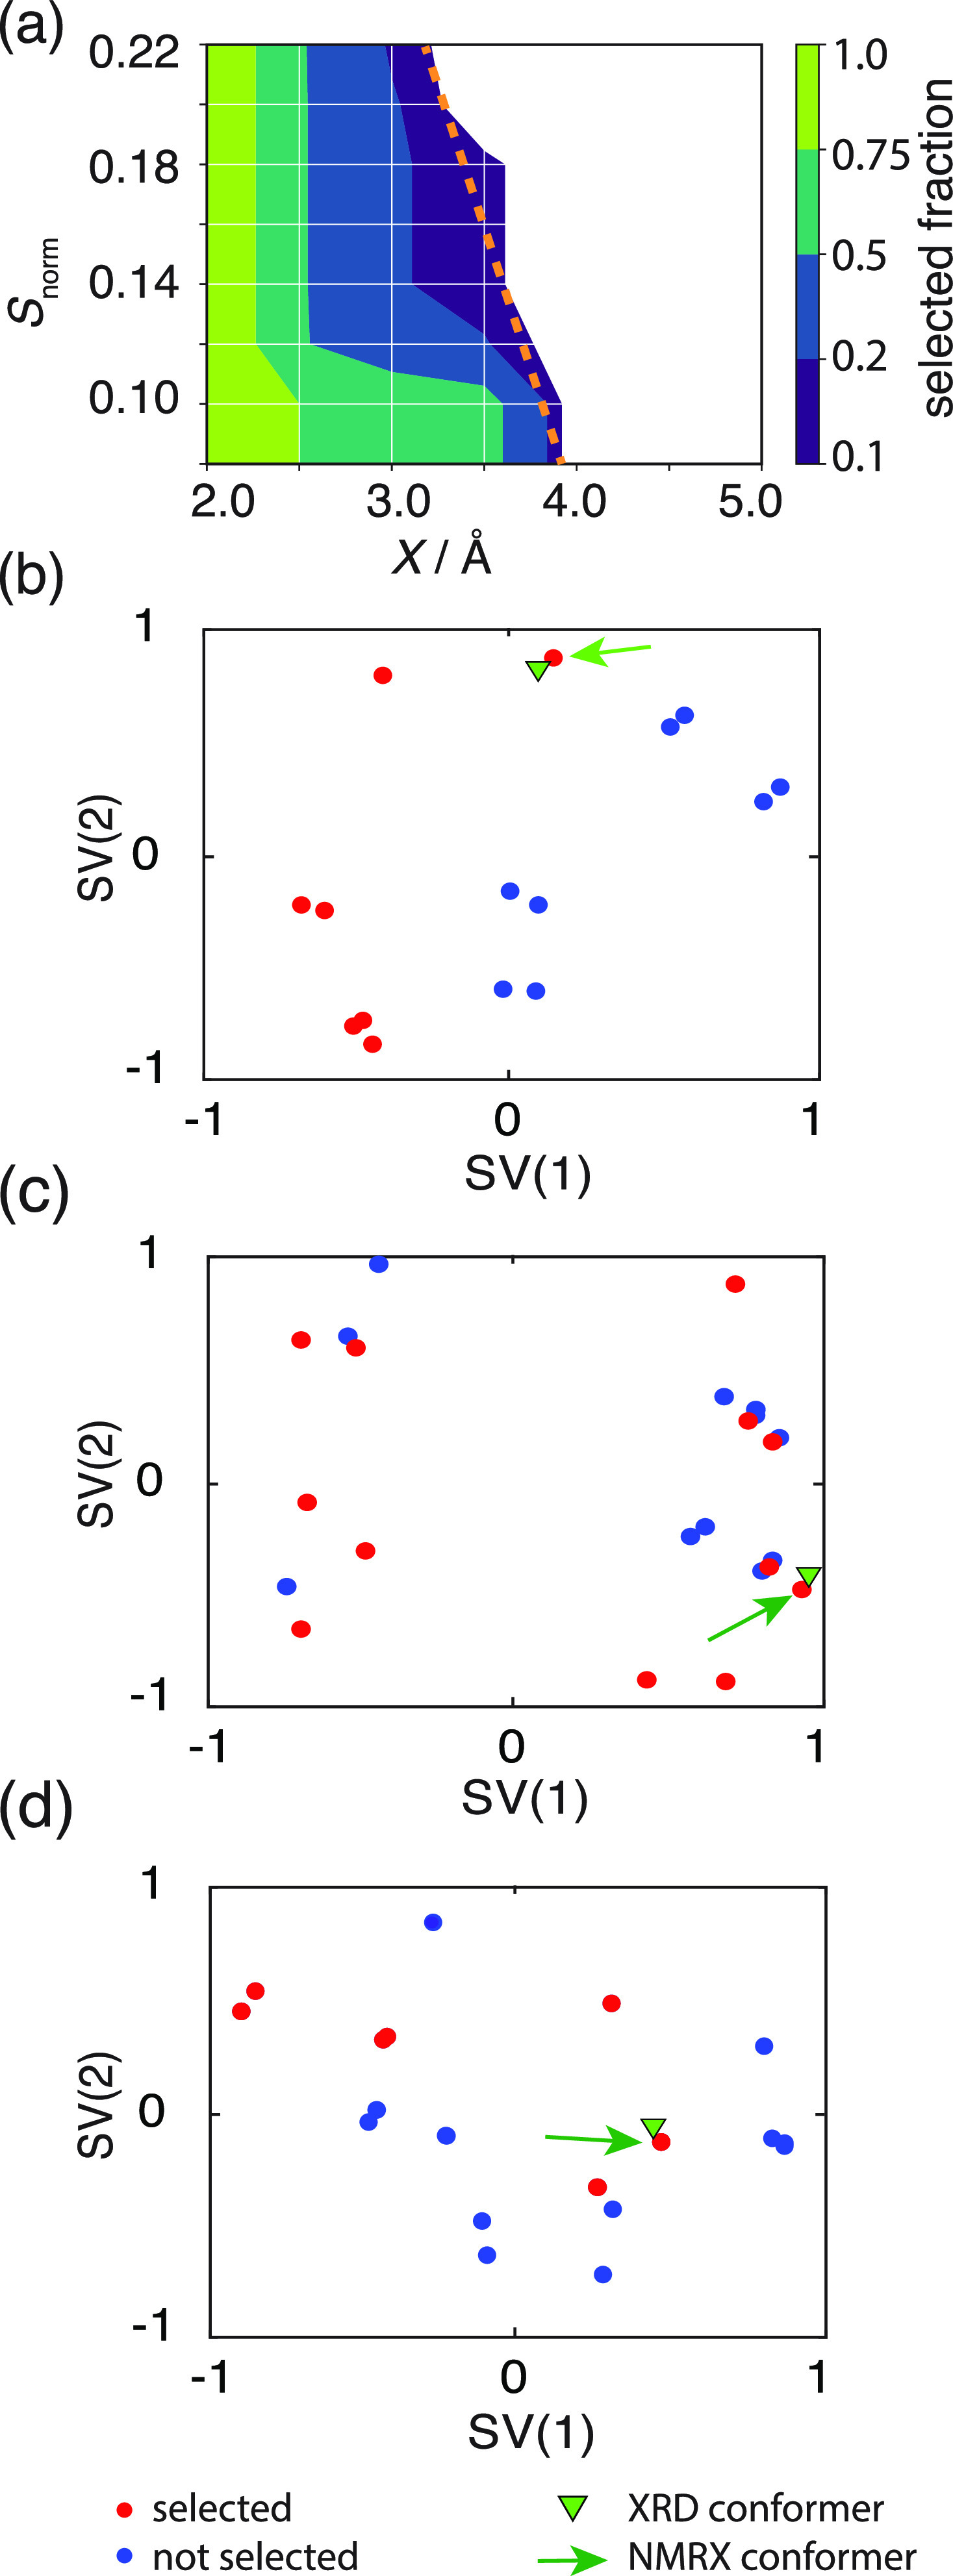
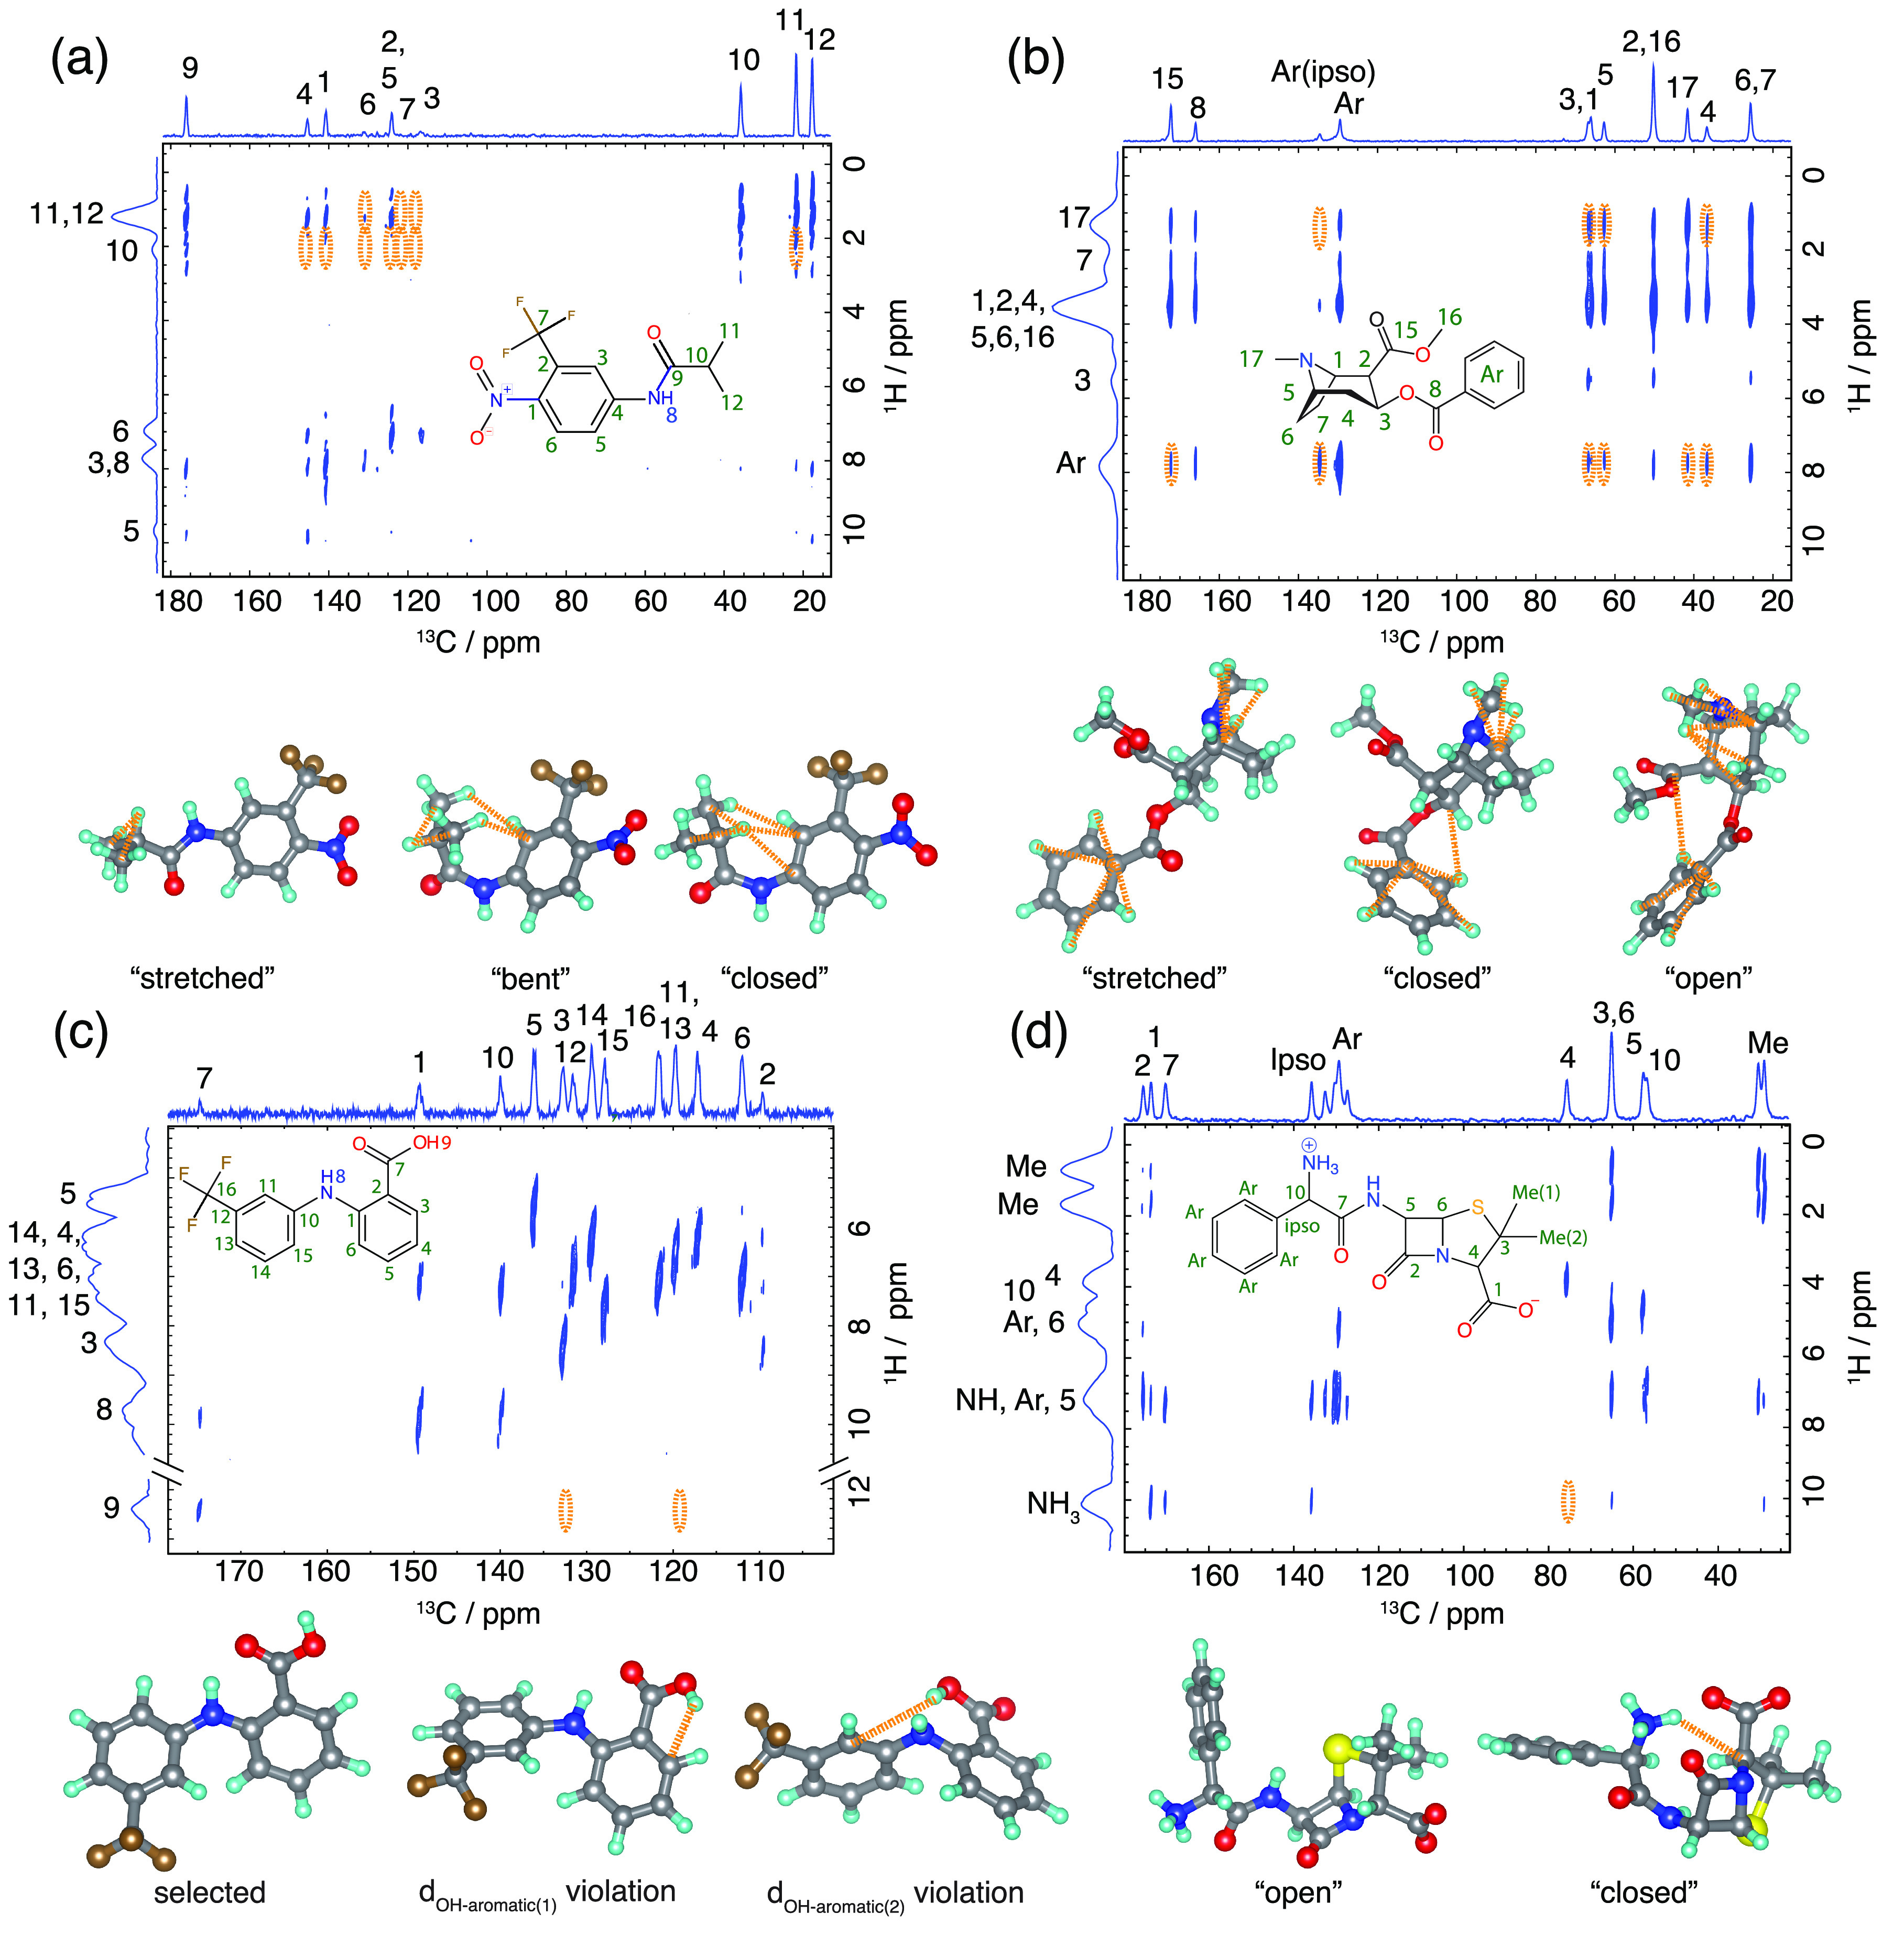
NMR-based crystallography approaches involving the combination of crystal structure prediction methods, ab initio calculated chemical shifts and solid-state NMR experiments are powerful methods for crystal structure determination of microcrystalline powders. However, currently structural information obtained from solid-state NMR is usually included only after a set of candidate crystal structures has already been independently generated, starting from a set of single-molecule conformations. Here, we show with the case of ampicillin that this can lead to failure of structure determination. We propose a crystal structure determination method that includes experimental constraints during conformer selection. In order to overcome the problem that experimental measurements on the crystalline samples are not obviously translatable to restrict the single-molecule conformational space, we propose constraints based on the analysis of absent cross-peaks in solid-state NMR correlation experiments. We show that these absences provide unambiguous structural constraints on both the crystal structure and the gas-phase conformations, and therefore can be used for unambiguous selection. The approach is parametrized on the crystal structure determination of flutamide, flufenamic acid, and cocaine, where we reduce the computational cost by around 50%. Most importantly, the method is then shown to correctly determine the crystal structure of ampicillin, which would have failed using current methods because it adopts a high-energy conformer in its crystal structure. The average positional RMSE on the NMR powder structure is ⟨rav⟩ = 0.176 Å, which corresponds to an average equivalent displacement parameter Ueq = 0.0103 Å2.


Conflict of interest statement

The authors declare no competing financial interest.

Figures

Figure 1
Figure 1
Schematic of current and proposed CSP-NMRX methods. (a) An example of a successful structure prediction using the current CSP-NMRX method. (b) An example of a failed structure prediction using the current CSP-NMRX method. (c) An example of the proposed experimentally constrained CSP-NMRX method, which successfully overcomes the failure of the current CSP-NMRX method shown in panel (b). In each panel the structures in the first line depict single-molecule gas-phase conformations sorted by their conformational energy. After application of a given selection criterion, a reduced conformer set is used to generate an ensemble of possible crystal structures (represented by the second line in each panel). The colored boxes are intended as a guide to the eye as to which conformer results in which crystal structures. The third line in each panel represents crystal structures picked from the second line after a further selection criterion is applied. This final set of structures is then compared to the experimental chemical shifts to determine the correct crystal structure. In each panel, the scatter plot shows the experimental 1H chemical shift plotted against the DFT-calculated 1H chemical shift for the trial structure with the lowest error between DFT and experimental chemical shifts.
Figure 2
Figure 2
Schematic illustrations of 1H–13C HETCOR spectra (right) for four different structural fragments (left) and the derived constraints. Structures (a) and (b) contain an “open” conformer. Structures (c) and (d) contain a “closed” conformer. Blue dotted lines are sufficiently short C–H distances between CM and HO to generate peaks in the spectra. Orange dotted lines are too long to generate peaks. After applying the constraints with a threshold distance of X = 3.5 Å, we see that the absence of a peak in fragment (a) is the only unambiguous constraint.
Figure 3
Figure 3
(a) Grid search results of the threshold distance X and Snorm cutoff values for flutamide, cocaine, and flufenamic acid. The color-map shows the percentage of selected structures from within the conformer ensemble. The white area indicates the region where the correct conformer is not selected. Optimal selection parameters should select the smallest conformer ensemble that still contains the correct structure. This corresponds to the dark blue regions within the different panels. The dashed orange line denotes the boundary at which the selection process starts to fail. (b–d) Conformer selection for flutamide (b), flufenamic acid (c), and cocaine (d). The panels show the sketch-map projections of the gas-phase ensembles. Red dots represent the structures that are selected where a threshold distance X of 3.5 Å and an Snorm cutoff value of 0.14 were used. The green triangle shows the conformer found in the XRD-generated crystal structure. The green arrow points to the gas-phase conformer which results in the correct crystal structure after the CSP procedure.
Figure 4
Figure 4
The top part in each panel shows the 1H–13C HETCOR spectrum of flutamide with a 1.25 ms 1H–13C cross-polarization contact time (a), cocaine with a 1.0 ms contact time (b), flufenamic acid with a 1.5 ms contact time (c), and ampicillin with a 1.5 ms contact time (d) (further details and raw data in the SI). 13C peaks are assigned based on the literature, and 1H peaks are assigned from HETCOR spectra and DFT chemical shift calculations (see SI). The cross-peaks from the terminal protons (Figure S4a) below Snorm = 0.14 were used as constraints on the conformer ensembles and are indicated as orange ellipsoids. The lower part of each panel shows the violated constraints extracted from all of the 1H–13C HETCOR cross-peaks for different example conformers within the ensembles.
Figure 5
Figure 5
Conformer selection for ampicillin. (a) The panel shows the sketch-map projections of the gas-phase conformer ensemble. Red dots represent the structures which are selected using a threshold distance X = 3.5 Å and Snorm = 0.14. The green triangle denotes the conformer found in the XRD-determined crystal structure. The green arrow points to the gas-phase conformer which results in the correct crystal structure after the CSP procedure. (b) Scatter plot showing the relative difference in the energy (ΔE) for the single-molecule conformers of ampicillin against the shortest intramolecular hydrogen-bond distance (N–O distance). The blue dashed line is the typical cutoff energy (25 kJ/mol) used for conformer selection in CSP. The green dotted line is a guide to the eye to show at which ΔE the conformers with intermolecular hydrogen bonds become accessible. The green arrow shows the conformer which results in the correct crystal structure.
Figure 6
Figure 6
Comparison of crystal structure candidates. The structures are sorted according to their relative lattice energy, as specified on the horizontal axis. The vertical axis shows 1H chemical shift RMSE between DFT-calculated and experimental chemical shifts. The orange marker shows the 1H chemical shift RMSE for the single-crystal XRD structure. The red line shows the mean of the expected difference between experimental and DFT-calculated 1H chemical shifts, with the distinguishability limits (at the 1σ level) indicated as the gray shaded zone, as described in the main text.
Figure 7
Figure 7
(a) Comparison between the structure of ampicillin as determined by the constrained powder 1H CSP-NMRX and the single-crystal XRD determined structure. (b,c) ORTEP plots of the ampicillin crystal (b) and single-molecule (c) structure drawn at the 90% probability level. The anisotropic ellipsoids correspond to a 1H chemical shift RMSE of 0.49 ppm and to an average positional RMSE of ⟨rav⟩ = 0.144 Å.

References

    1. Groom C. R.; Bruno I. J.; Lightfoot M. P.; Ward S. C. The Cambridge Structural Database. Acta Crystallogr., Sect. B: Struct. Sci., Cryst. Eng. Mater. 2016, 72 (2), 171–179. 10.1107/S2052520616003954. - DOI - PMC - PubMed
    1. Grazulis S.; Chateigner D.; Downs R. T.; Yokochi A. F.; Quiros M.; Lutterotti L.; Manakova E.; Butkus J.; Moeck P.; Le Bail A. Crystallography Open Database - an open-access collection of crystal structures. J. Appl. Crystallogr. 2009, 42 (4), 726–729. 10.1107/S0021889809016690. - DOI - PMC - PubMed
    1. Grazulis S.; Daskevic A.; Merkys A.; Chateigner D.; Lutterotti L.; Quiros M.; Serebryanaya N. R.; Moeck P.; Downs R. T.; Le Bail A. Crystallography Open Database (COD): an open-access collection of crystal structures and platform for world-wide collaboration. Nucleic Acids Res. 2012, 40 (D1), D420–D427. 10.1093/nar/gkr900. - DOI - PMC - PubMed
    1. Brown I. D.; Bergerhoff G. Databases of Inorganic Crystal-Structures. Abstr. Pap. Am. Chem. Soc. 1979, (Sep), 36–36.
    1. Batisai E.; Ayamine A.; Kilinkissa O. E. Y.; Báthori N. B. Melting point–solubility–structure correlations in multicomponent crystals containing fumaric or adipic acid. CrystEngComm 2014, 16 (43), 9992–9998. 10.1039/C4CE01298D. - DOI

Publication types

LinkOut - more resources