Randomized Controlled Trial
. 2019 May 22;19(1):453.
doi: 10.1186/s12879-019-4049-5.

HAI and NAI titer correlates of inactivated and live attenuated influenza vaccine efficacy

Affiliations
Randomized Controlled Trial

HAI and NAI titer correlates of inactivated and live attenuated influenza vaccine efficacy

Peter B Gilbert et al. BMC Infect Dis. .

Abstract

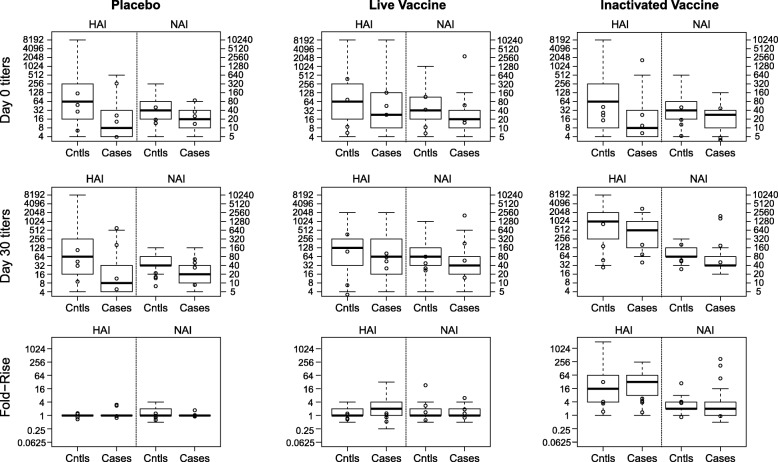
Background: High hemagglutination inhibition (HAI) and neuraminidase inhibition (NAI) titers are generally associated with reduced influenza risk. While repeated influenza vaccination reduces seroresponse, vaccine effectiveness is not always reduced.

Methods: During the 2007-2008 influenza season, a randomized, placebo-controlled trial (FLUVACS) evaluated the efficacies of live-attenuated (LAIV) and inactivated influenza vaccines (IIV) among healthy adults aged 18-49 in Michigan; IIV vaccine efficacy (VE) and LAIV VE against influenza disease were estimated at 68% and 36%. Using the principal stratification/VE moderation framework, we analyzed data from this trial to assess how each VE varied by HAI or NAI responses to vaccination observed for vaccinated individuals and predicted counterfactually for placebo recipients. We also assessed how each VE varied with pre-vaccination/baseline variables including HAI titer, NAI titer, and vaccination history.

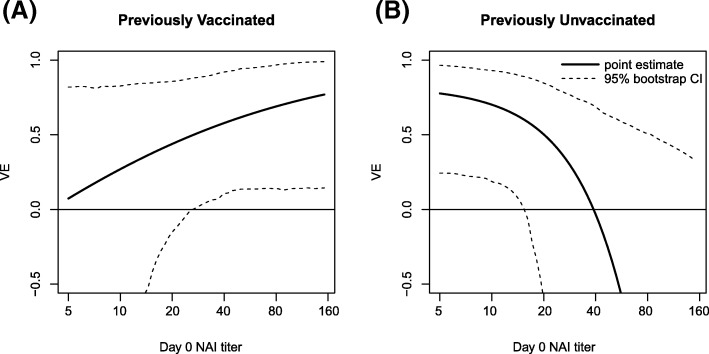
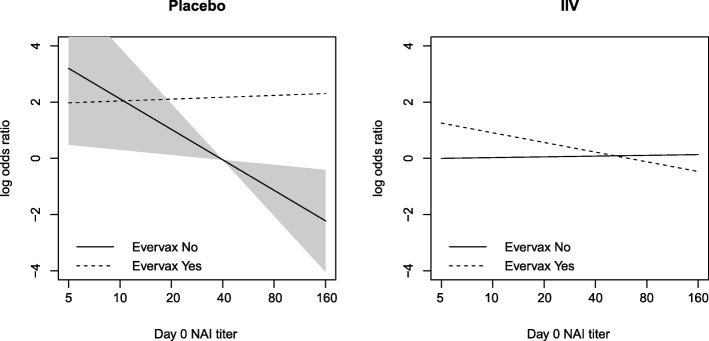
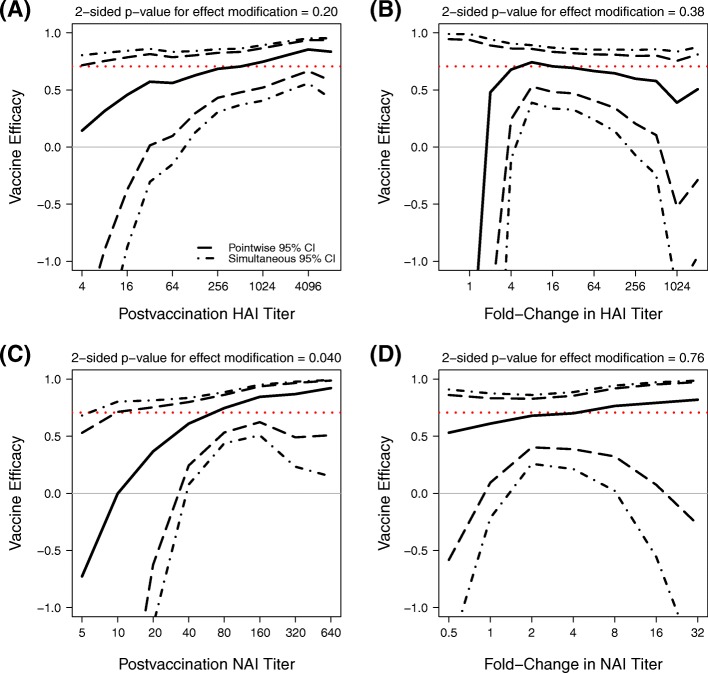
Results: IIV VE appeared to increase with Day 30 post-vaccination HAI titer, albeit not significantly (p=0.20 and estimated VE 14.4%, 70.5%, and 85.5% at titer below the assay lower quantification limit, 512, and 4096 (maximum)). Moreover, IIV VE increased significantly with Day 30 post-vaccination NAI titer (p=0.040), with estimated VE zero at titer 10 and 92.2% at highest titer 640. There was no evidence that fold-change in post-vaccination HAI or NAI titer associated with IIV VE (p=0.76, 0.38). For LAIV, there was no evidence that VE associated with post-vaccination or fold-rise HAI or NAI titers (p-values >0.40). For IIV, VE increased with increasing baseline NAI titer in those previously vaccinated, but VE decreased with increasing baseline NAI titer in those previously unvaccinated. In contrast, for LAIV, VE did not depend on previous vaccination or baseline HAI or NAI titer.

Conclusions: Future efficacy trials should measure baseline and post-vaccination antibody titers in both vaccine and control/placebo recipients, enabling analyses to better elucidate correlates of vaccine- and natural-protection.

Trial registration: ClinicalTrials.gov NCT00538512. October 1, 2007.

Keywords: FLUVACS trial; Hemagglutinin inhibition (HAI) titers; Immune correlates; Neuraminidase inhibition (NAI) titer; Principal stratification/vaccine efficacy moderation framework; Vaccine efficacy.


Conflict of interest statement

Arnold S. Monto declares grant support from Sanofi Pasteur and consultancy fees from Sanofi Pasteur, Novartis, and Novavax. Peter B. Gilbert declares grant support from Sanofi Pasteur.

Figures

Fig. 1
Fig. 1
Boxplots of Day 0, Day 30, and fold-rise HAI and NAI titers by treatment group (Placebo, LAIV, IIV) and influenza case-control outcome status. Boxplots of HAI and NAI titers by treatment group and influenza case-control outcome status. Day 0 titers (top row), Day 30 titers (middle row), and titer fold-rise (Day 30 / Day 0) are shown for participants assigned to placebo (left column), live attenuated influenza vaccine (middle column), or inactivated influenza vaccine (right column)
Fig. 2
Fig. 2
Distributions of Day 0 HAI and NAI titers by previous vaccination status and age. for all three treatment groups combined. Small perturbations are added to titer values to improve visibility. Spearman correlation coefficients r are shown in the scatterplots. Data shown are from all three treatment groups combined. Small perturbations are added to titer values to improve visibility. Spearman correlation coefficients r are shown in the scatterplots. For the HAI titer plots, 8192 means >4096 and 4 means <8 (the upper and lower limits of quantification of the HAI assay were 4096 and 8, respectively)
Fig. 3
Fig. 3
VE of the IIV vaccine depends on baseline NAI titer differently among the previously vaccinated and previously unvaccinated. VE-by-Day-0 NAI titer plots are shown for the IIV vaccine in (a) the previously vaccinated vs (b) unvaccinated
Fig. 4
Fig. 4
Evervax modifies the association between Day 0 NAI and influenza risk with decreasing strength in the placebo arm. The shaded area is the pointwise 95% confidence region for the risk function among Evervax=NO in the placebo group. The slopes of the other three risk functions are not significantly different from 0
Fig. 5
Fig. 5
Estimated IIV VE by Day 30 and fold-rise HAI and NAI titer variables. Estimated VE by a Day 30 HAI titer if assigned vaccine, b fold-rise in HAI titer if assigned vaccine, c Day 30 NAI titer if assigned vaccine, d fold-rise in NAI titer if assigned vaccine. Each solid black line is the estimated VE by the Juraska (2018) method [48]. Dashed and dot-dashed black lines are pointwise and simultaneous 95% confidence intervals, respectively. Each dotted red line is the estimated overall VE. P-values shown are 2-sided p-values for effect modification
Fig. 6
Fig. 6
Estimated LAIV VE by Day 30 and fold-rise HAI and NAI titer variables. Estimated VE by a Day 30 HAI titer if assigned vaccine, b fold-rise in HAI titer if assigned vaccine, c Day 30 NAI titer if assigned vaccine, d fold-rise in NAI titer if assigned vaccine. Each solid black line is the estimated VE by the Juraska (2018) method [48]. Dashed and dot-dashed black lines are pointwise and simultaneous 95% confidence intervals, respectively. Each dotted red line is the estimated overall VE. P-values shown are 2-sided p-values for effect modification

References

    1. Chen GL, Subbarao K. Attacking the flu: Neutralizing antibodies may lead to ‘universal’ vaccine. Nat Med. 2009;15(11):1251. doi: 10.1038/nm1109-1251. - DOI - PMC - PubMed
    1. Houser K, Subbarao K. Influenza vaccines: Challenges and solutions. Cell Host Microbe. 2015;17(3):295–300. doi: 10.1016/j.chom.2015.02.012. - DOI - PMC - PubMed
    1. Coudeville L, Bailleux F, Riche B, Megas F, Andre P, Ecochard R. Relationship between haemagglutination-inhibiting antibody titres and clinical protection against influenza: Development and application of a bayesian random-effects model. BMC Med Res Methodol. 2010;10:18. doi: 10.1186/1471-2288-10-18. - DOI - PMC - PubMed
    1. Hobson D, Curry RL, Beare AS, Ward-Gardner A. The role of serum haemagglutination-inhibiting antibody in protection against challenge infection with influenza A2 and B viruses. J Hyg (Lond) 1972;70(4):767–77. doi: 10.1017/S0022172400022610. - DOI - PMC - PubMed
    1. Potter CW, Oxford JS. Determinants of immunity to influenza infection in Man. Br Med Bull. 1979;35(1):69–75. doi: 10.1093/oxfordjournals.bmb.a071545. - DOI - PubMed

Publication types

Associated data