. 2019 May 22;20(1):102.
doi: 10.1186/s13059-019-1706-3.

ChiCMaxima: a robust and simple pipeline for detection and visualization of chromatin looping in Capture Hi-C

Affiliations

ChiCMaxima: a robust and simple pipeline for detection and visualization of chromatin looping in Capture Hi-C

Yousra Ben Zouari et al. Genome Biol. .

Abstract

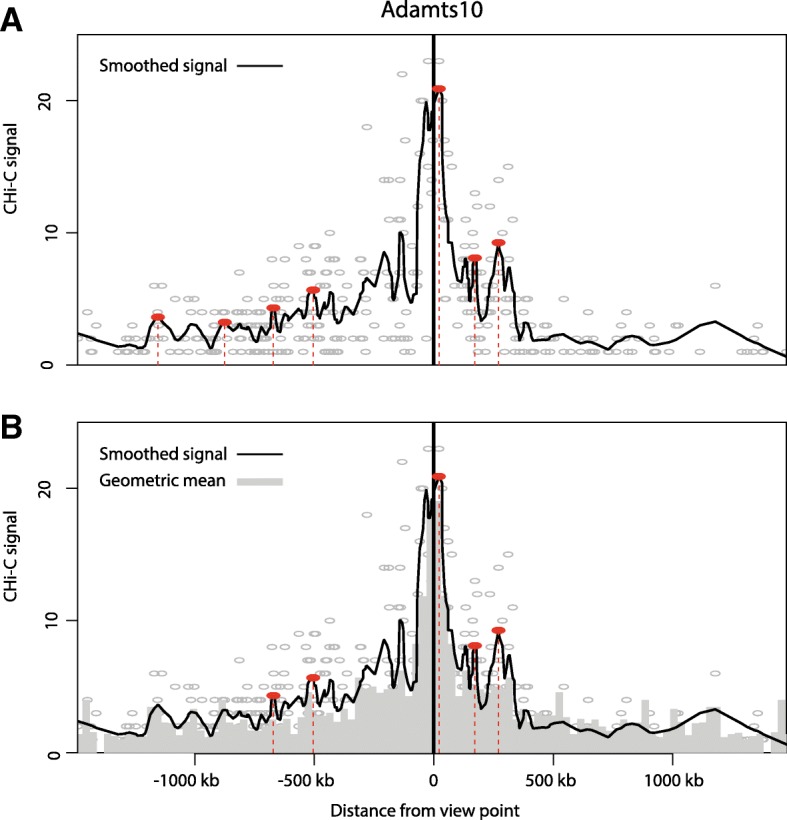
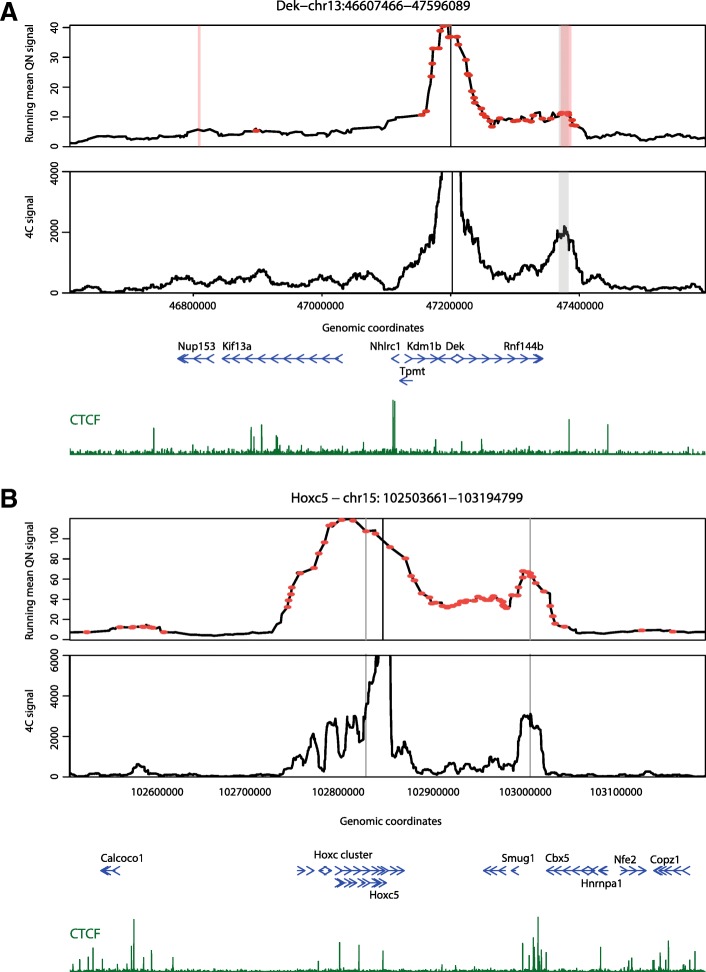
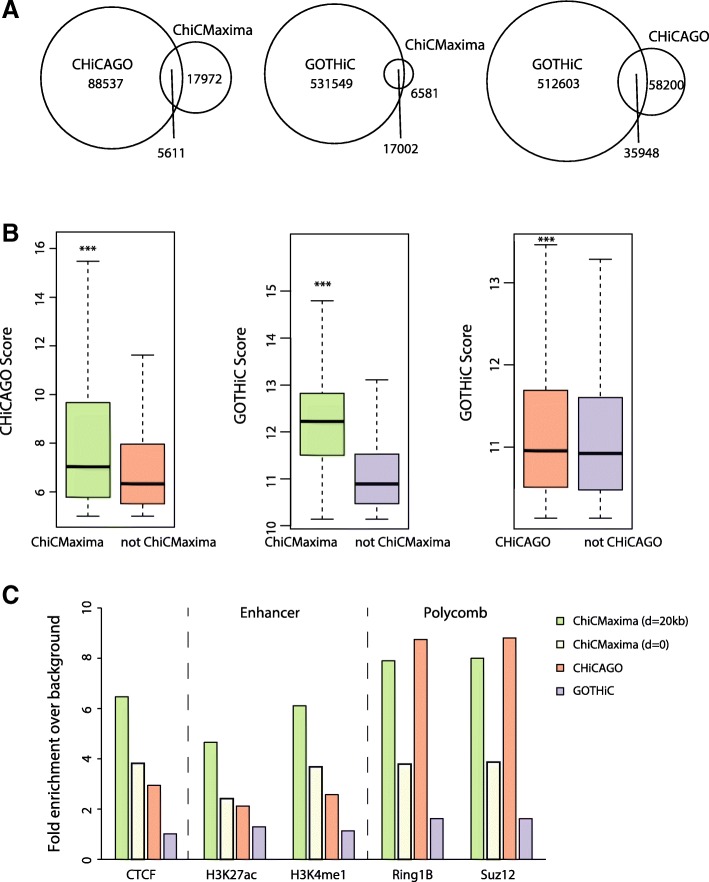
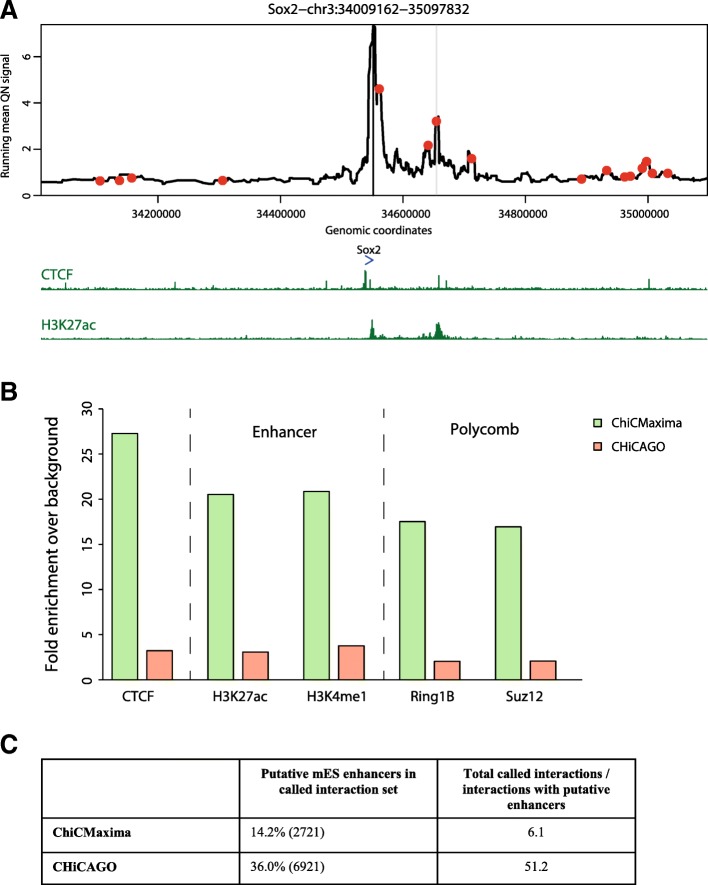
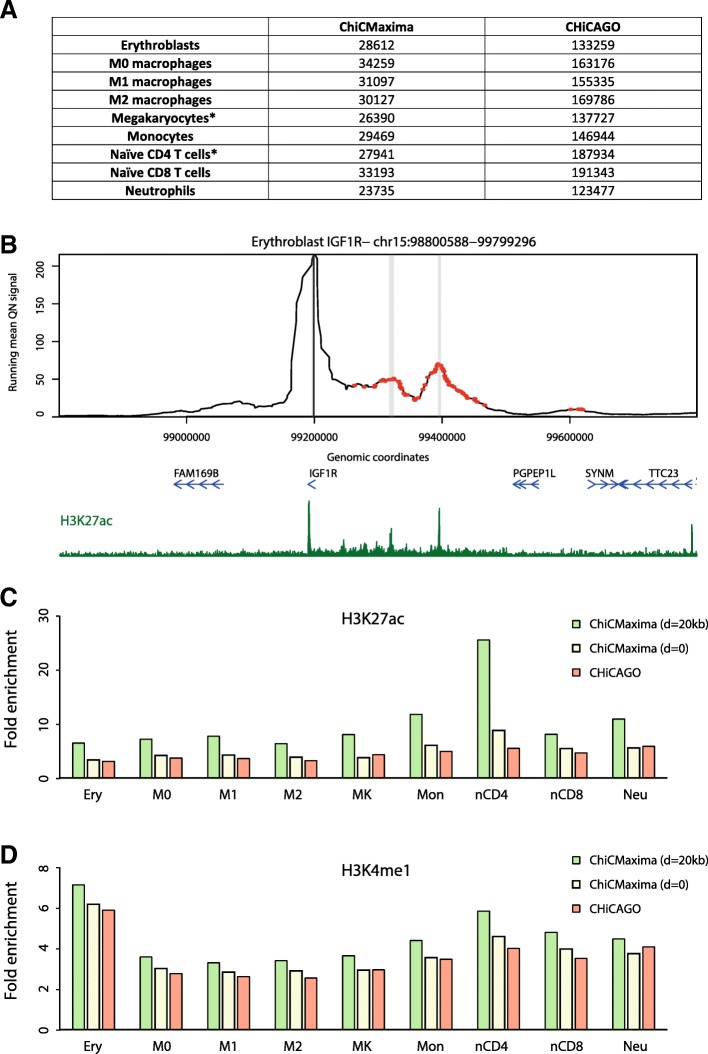
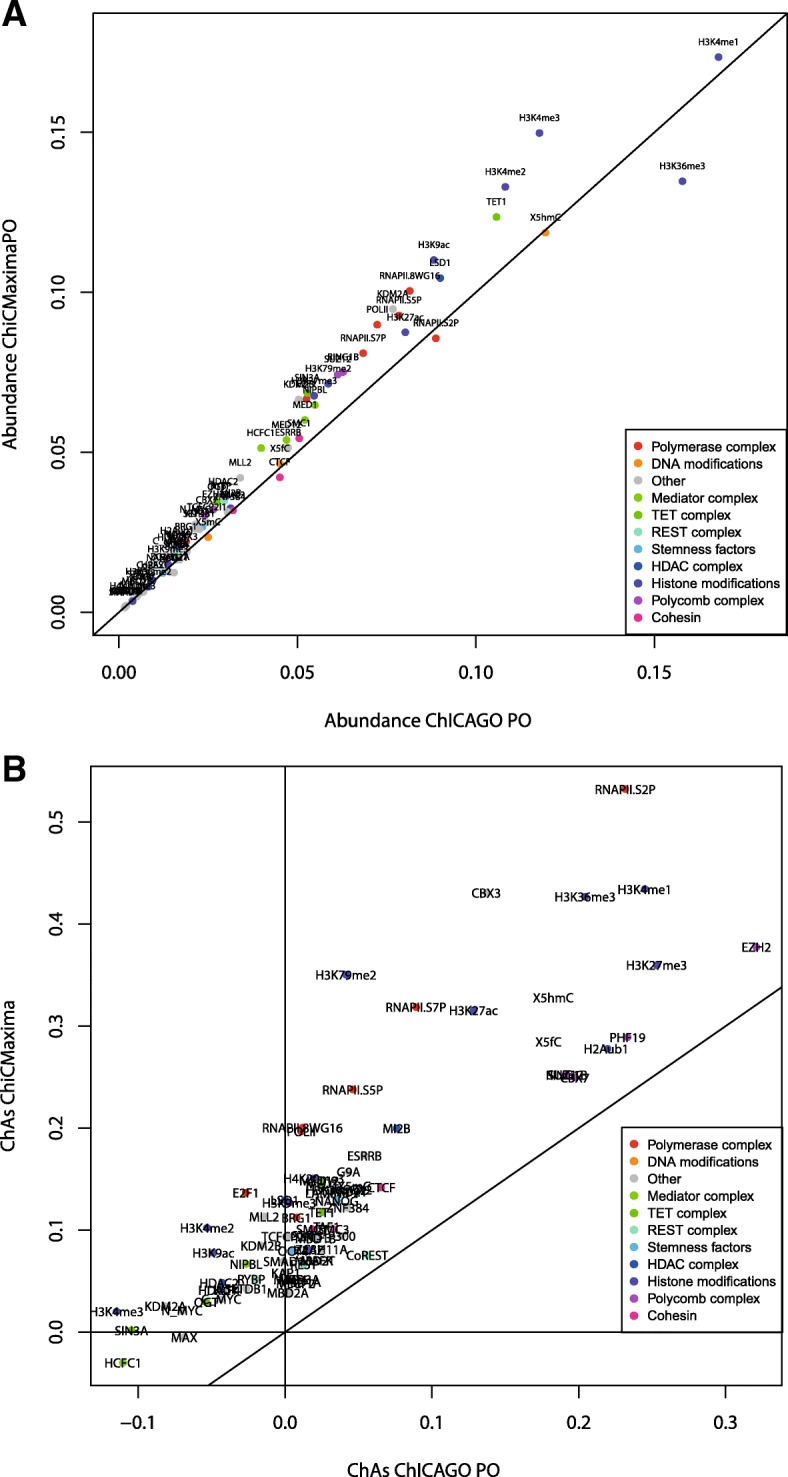
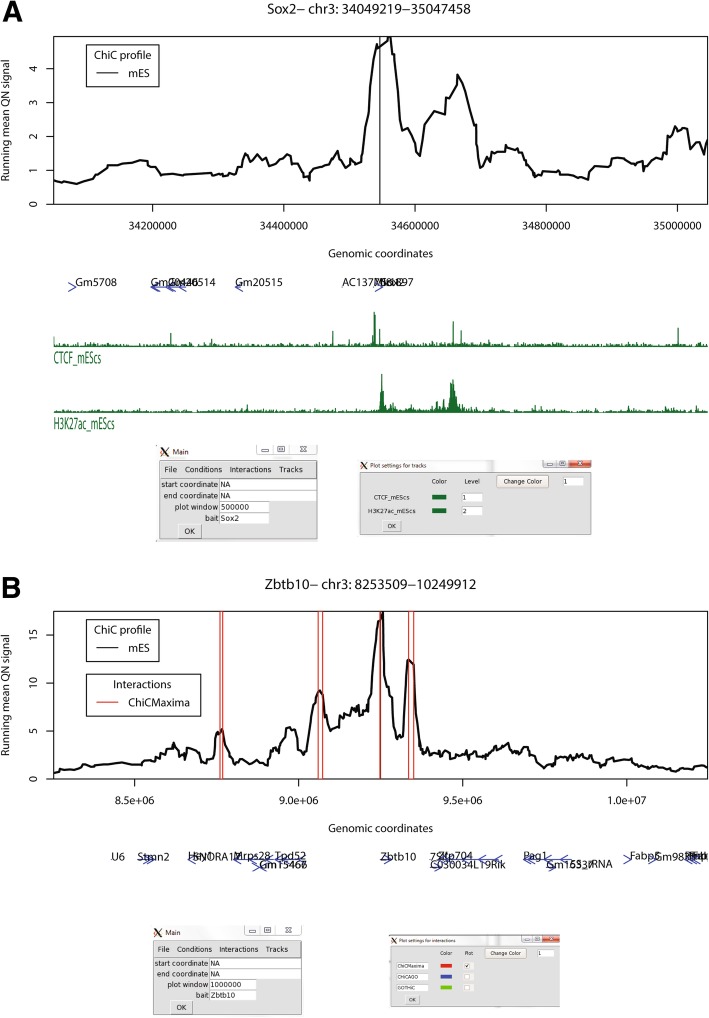
Capture Hi-C (CHi-C) is a new technique for assessing genome organization based on chromosome conformation capture coupled to oligonucleotide capture of regions of interest, such as gene promoters. Chromatin loop detection is challenging because existing Hi-C/4C-like tools, which make different assumptions about the technical biases presented, are often unsuitable. We describe a new approach, ChiCMaxima, which uses local maxima combined with limited filtering to detect DNA looping interactions, integrating information from biological replicates. ChiCMaxima shows more stringency and robustness compared to previously developed tools. The tool includes a GUI browser for flexible visualization of CHi-C profiles alongside epigenomic tracks.

Keywords: Biological replicates; Capture Hi-C; Chromatin assortativity; Chromatin loops; Gene regulation; Promoter-enhancer interactions.


Conflict of interest statement

The authors declare that they have no competing interests.

Figures

Fig. 1
Fig. 1
Interaction calling by ChiCMaxima. a Virtual 4C profile derived from one mES CHi-C replicate centered on the bait Adamts10 promoter. The numbers of raw CHi-C sequence reads are plotted as gray circles against their genomic location, and the black line shows the loess-smoothed profile (span = 0.05). Red dotted lines and filled circles denote the positions of called interactions, defined as local maxima of smoothed signal within a fixed number of covered restriction fragments (window = 20). b The same virtual 4C profile as a, plotted with a bar chart of the geometric means for sequence reads from the profile, stratified by genomic distance between the bait and interacting region (bins of 30 kb). Red dotted lines and filled circles denote the same local maxima as a, which have smoothed signal greater than the geometric mean for the corresponding interaction distance, and so are kept as ChiCMaxima-called interactions
Fig. 2
Fig. 2
ChiCMaxima precisely calls chromatin interactions. a mES CHi-C (upper panel) and 4C (lower panel) profiles centered on the bait Dek promoter are shown. The interactions called by ChiCMaxima and CHiCAGO are denoted as stripes (gray and pink, respectively); points denote interactions called by GOTHiC. GOTHiC seemingly calls many spurious interactions. b mES CHi-C (upper panel) and 4C (lower panel) profiles centered on the bait Hoxc5 promoter are shown. The interactions called by ChiCMaxima are denoted as gray stripes, and a large number of seemingly spurious interactions called by CHiCAGO are denoted as red points. Called interactions conserved between ChiCMaxima and CHiCAGO are centered on CTCF sites. For both profiles, gene position (blue) and CTCF ChIP-seq profiles (dark green) are shown below the CHi-C and 4C profiles
Fig. 3
Fig. 3
Comparison of ChiCMaxima, CHiCAGO, and GOTHiC on mES CHi-C data. a Venn diagrams showing numbers of interactions called by the three different methods which are conserved with the other methods. b Box plots comparing the CHiCAGO (left) or GOTHiC (center and right) metric scores of interaction strength for the sets of interactions called by CHiCAGO (left) or GOTHiC (center and right) which are conserved with those called by ChiCMaxima (left and center) or CHiCAGO (right), versus those which are not. ***P < 2 × 10−16; Wilcoxon rank sum test. c Bar charts showing fold enrichment over genomic background for different ChIP-seq peaks within the promoter-interacting sequences determined by the different CHi-C analysis methods
Fig. 4
Fig. 4
ChiCMaxima performance on mES HiCap data. a mES HiCap profile centered on the Sox2 promoter. The interaction with the Sox2 enhancer called by ChiCMaxima is denoted as a gray stripe, and CHiCAGO-called interactions, including a large number of seemingly spurious ones, are denoted as red points. Gene position (blue) and selected mES ChIP-seq profiles (dark green) are shown below the HiCap profile. b Bar charts showing fold enrichment over genomic background for different ChIP-seq peaks within the promoter-interacting sequences determined by ChiCMaxima and CHiCAGO. c Overview of putative mES enhancers found within HiCap interactions called by ChiCMaxima and CHiCAGO
Fig. 5
Fig. 5
ChiCMaxima performance on CHi-C data from human primary hematopoietic cells. a Numbers of interactions called by ChiCMaxima and CHiCAGO on the different datasets (three biological replicates for all, except for those denoted by an asterisk, which had four biological replicates). b Erythroblast CHi-C profile centered on the IGF1R promoter. Interactions called by ChiCMaxima are denoted as gray stripes, and those called by CHiCAGO are denoted as red points. Gene position (blue) and the erythroblast H3K27ac ChIP-seq profile (dark green) are shown below the CHi-C profile. c Bar charts showing fold enrichment over genomic background for H3K27ac peaks within the promoter-interacting sequences determined by ChiCMaxima and CHiCAGO for the nine hematopoietic cell types. d Bar charts showing fold enrichment over genomic background for H3K4me1 peaks within the promoter-interacting sequences determined by ChiCMaxima and CHiCAGO for the nine hematopoietic cell types
Fig. 6
Fig. 6
Exploration of chromatin assortativity of different features on the ChiCMaxima-generated chromatin contacts derived from the mES CHi-C data. a Scatter plot of abundance of different chromatin features within the interaction networks called by ChiCMaxima or CHiCAGO. b Scatter plot of chromatin assortativity of different chromatin features within the interaction networks called by ChiCMaxima or CHiCAGO (restricted to promoter-other end interactions). The class of the different chromatin features is color coded
Fig. 7
Fig. 7
Some functionalities of ChiCBrowser. a A screenshot of ChiCBrowser, showing the mES CHi-C profile for 500 kb up- and downstream of the bait Sox2 promoter. Gene positions (blue) and selected mES ChIP-seq tracks (green) are shown below the profile. The main ChiCBrowser user interface window is shown underneath (left), where the bait and plot window have been specified. A sub-window, called from the Tracks menu (right), allows the color and level of the epigenomic profiles to be controlled by the user. Epigenomic tracks that are given the same level (for instance, the same histone mark in different tissues) are scaled to the same level on the y-axis so that the profiles are visually comparable. b As for a, a screenshot of the mES CHi-C profile for 1 Mb up- and downstream of the bait Zbtb10 promoter. Open red rectangles show the position of interactions called by ChiCMaxima. The sub-menu on the bottom right, called from the Interactions menu, allows the user to control which interaction lists to annotate on the CHi-C plot

References

    1. Dekker J, Rippe K, Dekker M, Kleckner N. Capturing chromosome conformation. Science. 2002;295:1306–1311. doi: 10.1126/science.1067799. - DOI - PubMed
    1. Dostie J, Richmond TA, Arnaout RA, Selzer RR, Lee WL, Honan TA, et al. Chromosome Conformation Capture Carbon Copy (5C): a massively parallel solution for mapping interactions between genomic elements. Genome Res. 2006;16:1299–1309. doi: 10.1101/gr.5571506. - DOI - PMC - PubMed
    1. Fullwood MJ, Liu MH, Pan YF, Liu J, Xu H, Mohamed YB, et al. An oestrogen-receptor-alpha-bound human chromatin interactome. Nature. 2009;462:58–64. doi: 10.1038/nature08497. - DOI - PMC - PubMed
    1. Lieberman-Aiden E, van Berkum NL, Williams L, Imakaev M, Ragoczy T, Telling A, et al. Comprehensive mapping of long-range interactions reveals folding principles of the human genome. Science. 2009;326:289–293. doi: 10.1126/science.1181369. - DOI - PMC - PubMed
    1. van de Werken HJ, Landan G, Holwerda SJ, Hoichman M, Klous P, Chachik R, et al. Robust 4C-seq data analysis to screen for regulatory DNA interactions. Nat Methods. 2012;9:969–972. doi: 10.1038/nmeth.2173. - DOI - PubMed

Publication types