

Complement 3+-astrocytes are highly abundant in prion diseases, but their abolishment led to an accelerated disease course and early dysregulation of microglia
- PMID: 31118110
- PMCID: PMC6530067
- DOI: 10.1186/s40478-019-0735-1
Complement 3+-astrocytes are highly abundant in prion diseases, but their abolishment led to an accelerated disease course and early dysregulation of microglia
Abstract
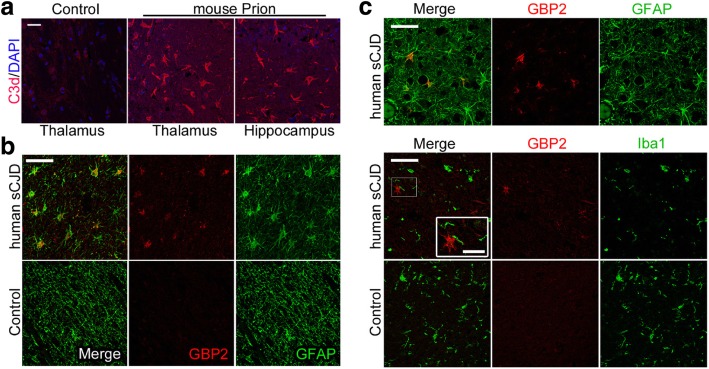
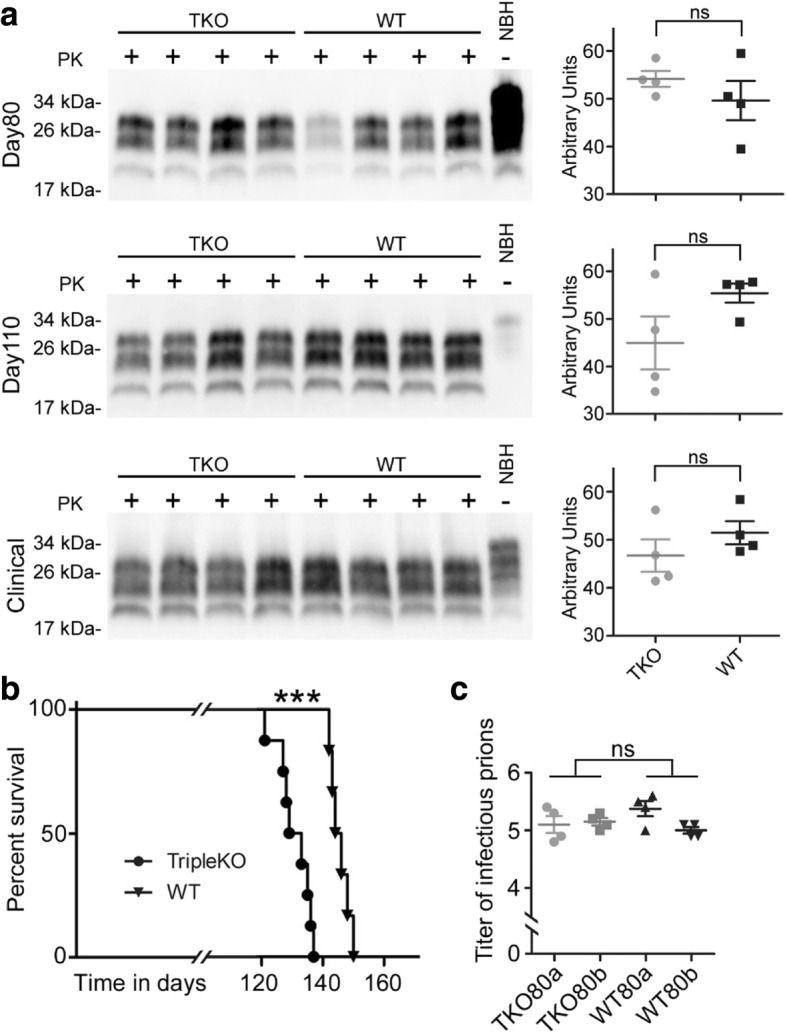
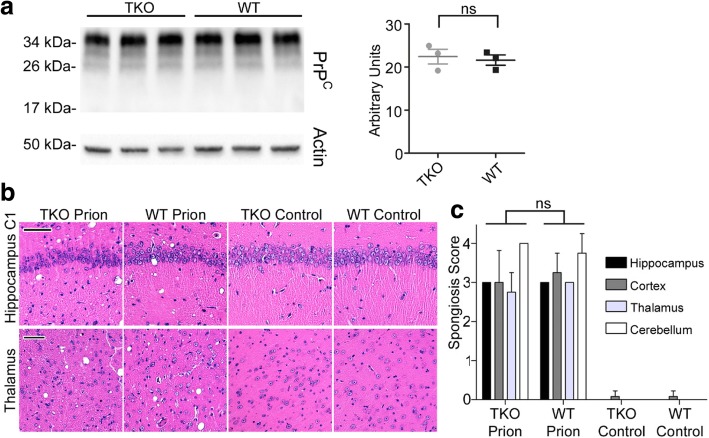
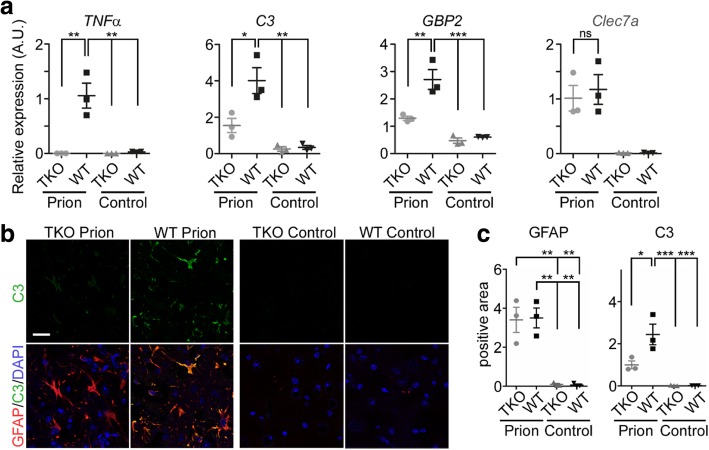
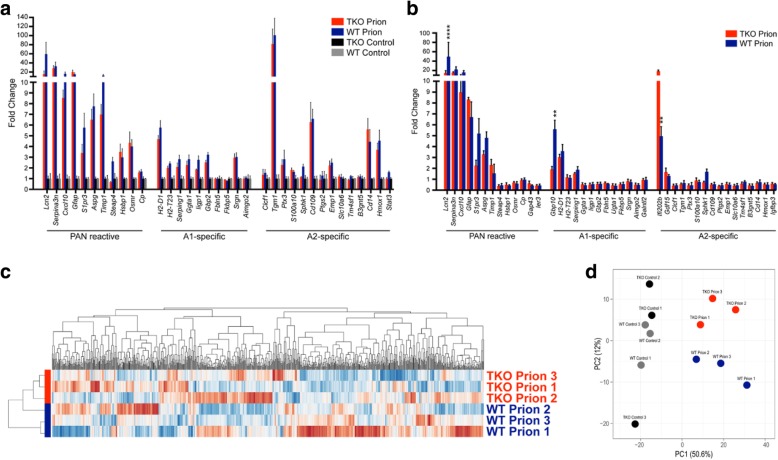
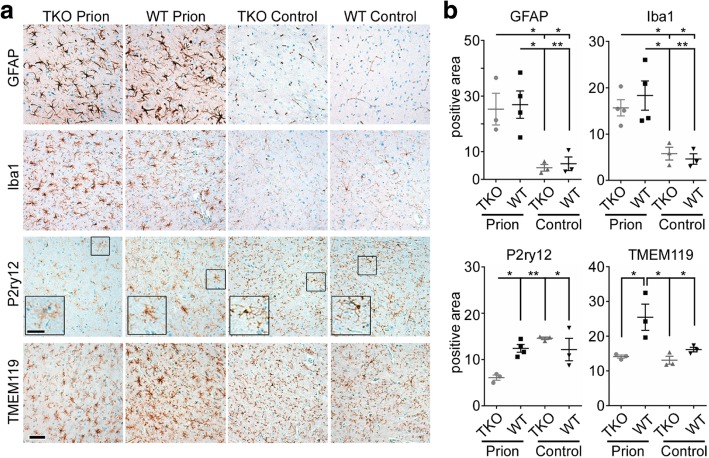
Astrogliosis and activation of microglia are hallmarks of prion diseases in humans and animals. Both were viewed to be rather independent events in disease pathophysiology, with proinflammatory microglia considered to be the potential neurotoxic species at late disease stages. Recent investigations have provided substantial evidence that a proinflammatory microglial cytokine cocktail containing TNF-α, IL-1α and C1qa reprograms a subset of astrocytes to change their expression profile and phenotype, thus becoming neurotoxic (designated as A1-astrocytes). Knockout or antibody blockage of the three cytokines abolish formation of A1-astrocytes, therefore, this pathway is of high therapeutic interest in neurodegenerative diseases. Since astrocyte polarization profiles have never been investigated in prion diseases, we performed several analyses and could show that C3+-PrPSc-reactive-astrocytes, which may represent a subtype of A1-astrocytes, are highly abundant in prion disease mouse models and human prion diseases. To investigate their impact on prion disease pathophysiology and to evaluate their potential therapeutic targeting, we infected TNF-α, IL-1α, and C1qa Triple-KO mice (TKO-mice), which do not transit astrocytes into A1, with prions. Although formation of C3+-astrocytes was significantly reduced in prion infected Triple-KO-mice, this did not affect the amount of PrPSc deposition or titers of infectious prions. Detailed characterization of the astrocyte activation signature in thalamus tissue showed that astrocytes in prion diseases are highly activated, showing a mixed phenotype that is distinct from other neurodegenerative diseases and were therefore termed C3+-PrPSc-reactive-astrocytes. Unexpectedly, Triple-KO led to a significant acceleration of prion disease course. While pan-astrocyte and -microglia marker upregulation was unchanged compared to WT-brains, microglial homeostatic markers were lost early in disease in TKO-mice, pointing towards important functions of different glia cell types in prion diseases.
Keywords: A1-astrocytes; Microglia; Neurotoxicity; Prion diseases.
Conflict of interest statement
The authors declare that they have no competing interests.
Figures
Similar articles
-
Microglia-specific NF-κB signaling is a critical regulator of prion-induced glial inflammation and neuronal loss.PLoS Pathog. 2025 Jun 18;21(6):e1012582. doi: 10.1371/journal.ppat.1012582. eCollection 2025 Jun. PLoS Pathog. 2025. PMID: 40532025 Free PMC article.
-
Flow Cytometric Detection of PrPSc in Neurons and Glial Cells from Prion-Infected Mouse Brains.J Virol. 2017 Dec 14;92(1):e01457-17. doi: 10.1128/JVI.01457-17. Print 2018 Jan 1. J Virol. 2017. PMID: 29046463 Free PMC article.
-
RNA-seq and network analysis reveal unique glial gene expression signatures during prion infection.Mol Brain. 2020 May 7;13(1):71. doi: 10.1186/s13041-020-00610-8. Mol Brain. 2020. PMID: 32381108 Free PMC article.
-
Neuroinflammation, Microglia, and Cell-Association during Prion Disease.Viruses. 2019 Jan 15;11(1):65. doi: 10.3390/v11010065. Viruses. 2019. PMID: 30650564 Free PMC article. Review.
-
Microglia in prion diseases.J Clin Invest. 2017 Sep 1;127(9):3230-3239. doi: 10.1172/JCI90605. Epub 2017 Jul 17. J Clin Invest. 2017. PMID: 28714865 Free PMC article. Review.
Cited by
-
Microglia-Astrocyte Communication in Alzheimer's Disease.J Alzheimers Dis. 2023;95(3):785-803. doi: 10.3233/JAD-230199. J Alzheimers Dis. 2023. PMID: 37638434 Free PMC article. Review.
-
Remodeling of astrocyte secretome in amyotrophic lateral sclerosis: uncovering novel targets to combat astrocyte-mediated toxicity.Transl Neurodegener. 2022 Dec 26;11(1):54. doi: 10.1186/s40035-022-00332-y. Transl Neurodegener. 2022. PMID: 36567359 Free PMC article. Review.
-
The Neurotropic Parasite Toxoplasma gondii Induces Astrocyte Polarization Through NFκB Pathway.Front Med (Lausanne). 2019 Nov 19;6:267. doi: 10.3389/fmed.2019.00267. eCollection 2019. Front Med (Lausanne). 2019. PMID: 31803748 Free PMC article.
-
Therapeutic Potential of Astrocyte Purinergic Signalling in Epilepsy and Multiple Sclerosis.Front Pharmacol. 2022 May 2;13:900337. doi: 10.3389/fphar.2022.900337. eCollection 2022. Front Pharmacol. 2022. PMID: 35586058 Free PMC article. Review.
-
MiR-30a-5p and miR-153-3p regulate LPS-induced neuroinflammatory response and neuronal apoptosis by targeting NeuroD1.BMB Rep. 2022 Sep;55(9):447-452. doi: 10.5483/BMBRep.2022.55.9.061. BMB Rep. 2022. PMID: 35651331 Free PMC article.
References
MeSH terms
Substances
Grants and funding
LinkOut - more resources
Full Text Sources
Molecular Biology Databases
Research Materials
Miscellaneous
