. 2019 Jul 1;218(7):2198-2214.
doi: 10.1083/jcb.201805155. Epub 2019 May 22.

PTEN reduces endosomal PtdIns(4,5)P2 in a phosphatase-independent manner via a PLC pathway

Affiliations

PTEN reduces endosomal PtdIns(4,5)P2 in a phosphatase-independent manner via a PLC pathway

Virginie E Mondin et al. J Cell Biol. .

Abstract

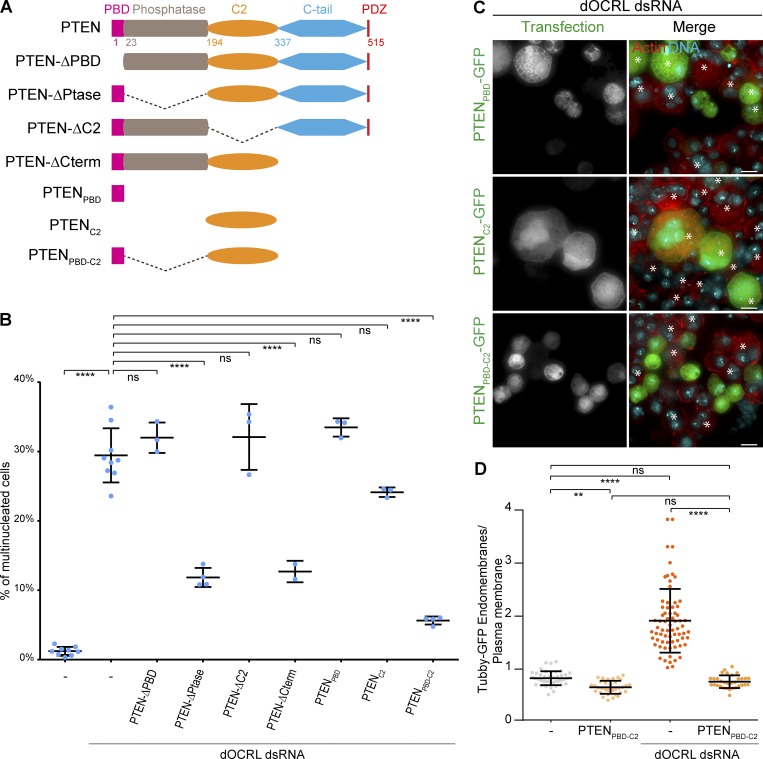
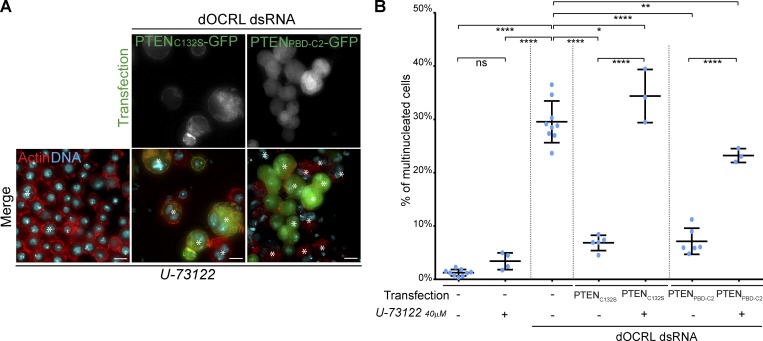
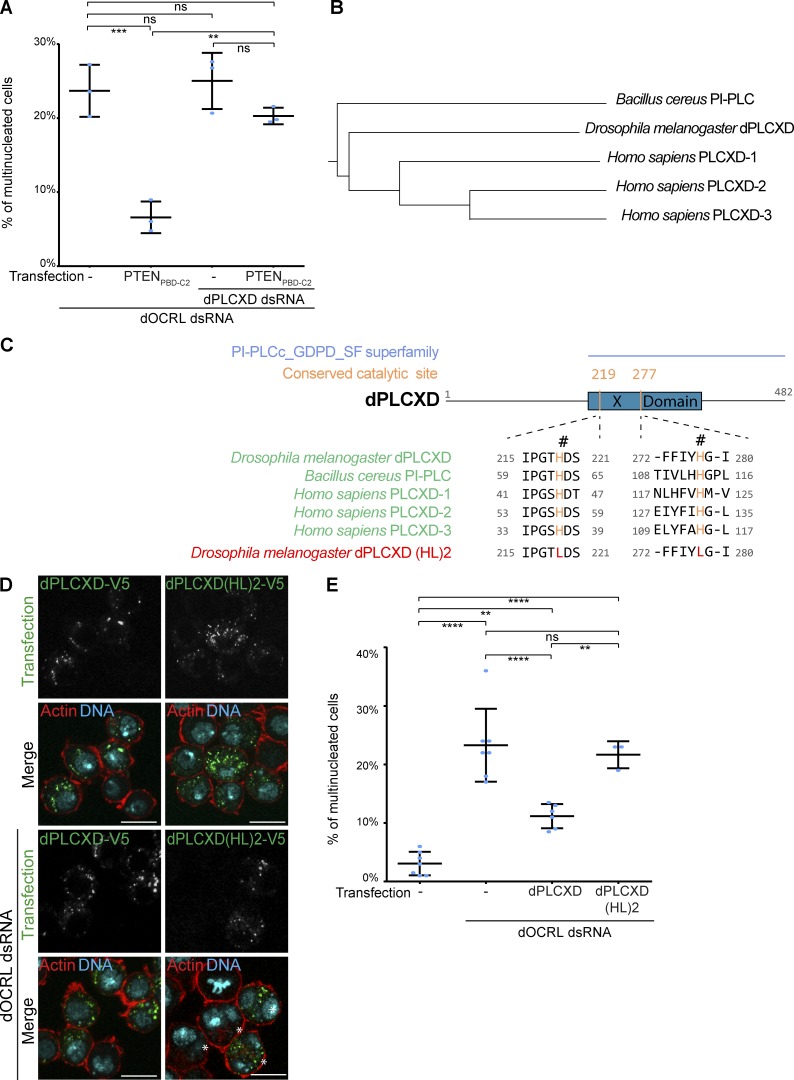
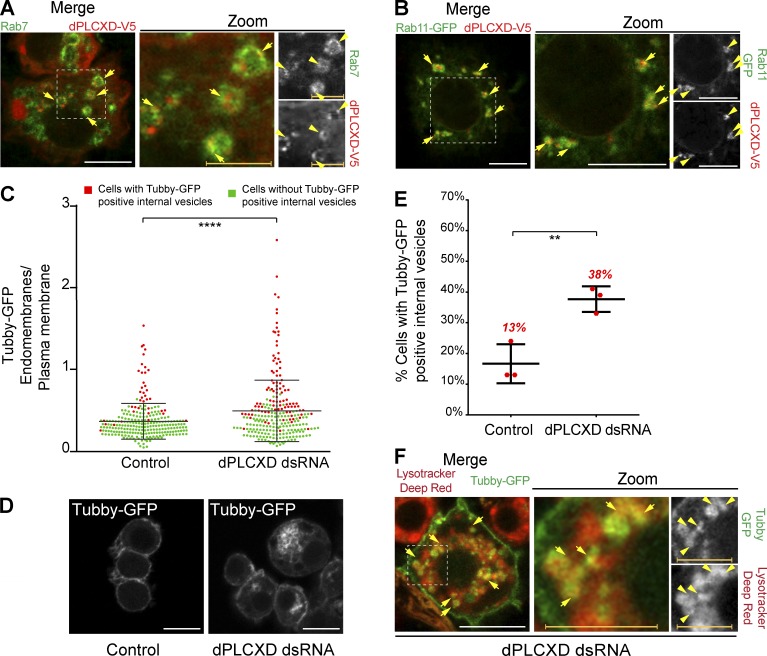
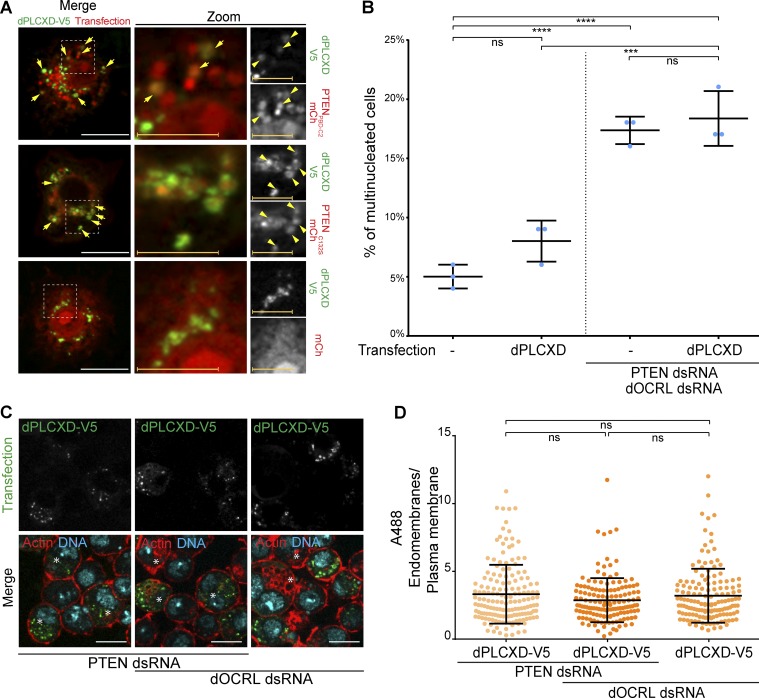
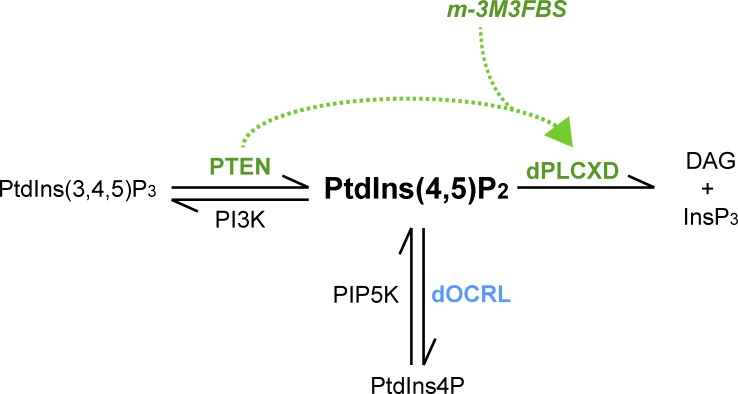
The tumor suppressor PTEN dephosphorylates PtdIns(3,4,5)P3 into PtdIns(4,5)P2 Here, we make the unexpected discovery that in Drosophila melanogaster PTEN reduces PtdIns(4,5)P2 levels on endosomes, independently of its phosphatase activity. This new PTEN function requires the enzymatic action of dPLCXD, an atypical phospholipase C. Importantly, we discovered that this novel PTEN/dPLCXD pathway can compensate for depletion of dOCRL, a PtdIns(4,5)P2 phosphatase. Mutation of OCRL1, the human orthologue of dOCRL, causes oculocerebrorenal Lowe syndrome, a rare multisystemic genetic disease. Both OCRL1 and dOCRL loss have been shown to promote accumulation of PtdIns(4,5)P2 on endosomes and cytokinesis defects. Here, we show that PTEN or dPLCXD overexpression prevents these defects. In addition, we found that chemical activation of this pathway restores normal cytokinesis in human Lowe syndrome cells and rescues OCRL phenotypes in a zebrafish Lowe syndrome model. Our findings identify a novel PTEN/dPLCXD pathway that controls PtdIns(4,5)P2 levels on endosomes. They also point to a potential new strategy for the treatment of Lowe syndrome.


Figures

Figure 1.
Figure 1.
PTEN overexpression prevents cytokinesis and PtdIns(4,5)P2 homeostasis defects in dOCRL-depleted cells. (A) A schematic depicting the PtdIns pathway. (B) S2 cells were treated or not with dOCRL dsRNA, transfected after 4 d, and labeled for F-actin (red) and DNA (blue) after 2 d of expression of the indicated constructs. Asterisks show multinucleated cells. (C) Percentage of multinucleated S2 cells following the different indicated treatments; blue dots show individual independent experiments with ≥300 cells/experiment (bars represent mean and SD). P values were calculated using one-way ANOVA, Tukey’s multiple comparisons test with a single pooled variance. (D) Tubby-GFP S2 cells were treated or not with dOCRL dsRNA. After 4 d of dsRNA treatment, cells were transfected with PTENC132S-mCherry (red). After two more days, cells were labeled for DNA (blue) and Tubby-GFP (anti-GFP antibody, green). (E) The ratio of Tubby-GFP fluorescence associated with endomembranes to that associated with the plasma membrane. P values were calculated using Kruskal–Wallis test and Dunn’s multiple comparisons test. n = 1, total number of cells >40. Dots represent the ratio for a single cell; bars represent mean and SD. Bars, 10 µm. **, P < 0.01; ****, P < 0.0001. ns, not significant.
Figure 2.
Figure 2.
The PTENPBD-C2 are necessary and sufficient to prevent the effects of dOCRL depletion. (A) A schematic depicting PTEN constructs. (B) Percentage of multinucleated S2 cells following the different indicated treatments; blue dots show individual independent experiment with ≥300 cells/experiment (bars represent mean and SD). Multinucleation levels of control and dOCRL-depleted cells were already shown in Fig. 1 B. P values were calculated using one-way ANOVA, Tukey’s multiple comparisons test with a single pooled variance. ns, not significant. (C) dOCRL dsRNA-depleted S2 cells were transfected after 4 d of dsRNA treatment and labeled for F-actin (red) and DNA (blue) after 2 d of expression of the indicated constructs. Asterisks show multinucleated cells. (D) The ratio of Tubby-GFP fluorescence associated with endomembranes to that associated with the plasma membrane. P values were calculated using Kruskal–Wallis test and Dunn’s mulitiple comparisons test. n = 1, total number of cells >40. Dots represent the ratio for a single cell; bars represent mean and SD. Bars, 10 µm. **, P < 0.01; ****, P < 0.0001. ns, not significant.
Figure 3.
Figure 3.
PTEN reduces PtdIns(4,5)P2 levels on endosomes. (A–C and G) Merged channels are shown in the left row, merged channels of the zoom are shown in the middle row, and corresponding black and white (BW) individual channels are shown in the right row. BW individual channels are displayed in Fig. S3, A–D. (A) S2 cells expressing mCherry (mCh) or PTENPBD-C2mCh or PTENC132SmCh (red) were immune-stained for Rab7 (A; green). Arrows show colocalization of the indicated proteins on endosomes. (B) S2 cells coexpressing mCh or PTENPBD-C2mCh or PTENC132SmCh (red) and GFP-Rab11 (green). Arrows show colocalization of the indicated proteins on endosomes. (C) S2 cells expressing mCh or PTENPBD-C2mCh or PTENC132SmCh (red) were incubated with LysoTracker Green (green). Arrows show acidic vesicles where PTEN constructs and LysoTracker colocalize. (D) The ratio of Tubby-GFP fluorescence associated with endomembranes to that associated with the plasma membrane (dots represent the ratio for a single cell; bars represent mean and SD). Green dots represent single cell without Tubby-GFP internal vesicles; red dots represent single cell with Tubby-GFP internal vesicles. P values were calculated using a Mann–Whitney U test. Pooled data, n = 3, total number of cells >160. (E) Tubby-GFP cells were treated (right) or not (left) with PTEN dsRNA. (F) Percentage of cells with Tubby-GFP internal vesicles in control and PTEN-depleted cells as depicted in D. P values were calculated using one-way ANOVA, Tukey’s multiple comparisons test with a single pooled variance. n = 3, total number of cells >160. (G) Tubby-GFP (green) cells were treated with PTEN dsRNA and were incubated with LysoTracker Deep Red (red). Arrows show acidic vesicles positive for the PtdIns(4,5)P2 biosensor Tubby-GFP. White bars, 10 µm; colored bars, 5 µm. *, P < 0.05; ***, P < 0.001.
Figure 4.
Figure 4.
A PLC is required downstream of PTEN to rescue dOCRL depletion. (A) Control cells (left row) or dOCRL dsRNA-treated S2 cells (two right rows) were transfected by the PTENC132S-GFP (middle row) or PTENPBD-C2 (left row) after 4 d of dsRNA treatment. Cells were concomitantly treated by 40 µm of the PLC inhibitor U-73122. Cells were labeled for F-actin (red) and DNA (blue) after 2 d of expression of the indicated constructs. Asterisks show multinucleated cells. (B) Percentage of multinucleated S2 cells following the different indicated treatments; blue dots show individual independent experiment with ≥300 cells/experiment (bars represent mean and SD). Multinucleation levels of control and dOCRL-depleted cells was shown in Fig. 1 B. P values were calculated using one-way ANOVA, Tukey’s multiple comparisons test with a single pooled variance. Bars, 10 µm. *, P < 0.05; **, P < 0.01; ****, P < 0.0001. ns, not significant.
Figure 5.
Figure 5.
dPLCXD acts downstream of PTEN to rescue dOCRL depletion. (A) Percentage of multinucleated S2 cells following the different indicated treatments; blue dots show individual independent experiment with ≥300 cells/experiment (bars represent mean and SD). P values were calculated using one-way ANOVA, Tukey’s multiple comparisons test with a single pooled variance. ns, not significant. (B) Evolutionary tree of PLCXDs from Drosophila melanogaster, Bacillus cereus, and Homo sapiens. (C) Top: Domain structure of dPLCXD with the identified “Catalytic domain of PtdIns-specific PLC-like phosphodiesterases superfamily” (PI-PLCc_GDPD_SF superfamily, light blue), the X domain (blue), and the two catalytic histidines (orange). Middle: Conservation of the two catalytic histidines (orange) among dPLCXDs. The last row shows mutations of the two catalytic histidines. NCBI conserved domain search site was used to confirm the two catalytic histidine site of dPLCXD. (D) S2 cells were treated (two bottom rows) or not (two upper rows) with dOCRL dsRNA and transfected with V5-tagged dPLCXD (left) or mutated V5 tagged dPLCXD (HL)2 (right). Cells were then labeled for F-actin (red) and DNA (blue); PLCXD constructs are shown in green. Asterisks show multinucleated cells. (E) Percentage of multinucleated S2 cells following the different indicated treatments; blue dots show individual independent experiment with ≥300 cells/experiment (bars represent mean and SD). P values were calculated using one-way ANOVA, Tukey’s multiple comparisons test with a single pooled variance. Bars, 10 µm. **, P < 0.01; ***, P < 0.001; ****, P < 0.0001. ns, not significant.
Figure 6.
Figure 6.
dPLCXD reduces PtdIns(4,5)P2 levels on endosomes. (A, B, and F) Merged channels are shown in the left row, merged channels of the zoom are shown in the middle row, and corresponding BW individual channels are shown in the right row. BW individual channels are displayed in Fig. S3, E–G. (A) S2 cells expressing dPLCXD-V5 were immunostained for V5 (red) and Rab7 (green). Arrows show colocalization of the indicated proteins on endosomes. (B) S2 cells coexpressing dPLCXD-V5 and GFP-Rab11 (green) were immunostained for V5 (red). Arrows show colocalization of the indicated proteins on endosomes. (C) The ratio of Tubby-GFP fluorescence associated with endomembranes to that associated with the plasma membrane (dots represent the ratio for a single cell, bars represent mean and SD). Green dots represent single cell without Tubby-GFP internal vesicles; red dots represent single cells with Tubby-GFP internal vesicles. P values (Mann–Whitney test) were calculated using a two-tailed, unpaired, and nonparametric Mann–Whitney test. Pooled data, n = 3, total number of cells >240. (D) Tubby-GFP cells were treated (right) or not (left) with dPLCXD dsRNA. (E) Percentage of cells with Tubby-GFP internal vesicles in control and dPLCXD-depleted cells as depicted in C. P values were calculated using unpaired and parametric ordinary one-way ANOVA, Tukey’s multiple comparisons test with a single pooled variance. n = 3. (F) Tubby-GFP (green) cells were treated with dPLCXD dsRNA and were incubated with LysoTracker Deep Red (red). Arrows show acidic vesicles positive for the PtdIns(4,5)P2 biosensor Tubby-GFP. White bars, 10 µm; colored bars, 5 µm. **, P < 0.01; ****, P < 0.0001.
Figure 7.
Figure 7.
PTEN acts through dPLCXD to rescue dOCRL depletion. (A) S2 cells coexpressing mCh or PTENPBD-C2mCh or PTENC132SmCh (red) and dPLCXD-V5, were immunostained for V5 (green). Arrows show vesicles where both indicated proteins localize. Merged channels are shown in the left row, merged channels of the zoom are shown in the middle row, and corresponding BW individual channels are shown in the right row. BW individual channels are displayed in Fig. S3 H. (B) Percentage of multinucleated S2 cells following the different indicated treatments; blue dots show individual independent experiments with ≥200 cells/experiment (bars represent mean and SD). P values were calculated using unpaired and parametric ordinary one-way ANOVA, Tukey’s multiple comparisons test with a single pooled variance. ns, not significant. (C) PTEN-depleted S2 cells (two left rows) and dOCRL-depleted cells (two right rows) were transfected with V5 tagged dPLCXD (green). Cells were then labeled for F-actin (red) and DNA (blue). Asterisks show multinucleated cells. (D) The ratio of dPLCXD-V5 fluorescence associated with endomembranes to that associated with the plasma membrane. P values were calculated using Kruskal–Wallis test and Dunn’s mulitiple comparisons test. Dots represent the ratio for a single cell, bars represent mean and SD. Pooled data, n = 3, total number of cells >140. White bars, 10 µm; colored bars, 5 µm. ***, P < 0.001; ****, P < 0.0001. ns, not significant.
Figure 8.
Figure 8.
Chemical activation of PLCs prevents dOCRL depletion in Drosophila, dependently of dPLCXD. (A) The ratio of Tubby-GFP fluorescence associated with endomembranes to that associated with the plasma membrane (dots represent the ratio for a single cell, bars represent mean and SD). P values were calculated using unpaired and nonparametric Kruskal–Wallis test and Dunn’s mulitiple comparisons test (pooled data, n = 3, total number of cells >190). ns, not significant. (B) Tubby-GFP control cells (upper panel) or Tubby-GFP dOCRL dsRNA-treated S2 cells (three bottom panels) were treated for 24 h with the PLC activator m-3M3FBS or its inactive analogue o-3M3FBS, both at 25 µM. (C) Control cells (upper panel) or dOCRL dsRNA-treated S2 cells (three bottom panels) were treated for 24 h with the PLC activator m-3M3FBS or its inactive analogue o-3M3FBS, both at 25 µM. Cells were labeled for F-actin (red) and DNA (blue). (D–F) Percentage of multinucleated S2 cells following the indicated treatments; blue dots show individual independent experiments with ≥300 cells/experiment (bars represent mean and SD). P values were calculated using unpaired and parametric ordinary one-way ANOVA, Tukey’s multiple comparisons test with a single pooled variance. Bars, 10 µm. *, P < 0.05; ***, P < 0.001; ****, P < 0.0001. ns, not significant.
Figure 9.
Figure 9.
Model for regulation of PtdIns(4,5)P2 homeostasis on endosomes. In Drosophila, PTEN, independently of its enzymatic activity, requires PLCXD to hydrolyze PtdIns(4,5)P2. This pathway can be chemically activated by m-3M3FBS to rescue OCRL loss independently of PTEN but dependently of dPLCXD.
Figure 10.
Figure 10.
Chemical activation of PLC rescues OCRL phenotypes in Lowe syndrome patient cells and a zebrafish Lowe syndrome model. (A) Normal renal epithelial cells from a donor not mutated in OCRL and renal epithelial cells from a Lowe syndrome patient were treated with the PLC activator m-3M3FBS or its inactive analogue o-3M3FBS. Cell divisions were recorded by time-lapse microscopy. The curves represent the distribution of the abscission times in the indicated cell populations. (B) Mean abscission times were measured on time-lapse videos in the normal and Lowe renal epithelial cells treated with the PLC activator m-3M3FBS or its inactive analogue o-3M3FBS. ns, not significant. (C) Confocal images of pronephric tubules (indicated by a dashed line) in WT and Ocrl−/− zebrafish mutant embryos. The indicated embryos were injected with Alexa Fluor 488–10-kD dextran (green) and treated with the PLC activator m-3M3FBS or its inactive analogue o-3M3FBS. P values were calculated using paired and parametric Student’s t test, n = 3. (D) Pronephric accumulation in the indicated embryos was monitored by fluorescence microscopy. P values were calculated using a Pearson’s χ2 test. Bars, 10 µm. *, P < 0.05; **, P < 0.01; ****, P < 0.0001.

Comment in

References

    1. Bae Y.S., Lee T.G., Park J.C., Hur J.H., Kim Y., Heo K., Kwak J.Y., Suh P.G., and Ryu S.H.. 2003. Identification of a compound that directly stimulates phospholipase C activity. Mol. Pharmacol. 63:1043–1050. 10.1124/mol.63.5.1043 - DOI - PubMed
    1. Balla T. 2013. Phosphoinositides: tiny lipids with giant impact on cell regulation. Physiol. Rev. 93:1019–1137. 10.1152/physrev.00028.2012 - DOI - PMC - PubMed
    1. Ben El Kadhi K., Roubinet C., Solinet S., Emery G., and Carréno S.. 2011. The inositol 5-phosphatase dOCRL controls PI(4,5)P2 homeostasis and is necessary for cytokinesis. Curr. Biol. 21:1074–1079. 10.1016/j.cub.2011.05.030 - DOI - PubMed
    1. Ben El Kadhi K., Emery G., and Carreno S.. 2012. The unexpected role of Drosophila OCRL during cytokinesis. Commun. Integr. Biol. 5:291–293. 10.4161/cib.19914 - DOI - PMC - PubMed
    1. Benes C.H., Wu N., Elia A.E., Dharia T., Cantley L.C., and Soltoff S.P.. 2005. The C2 domain of PKCdelta is a phosphotyrosine binding domain. Cell. 121:271–280. 10.1016/j.cell.2005.02.019 - DOI - PubMed

Publication types

MeSH terms

Substances

Grants and funding