. 2019 May 22;10(1):2267.
doi: 10.1038/s41467-019-09929-w.

The K219T-Lamin mutation induces conduction defects through epigenetic inhibition of SCN5A in human cardiac laminopathy

Affiliations

The K219T-Lamin mutation induces conduction defects through epigenetic inhibition of SCN5A in human cardiac laminopathy

Nicolò Salvarani et al. Nat Commun. .

Abstract

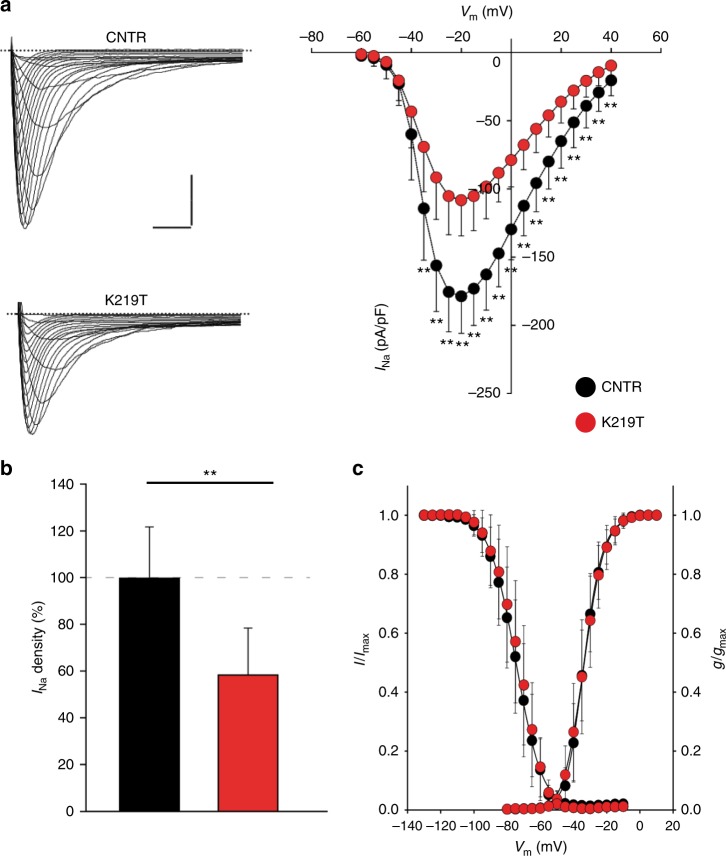
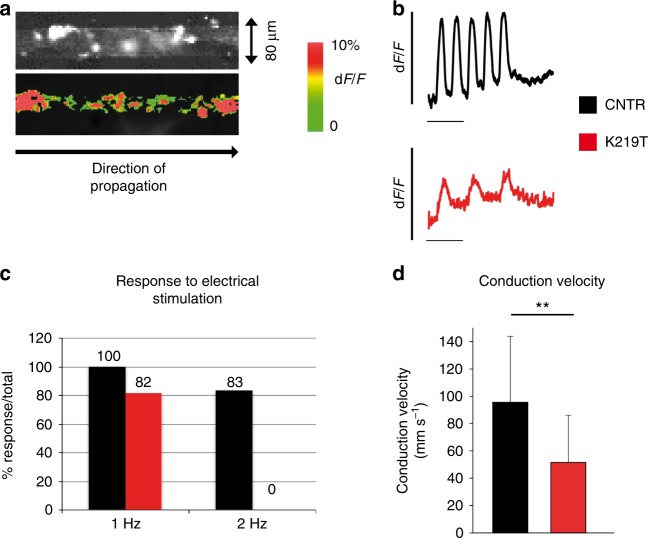
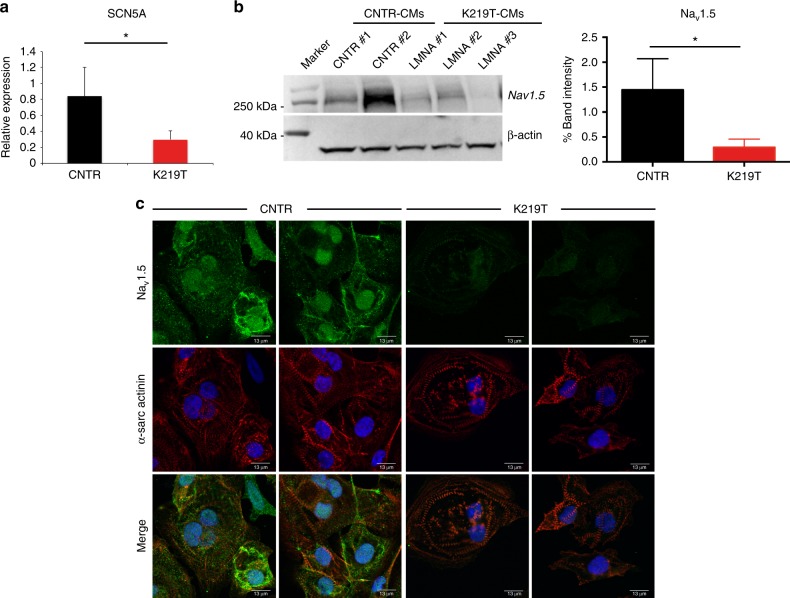
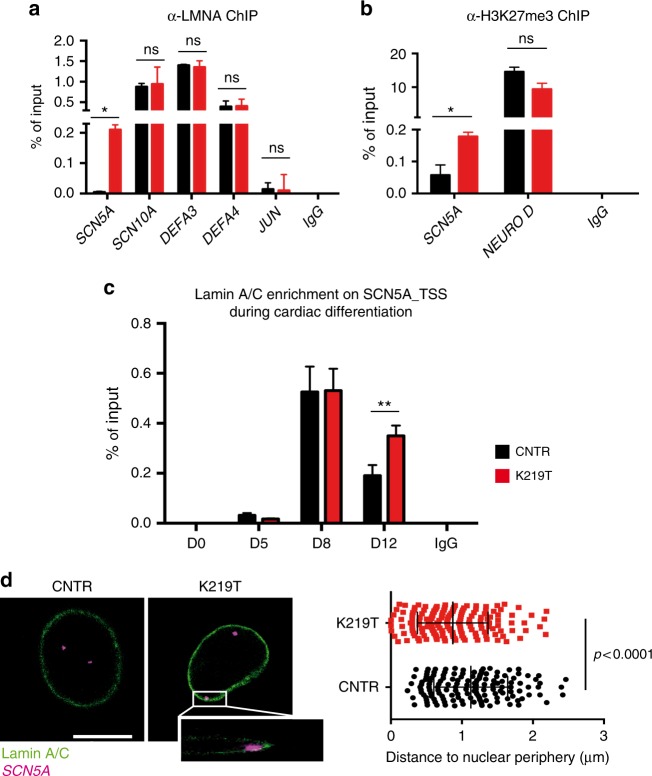
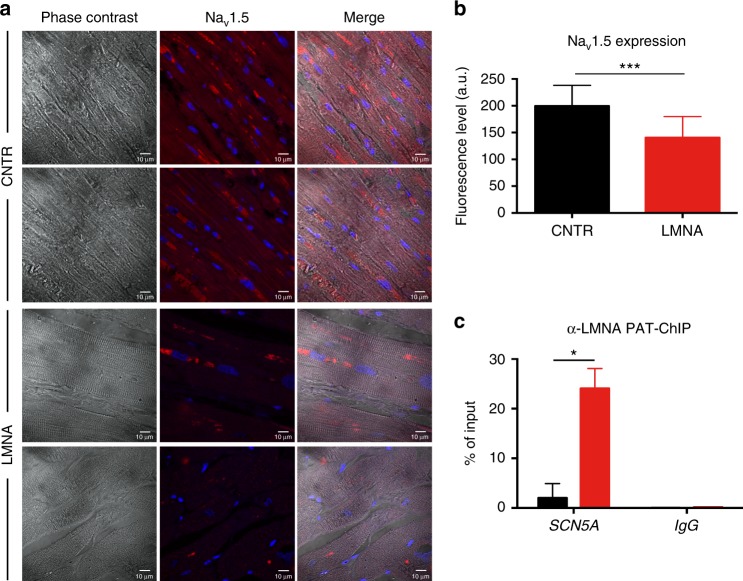
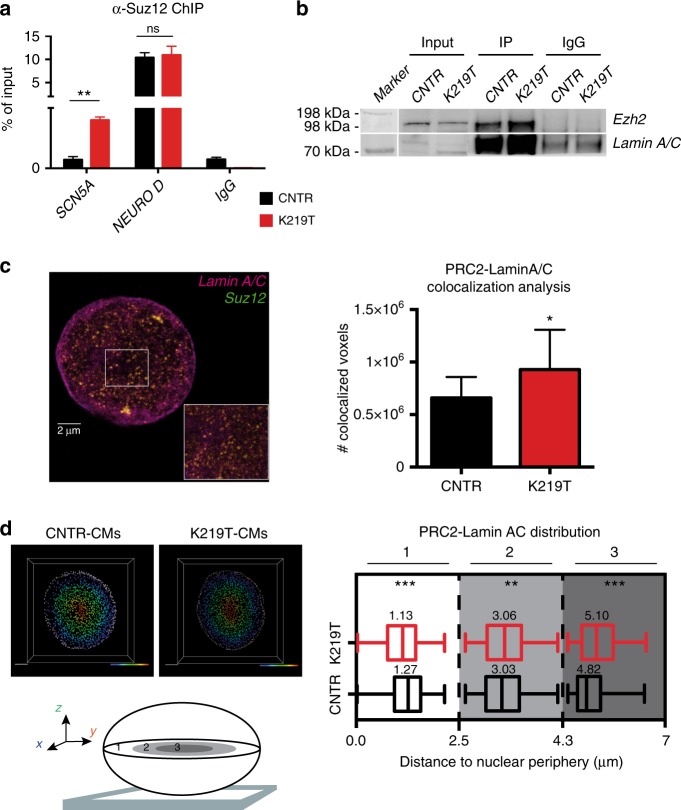
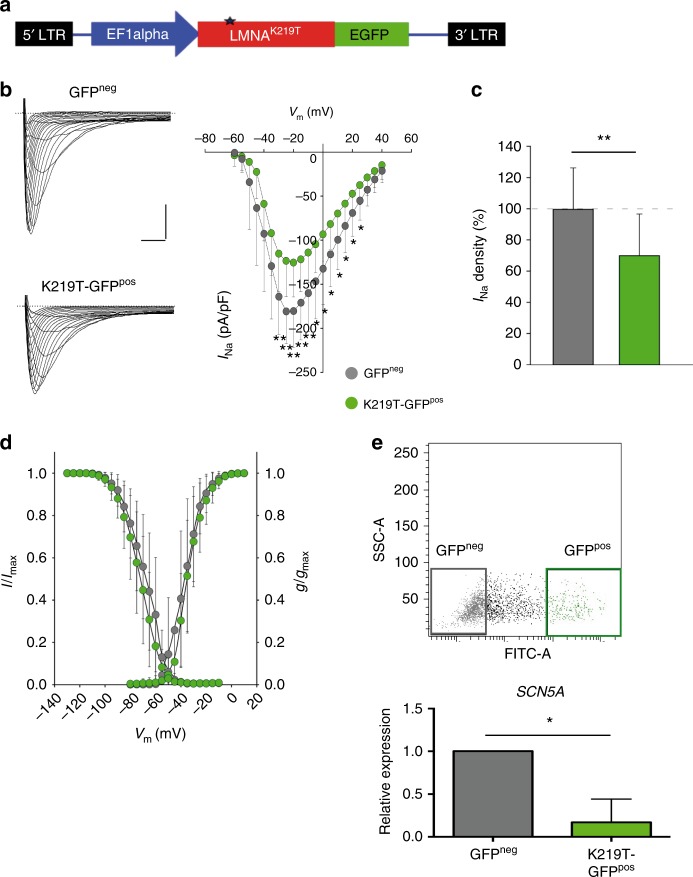
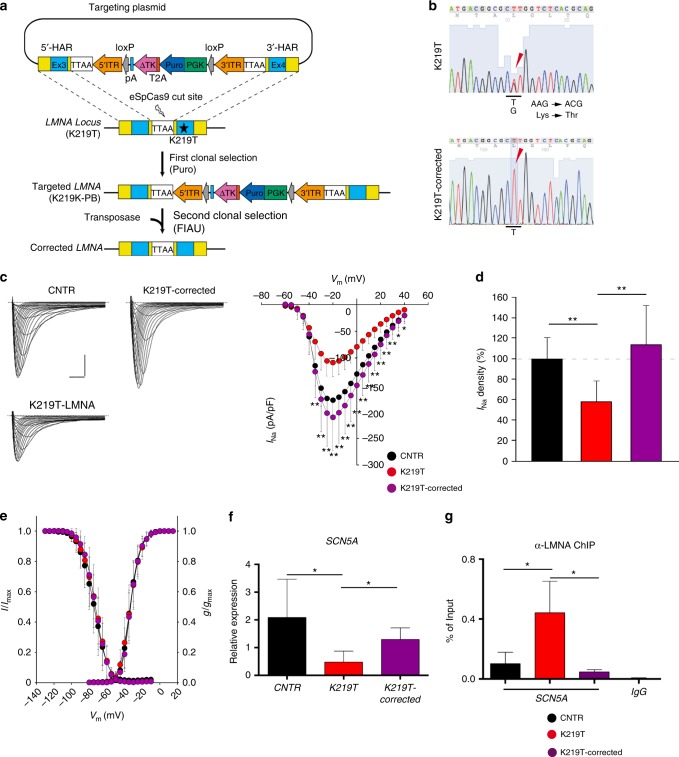
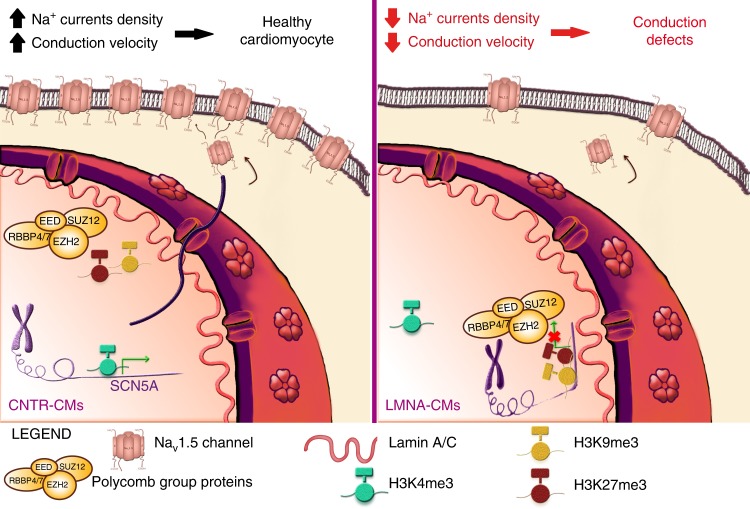
Mutations in LMNA, which encodes the nuclear proteins Lamin A/C, can cause cardiomyopathy and conduction disorders. Here, we employ induced pluripotent stem cells (iPSCs) generated from human cells carrying heterozygous K219T mutation on LMNA to develop a disease model. Cardiomyocytes differentiated from these iPSCs, and which thus carry K219T-LMNA, have altered action potential, reduced peak sodium current and diminished conduction velocity. Moreover, they have significantly downregulated Nav1.5 channel expression and increased binding of Lamin A/C to the promoter of SCN5A, the channel's gene. Coherently, binding of the Polycomb Repressive Complex 2 (PRC2) protein SUZ12 and deposition of the repressive histone mark H3K27me3 are increased at SCN5A. CRISPR/Cas9-mediated correction of the mutation re-establishes sodium current density and SCN5A expression. Thus, K219T-LMNA cooperates with PRC2 in downregulating SCN5A, leading to decreased sodium current density and slower conduction velocity. This mechanism may underlie the conduction abnormalities associated with LMNA-cardiomyopathy.


Conflict of interest statement

The authors declare no competing interests.

Figures

Fig. 1
Fig. 1
Electrophysiological properties of single iPSC-CMs. a Examples of spontaneous action potentials recorded in CNTR-CMs and K219T-CMs (scale bar, 1 sec). b Dot plot with maximal diastolic potential (MDP) data recorded from CNTR-CMs and K219T-CMs, relative to all iPSC-CMs (quiescent and spontaneously active cells: −61.3 ± 7.4 mV vs. −56.8 ± 9.6 mV—left panel) or to the spontaneously active cell population only (right panel), showing a significant depolarization of K219T-CMs vs. CNTR-CMs in the first condition. CNTR-CMs: n = 45; K219T-CMs: n = 46. c, d Patch clamp analysis of AP properties in spontaneously active iPSC-CMs. (CNTR: n = 33; K219T: n = 24). Dot plots for the main excitability features measured from spontaneous action potentials: maximal upstroke velocity (dV/dtmax), overshoot (OV), action potential amplitude (APA) and action potential duration at 90% repolarization (APD90) are shown in c. Representative spontaneous action potentials (left; scale bar, 100 ms) and dV/dt (right; scale bar, 1 ms) in d (CNTR: dV/dtmax = 18.4 ± 9.7 Vs−1, n = 33; overshoot = 22.6 ± 11.2 mV, n = 33; APA = 86.4 ± 15.2 mV, n = 33. K219T-CMs: dV/dtmax = 11.8 ± 9.2 V s−1, n = 24; overshoot = 12.3 ± 11.6 mV, n = 24; APA = 74.2 ± 16.1 mV, n = 24). e, f Patch clamp analysis of AP properties in iPSC-CMs electrically adjusted to −82 mV (evoked APs-CNTR: n = 45; K219T: n = 46). Dot plots for the main excitability features measured from evoked action potentials: maximal upstroke velocity (dV/dtmax), overshoot (OV), action potential amplitude (APA) and action potential duration at 90% repolarization (APD90) are shown in e. Representative evoked action potentials (left; scale bar, 100 ms) and dV/dt (right; scale bar, 2 ms) in f. Measurements highlighted with blue symbols in c and e were obtained from action potentials shown in d and f. All values are reported as mean ± SD. *p < 0.05; **p < 0.005 (unpaired t-test). Data are relative to CMs differentiated from 2 lines from each subjects (2 CNTR and 3 K219T-LMNA)
Fig. 2
Fig. 2
Voltage-gated sodium currents in CMs from K219T-iPSC lines. a Left panel: examples of Na+ current (INa) traces recorded in CNTR- (top) and K219T- (bottom) CMs (Scale bar, 2 ms, 50 pA/pF). Right panel: I-V curves constructed from average peak sodium current density as a function of voltage command measured in CNTR-CMs and K219T-CMs, showing a significant reduction in the latter. CNTR-CMs: n = 23; K219T-CMs: n = 22. b INa density, measured at −30 mV, in K219T-CMs (91.58 ± 30.69 pA/pF) relative to CNTR-CMs (156.12 ± 33.73 pA/pF), expressed as a percentage. c Voltage dependences: steady state activation (CNTR-CMs: n = 23; K219T-CMs: n = 22)/inactivation curves (CNTR-CMs: n = 18; K219T-CMs: n = 17). All values are reported as mean ± SD. **p < 0.005 (unpaired t-test). Data are relative to CMs differentiated from 2 independent lines from 2 CNTR and 3 K219T-LMNA subjects
Fig. 3
Fig. 3
Generation and propagation of optical action potentials in K219T-CMs. a Representative images of a monolayer of iPSC-CMs in geometrically defined strands (80-µm wide, 1-cm long). Top: example of phase contrast image of a portion of a strand observed from the field of view; Bottom: same strand after complete activation following electrical stimulation. Strands were stimulated from the left-hand side. b Stimulated optical action potentials in a monolayer of CNTR- (top, black) and K219T- (bottom, red) CMs, showing that the latter fail to respond to a stimulation of 2 Hz. c Percentage of propagated action potentials at 1 and 2 Hz stimulation. Black: CNTR-CMs; Red: K219T-CMs. d Conduction velocities recorded in cell strands consisting of CNTR- (black bar) and K219T- (red bar) CMs (95.9 ± 48.5 mm s−1, n = 47 vs. 51.7 ± 34.7 mm s−1, n = 40). All values are reported as mean ± SD. **p < 0.005 (unpaired t-test). Data are relative to CMs differentiated from 2 independent lines from 2 CNTR and 3 K219T-LMNA subjects
Fig. 4
Fig. 4
Reduced sodium current density is dependent upon reduction of SCN5A expression. a RT-qPCR showing reduced expression of SCN5A gene in CMs generated from K219T-LMNA-iPSCs vs those differentiated from CNTR lines. Data are represented relative to CNTR-CMs and normalized for expression of the housekeeping genes 18S and HGPRT. Data are relative to CMs differentiated from 2 independent lines from 2 CNTR and 3 K219T-LMNA subjects. b Left: Representative Western blot showing reduced Nav1.5 channel expression in K219T-CMs. Data are representative of one cell line per subject. Right: Nav1.5 expression quantification in CNTR-CMs and K219T-CMs, calculated as densitometric Nav1.5 /β-actin ratio (the diagram represents the mean of three independent experiments). c Representative immunofluorescence images for Nav1.5 (green) and α-sarcomeric actinin (red) in CNTR-CMs and K219T-CMs; nuclei are stained with DAPI (Scale bars: 13 μm). A decrease in the expression of Nav1.5 in K219T-CMs vs. CNTR-CMs is evident. All values are reported as mean ± SD. *p < 0.05 (unpaired t-test)
Fig. 5
Fig. 5
Epigenetic modulation of SCN5A gene expression. a, b ChIP analyses in CNTR-CMs and K219T-CMs with antibodies against Lamin A/C (a) and H3K27me3 (b) targeting the SCN5A genomic region. Data are presented as a percentage of input chromatin precipitated and relative to 2 independent iPSC clones from each subject. ChIP for Lamin A/C, indicating increased binding of Lamin A/C to the promoter region of the SCN5A gene in K219T-CMs; no enrichment was detectable for JUN, used as a negative control region for the ChIP experiment; SCN10A, DEFA3, and DEFA4 were used as positive control regions for the ChIP experiments, and they show comparable enrichment of Lamin A/C in CNTR-CMs and K219T-CMs (a). ChIP for the histone modification H3K27me3, showing an enrichment of the repressive histone mark at the SCN5A gene promoter in K219T-CMs, supporting the reduced expression of the gene detected in these cells; NEURO D was used as positive control region for the antibody (b). c ChIP against Lamin A/C, showing the dynamics of Lamin A/C enrichment at the transcription start site (TSS) of SCN5A during cardiac differentiation (from days 0 to 12). The graph is relative to one representative experiment (out of three). For this analysis, two-way ANOVA was used for the statistic test. **p < 0.01. d 3D-FISH for Lamin A/C (green) and SCN5A (magenta) conducted with an antibody and a DNA probe, respectively. Left: representative images of nuclei from CNTR and K219T-CM preparations (Scale bar: 9 μm). Magnified box shows the colocalization of the SCN5A probe at the nuclear lamina. Right: Analysis of the distance from the nuclear lamina, showing preferential localization of the SCN5A probe (magenta) at the nuclear periphery in K219T-CMs vs. CNTR. Quantification was carried out using a specific plug-in of the ImageJ software (CNTR-CMs: n = 72 cells; K219T-CMs: n = 82 cells; p < 0.0001). All values are reported as means ± SD, if not differently specified. *p < 0.05; **p < 0.01, ns, not significant (unpaired t-test)
Fig. 6
Fig. 6
Lamin A/C-mediated reduction of Nav1.5 expression is confirmed in heart sections. a Immunostaining of paraffin-embedded heart sections from patients carrying the K219T mutation on Lamin A/C (bottom panels) and from two control subjects (top panels) targeting the Nav1.5 sodium channel (red); nuclei were stained with DAPI (scale bars: 10 μm). b Histogram showing the quantification of the red fluorescent signal shown in a, corresponding to the Nav1.5 protein, confirming reduced expression also in K219T-LMNA patient hearts. (a.u. is for arbitrary units). Data are relative to heart sections from three healthy controls (n = 11) and four mutant samples (n = 12). c PAT-ChIP analysis of heart sections from patients carrying the K219T mutation on LMNA (red bar) and from two control subjects (black bar), showing increased binding of Lamin A/C at the SCN5A promoter region in K219T-CMs. Chromatin was immunoprecipitated with an antibody against Lamin A/C and the resulting DNA was analysed by realtime PCR and presented as a percentage of input chromatin precipitated for the indicated region. All values are reported as means ± SD. *p < 0.05; ***p < 0.0001 (unpaired t-test)
Fig. 7
Fig. 7
Lamin A/C–PRC2 interplay in the regulation of SCN5A transcription. a ChIP against Suz12, showing enrichment at the SCN5A promoter region in K219T-CMs. No significant differences were detectable at the NEURO D promoter, used as positive control for the antibody. Data are presented as percentage of input chromatin precipitated and relative to 2 independent iPSC lines per subject. (**p < 0.01, unpaired t-test). b Co-immunoprecipitation (co-IP) of LaminA/C and Ezh2 (PRC2 subunit) in CNTR-CMs and K219T-CMs, showing a higher binding affinity of mutant LaminA/C for Ezh2. An unrelated IgG antibody was used as negative control. One representative (out of three) experiment is shown. c 3D-STED super-resolution microscopy for Lamin A/C and Suz12. Left: representative image of a nucleus stained for the two proteins. The inset shows co-localization of the two proteins (yellow spots). Right: bar graph indicating the quantification of voxels of colocalization and showing higher levels of interaction in K219T-CMs vs. CNTR-CMs. (n = 16 cells for each condition). (*p < 0.05, unpaired t-test). d Distribution profile of the PRC2–Lamin A/C colocalization channel from 3D-STED microscopy acquisitions. For the analysis, the distance transformation function of Imaris software was applied to the z-stack images. Left: Strategy to determine the distance of the PRC2–Lamin A/C colocalization signal from the nuclear periphery. Top left: representative images of CNTR-CM and K219T-CM nuclei (scale bar 2 μm). Gray spots indicate Lamin A/C fluorescent signal: this was selected as the outside ring and served as the nuclear edge. The colored bar is indicative of the relative position of the spots to the nuclear edge: farthest positions in violet, closest in red. Bottom left: strategy of data representation: distances were scored into three zones: (1) periphery (from 0 to 2.15 μm, white); (2) middle (from 2.15 to 4.3 μm, light gray); and (3) central zone (from 4.3 to 6.45 μm, dark gray). The distance of every single colocalization spot was calculated from the nuclear edge. Right: box plot graphs representing PRC2–Lamin A/C distribution in the three selected zones. For each box plot, bottom and top of the boxes respectively indicate the lower and upper quartiles of the data set and whiskers represent the highest and the lowest values. Center line is the median value. Values are referred to median ± SD (n = 5 cells per condition, obtained from 5 independent iPSC clones). (***p < 0.0001; **p < 0.01, two-way ANOVA)
Fig. 8
Fig. 8
K219T-LMNA overexpression in RUES2-CMs reproduces phenotypes of K219T-CMs. a Lentiviral vector expressing the C-terminal GFP-tagged K219T-Lamin A/C used for lentiviral particle production. b Analysis of sodium current (INa) densities in CMs differentiated from the human embryonic stem cell line RUES2 and transduced with lentiviral particles expressing K219T-LaminA/C-GFP. Left column: examples of INa traces recorded in GFPneg (top) and GFPpos CMs (bottom) (Scale bar, 2 ms, 50 pA/pF). Right panel: I-V curves constructed from average peak sodium current density as a function of voltage command measured in GFPneg and GFPpos CMs. (GFPneg: n = 14; GFPpos: n = 21), showing significant Na+ current reductions in GFPpos cells. c INa density, measured at −30 mV, in GFPpos (115.20 ± 43.35 pA/pF) vs. GFPneg (164.02 ± 43.18 pA/pF) CMs, expressed as a percentage. d Voltage dependences: steady state activation (GFPneg: n = 14; GFPpos: n = 21)/inactivation (GFPneg: n = 11; GFPpos: n = 17) curves. e RT-qPCR comparing SCN5A expression in GFPneg and GFPpos CMs isolated through FACS sorting. Data are represented relative to GFPneg samples and normalized to expression of HGPRT and 18S housekeeping genes. Top: gating strategy and cell populations selected for the sorting are shown (sequential sorting strategy is provided in the Supplementary Fig. 15). All values are reported as mean ± SD. *p < 0.05; **p < 0.005 (unpaired t-test)
Fig. 9
Fig. 9
Correction of K219T mutation rescues Na+ current phenotype and SCN5A expression. a Gene editing strategy used for the correction of the mutation. b Representative electropherograms from DNA sequencing of exon 4 of the LMNA gene showing the correction of the alanine-to-cytosine transversion at position 656 (c.656A<C) in the generated isogenic K219T-corrected iPSC lines (the reverse sequence is shown in the figure; the T<C mutation is indicated by the arrow). The nucleotide mutation corresponds to the amino acid change p.K219T. The electropherogram from the parental K219T-LMNA iPSC line is shown on the top panel as reference. c Left panel: examples of Na+ current (INa) traces recorded in CNTR- (top), K219T-corrected (top) and K219T- (bottom) CMs (Scale bar, 2 ms, 50 pA/pF). Right panel: I-V curves constructed from average peak sodium current density as a function of voltage command measured in the three conditions described above (CNTR: n = 23; K219T-corrected: n = 14; K219T: n = 22), showing significant sodium current increases in K219T-corrected cells with respect to the parental mutant CMs. *adj.p < 0.05; **adj.p < 0.005 (two-way ANOVA). d INa density, measured at −30 mV, in K219T-corrected CMs (176.94 ± 61.05 pA/pF) relative to K219T-CMs (91.58 ± 30.69 pA/pF) and CNTR-CMs (156.12 ± 33.73 pA/pF) expressed as a percentage. e Voltage dependences: steady state activation (CNTR: n = 23; K219T-corrected: n = 14; K219T: n = 22)/inactivation (CNTR: n = 18; K219T-corrected: n = 12; K219T: n = 17) curves. f RT-qPCR showing that SCN5A gene expression is restored to control levels in CMs generated from K219T-corrected-iPSCs. Data are represented relative to CNTR-CMs and normalized to expression of the housekeeping genes 18S and HGPRT. g ChIP against Lamin A/C, showing loss of Lamin A/C binding at the SCN5A promoter region in K219T-corrected CMs vs mutant K219T-CMs. Levels of Lamin A/C binding are instead indistinguishable from those detected in CMs differentiated from control cells. All values are reported as means ± SD. *adj.p < 0.05; **adj.p < 0.005 (one-way ANOVA), unless otherwise specified
Fig. 10
Fig. 10
Proposed pathogenic mechanism of action of K219T-Lamin A/C in CMs. Left: healthy CMs. The SCN5A genomic region is localized in the nuclear interior and actively transcribed; the Nav1.5 sodium channel density at the plasma membrane is sufficient to assure proper impulse propagation. Right: Laminopathic CMs. Mutant Lamin A/C and PRC2 bind each other with high affinity and are enriched at the SCN5A promoter region, where the H3K27me3 (catalyzed by PRC2) and H3K9me3 repressive histone marks are also present. In this repressive environment, this genomic region is preferentially sequestered at the nuclear periphery. As a result, SCN5A gene transcription is repressed, leading to reduced expression of the Nav1.5 sodium channel at the plasma membrane, which, in turn, has an effect on reducing conduction velocity. This regulatory mechanism may be at the basis of the onset of the conduction defects in patients with LMNA-CMP

References

    1. Cattin ME, Muchir A, Bonne G. ‘State-of-the-heart’ of cardiac laminopathies. Curr. Opin. Cardiol. 2013;28:297–304. doi: 10.1097/HCO.0b013e32835f0c79. - DOI - PubMed
    1. Dechat T, et al. Nuclear lamins: major factors in the structural organization and function of the nucleus and chromatin. Genes Dev. 2008;22:832–853. doi: 10.1101/gad.1652708. - DOI - PMC - PubMed
    1. Hershberger RE, Hedges DJ, Morales A. Dilated cardiomyopathy: the complexity of a diverse genetic architecture. Nat. Rev. Cardiol. 2013;10:531–547. doi: 10.1038/nrcardio.2013.105. - DOI - PubMed
    1. Rankin J, Ellard S. The laminopathies: a clinical review. Clin. Genet. 2006;70:261–274. doi: 10.1111/j.1399-0004.2006.00677.x. - DOI - PubMed
    1. Worman HJ, Bonne G. “Laminopathies”: a wide spectrum of human diseases. Exp. Cell Res. 2007;313:2121–2133. doi: 10.1016/j.yexcr.2007.03.028. - DOI - PMC - PubMed

Publication types

MeSH terms