. 2019 May 22;10(1):2274.
doi: 10.1038/s41467-019-10113-3.

Form vision from melanopsin in humans

Affiliations

Form vision from melanopsin in humans

Annette E Allen et al. Nat Commun. .

Abstract

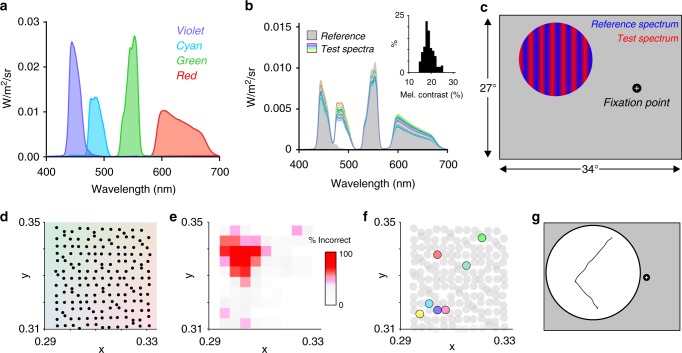
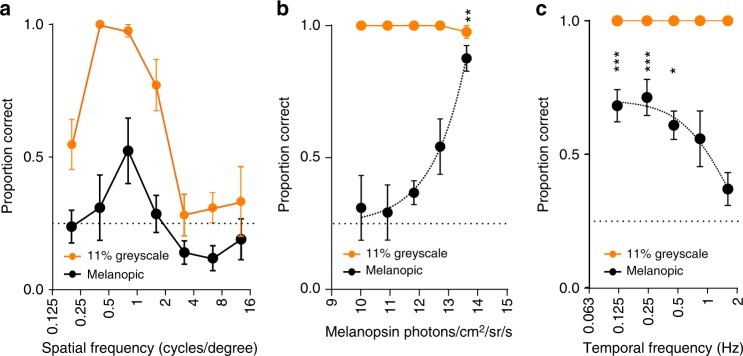
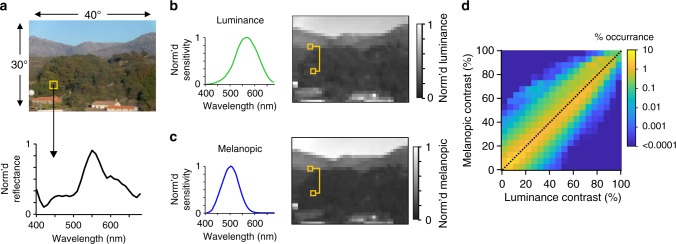
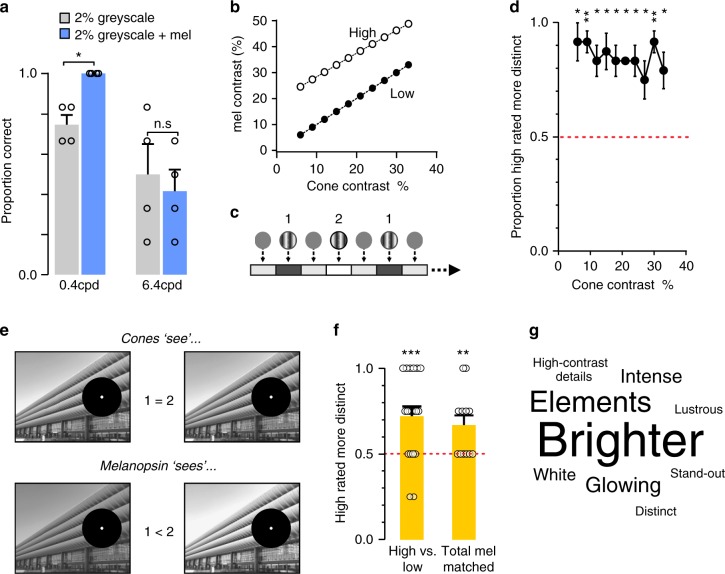
Detection and discrimination of spatial patterns is thought to originate with photoreception by rods and cones. Here, we investigated whether the inner-retinal photoreceptor melanopsin could represent a third origin for form vision. We developed a 4-primary visual display capable of presenting patterns differing in contrast for melanopsin vs cones, and generated spectrally distinct stimuli that were indistinguishable for cones (metamers) but presented contrast for melanopsin. Healthy observers could detect sinusoidal gratings formed by these metamers when presented in the peripheral retina at low spatial (≤0.8 cpd) and temporal (≤0.45 Hz) frequencies, and Michelson contrasts ≥14% for melanopsin. Metameric gratings became invisible at lower light levels (<1013 melanopsin photons cm-2 sr-1 s-1) when rods are more active. The addition of metameric increases in melanopsin contrast altered appearance of greyscale representations of coarse gratings and a range of everyday images. These data identify melanopsin as a new potential origin for aspects of spatial vision in humans.


Conflict of interest statement

A.E.A. and R.J.L. are listed as inventors on patent PCT/GB2017/050338: ‘Improvements in image formation’. F.P.M. declares no competing interests.

Figures

Fig. 1
Fig. 1
Psychophysical paradigm and online-tuning procedure used to identify metameric stimuli. a Spectral power distributions of the four primaries (violet, cyan, green and red). b Spectral power distributions of reference (grey) and test stimuli (coloured lines, lower panel) used to identify a metameric stimulus for each participant. Inset histogram plots the range of measured melanopsin contrasts between all reference and test spectra. c Diagram of stimulus presentation. Stimuli were presented on a projection screen occupying 27 × 34° of visual space. All participants were instructed to fixate on a cross with their left eye; all stimuli were presented within a circle (15° diameter), with centre located 20° from fixation point (6.5° above horizon; 19° in temporal direction). Sinusoidal gratings formed by mixing reference and test spectra in different ratios were presented in one of four orientations. d Predicted location of test stimulus spectra in xy colour space. Reference spectrum was held constant at x = 0.31 y = 0.33 (central point). e Heat map showing the proportion of incorrectly identified orientations for gratings formed by test and reference spectra as a function of the predicted xy coordinate of the test stimulus (x = 0.31 y = 0.33) for a representative participant. Note that incorrectly identified gratings cluster for test spectra in a particular region of colour space. f xy colour coordinate of the test stimulus (coloured circles) that was judged to be metameric to the reference stimulus (central point) for each participant. g Appearance of Purkinje tree sketched by one participant, viewing 3.2 cpd gratings with elevated penumbral L cone contrast, which were displayed over an enlarged visual space
Fig. 2
Fig. 2
Spatial frequency tuning of melanopsin form vision. a Proportion of correctly identified stimuli at spatial frequencies between 0.2 and 12.8 cycles per degree (cpd), individually calibrated ‘melanopic’ stimuli (black) and stimuli designed to target cone photoreceptors (11% L, M or S, 11% greyscale, 2% greyscale, represented by red, green, blue, orange and purple points, respectively). Repeated measures one-way ANOVAs showed significant effect of spatial frequency for all sets of stimuli (p < 0.001). The proportion of correct responses at each spatial frequency was compared with chance (0.25) using a one-sample t-test. For melanopic stimuli: **p < 0.01; ***p < 0.001. Data show mean ± SEM; n = 7. Where no error bars are plotted, all participants were correct in 100% of trials. b Spectral power distributions of stimuli targeting cone photoreceptors. Grey shaded spectrum: background spectrum (common to all spectral pairs); coloured lines show the other element of a stimulus pair used to form gratings at 11% L, M or S Michelson contrast, 11% greyscale, 2% greyscale (red, green, blue, orange and purple points, respectively). c Spectral power distributions of stimuli targeting melanopsin at a range of contrasts (stimuli as calibrated for one participant). Grey shaded spectrum: background spectrum (common to all spectral pairs); coloured lines shows spectra used to present 7–19% melanopsin contrast. d Contrast response functions for melanopic (black) and greyscale stimuli (orange) for 0.2, 0.4 and 0.8 cpd stimuli. Grey shading shows SEM. Sigmoidal dose–response curves were fitted to data (red lines)
Fig. 3
Fig. 3
Defining the sensitivity limits of melanopsin form vision. a Proportion of correctly identified stimuli at spatial frequencies from 0.2 to 12.8 cpd using individually calibrated melanopic (black) and 11% greyscale stimuli (orange) with stimuli attenuated by ~4000 (mean luminance 0.054 cd/m2; black edged circles). Repeated measures one-way ANOVAs showed significant effect of spatial frequency for greyscale (p < 0.001) but not melanopic stimuli (p = 0.09). For melanopic stimuli, no responses at ND4 were significantly different from 0.25 (one-sample t-test). Data show mean ± SEM; n = 7. b Irradiance response function for melanopic (black) and 11% greyscale stimuli (orange) for 0.4 cpd stimuli. A repeated measures one-way ANOVA showed significant effect of intensity for melanopic stimuli (p < 0.001). Responses were compared using a one-sample t-test with a mean of 0.25 (chance point. **p < 0.01). Data show mean ± SEM; n = 7. Where no error bars are plotted, all participants were correct in 100% of trials. c Proportion of correctly identified stimuli presented at temporal frequencies of 0.125–2.5 Hz (spatial frequency of 0.4 cpd) using individually calibrated ‘melanopic’ stimuli (black) and 11% greyscale stimuli. A repeated measures one-way ANOVA showed significant effect of temporal frequency for melanopic stimuli (p < 0.05). Responses were compared using a one-sample t-test with a mean of 0.25 (chance point); for melanopic stimuli: *p < 0.05; ***p < 0.001. Data show mean ± SEM; n = 5. Where no error bars are plotted, all participants were correct in 100% of trials
Fig. 4
Fig. 4
Divergence in melanopsin vs. luminance contrast in natural scenes. a Upper panel shows representative RGB rendering of a hyperspectral scene. Images were assumed to occupy 30° × 40° visual space. Lower panel shows spectral power distribution for a representative ‘pixel’ from this scene (occupying a 1.5° square of visual space to approximate spatial resolution of melanopic vision). b Depiction of image in (a) spatially down sampled to produce ‘pixels’ at 1.5° square and with greyscale level used to depict luminance (scale bar to right, 0 and 1 = lowest and highest luminance pixel) calculated by applying the luminance sensitivity function (shown to left) to spectral power distribution for each pixel. Yellow boxes indicate a representative pixel pair across which luminance contrast can be calculated. c As for (b), but depicting melanopic radiance calculated using melanopic sensitivity function (to left). d 2D histogram showing distribution of luminance and melanopic radiance contrast for all pixel pairs (as a % of total pixel pairs per image; scale to right) from 13 hyperspectral images. Dotted line shows point of equal luminance and melanopic contrast
Fig. 5
Fig. 5
Melanopsin contrast can be used to detect and distinguish spatial patterns. a Proportion of correctly detected 0.4 and 6.4 cpd gratings, for 2% greyscale (grey bars) and 2% greyscale +20% melanopic (blue bars) spectra. Data were compared with two-way ANOVA, finding a significant effect of spatial frequency (p < 0.01) and the interaction between spatial frequency and spectrum (p < 0.05). A post hoc Bonferroni multiple comparisons test compared spectral condition at the two frequencies (*p < 0.05). Data show mean ± SEM; n = 4. b Stimulus contrast for L, M and S cones (x axis) and melanopsin (y axis), for high and low-melanopic stimuli (white and black, respectively). c Two-alternative forced choice stimulus presentation protocol. In all cases, two stimuli were presented in series until a participant responded. In each case, stimuli presented the same cone contrast, but differed in their melanopic contrast. d Proportion of times participants selected the high-melanopic contrast stimulus as being more ‘distinct’. Responses were compared using a one-sample t-test with a mean of 0.5 (chance point; *p < 0.05; **p < 0.01). Data show mean ± SEM; n = 4. e Cartoon depicting stimulus presentation of greyscale images. Images were presented across the projection screen with 10° surrounding fixation point obscured. Greyscale images were presented using metameric low and high-melanopic settings (versions 1 and 2 in figure, respectively). On a second trial, images were also matched in mean melanopic radiance (but varied in the range of melanopic radiances presented across the image (i.e. high vs. low-melanopic spatial contrast)). f Bar graph depicting proportion of times participants (n = 4) selected the high-melanopic image as being more ‘distinct’ for low- and high-melanopic images. Participants showed significant preference for high-melanopic images, even when images were matched in their mean melanopic radiance (‘Total mel matched’). Responses were compared using a one-sample t-test with a mean of 0.5 (chance point; **p < 0.01; ***p < 0.001). Data show mean ± SEM; circles show mean rating for individual images. g Word cloud generated using four participant’s free-form descriptions of high-melanopic images compared with low-melanopic image. Word size relates to number of times participants used this descriptor to describe high-melanopic images

References

    1. Hattar S, Liao HW, Takao M, Berson DM, Yau KW. Melanopsin-containing retinal ganglion cells: architecture, projections, and intrinsic photosensitivity. Science. 2002;295:1065–1070. doi: 10.1126/science.1069609. - DOI - PMC - PubMed
    1. Lucas RJ, et al. Diminished pupillary light reflex at high irradiances in melanopsin-knockout mice. Science. 2003;299:245–247. doi: 10.1126/science.1077293. - DOI - PubMed
    1. Berson DM, Dunn FA, Takao M. Phototransduction by retinal ganglion cells that set the circadian clock. Science. 2002;295:1070–1073. doi: 10.1126/science.1067262. - DOI - PubMed
    1. Schmidt TM, et al. Melanopsin-positive intrinsically photosensitive retinal ganglion cells: from form to function. J. Neurosci. 2011;31:16094–16101. doi: 10.1523/JNEUROSCI.4132-11.2011. - DOI - PMC - PubMed
    1. Do MT, Yau KW. Intrinsically photosensitive retinal ganglion cells. Physiol. Rev. 2010;90:1547–1581. doi: 10.1152/physrev.00013.2010. - DOI - PMC - PubMed

Publication types