. 2019 Jun;570(7759):65-70.
doi: 10.1038/s41586-019-1235-y. Epub 2019 May 22.

Dissociable dopamine dynamics for learning and motivation

Affiliations

Dissociable dopamine dynamics for learning and motivation

Ali Mohebi et al. Nature. 2019 Jun.

Erratum in

Abstract

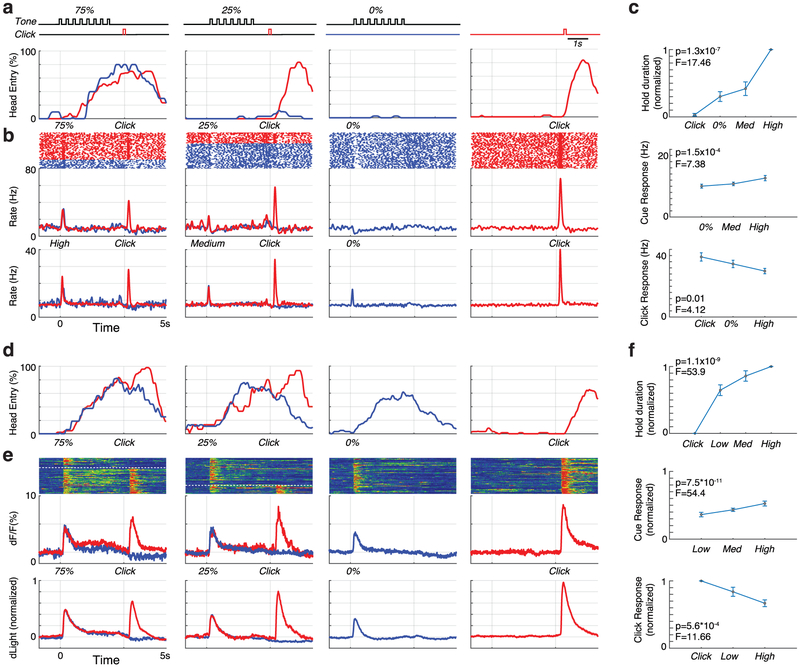
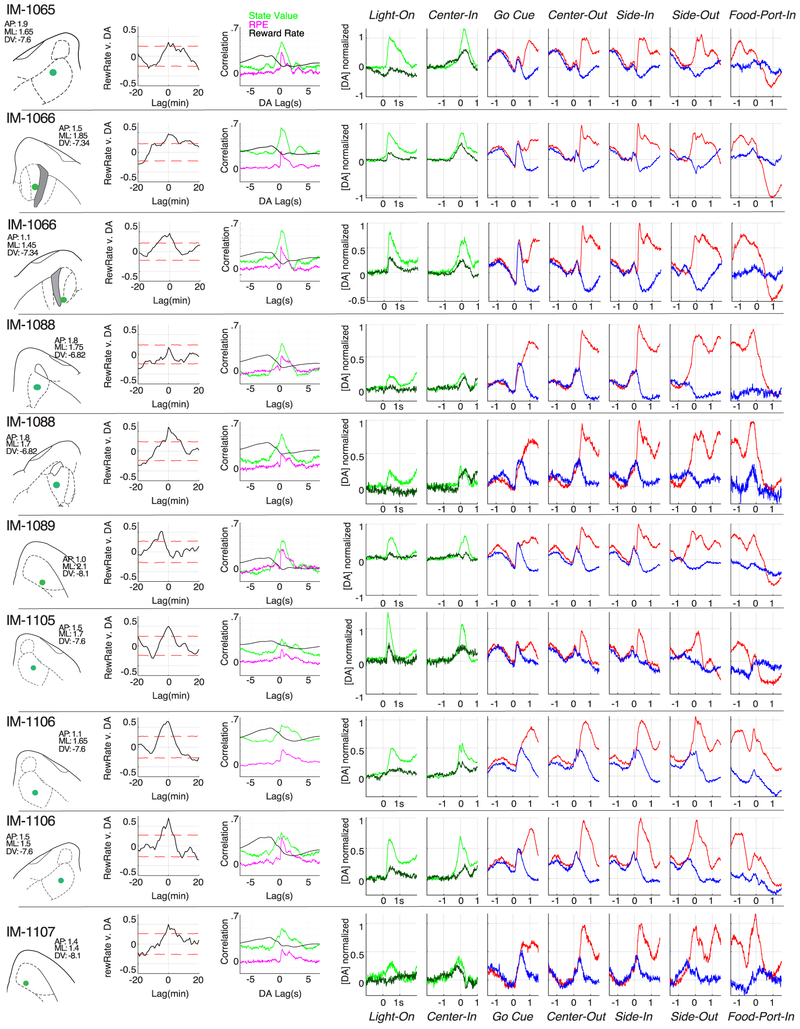
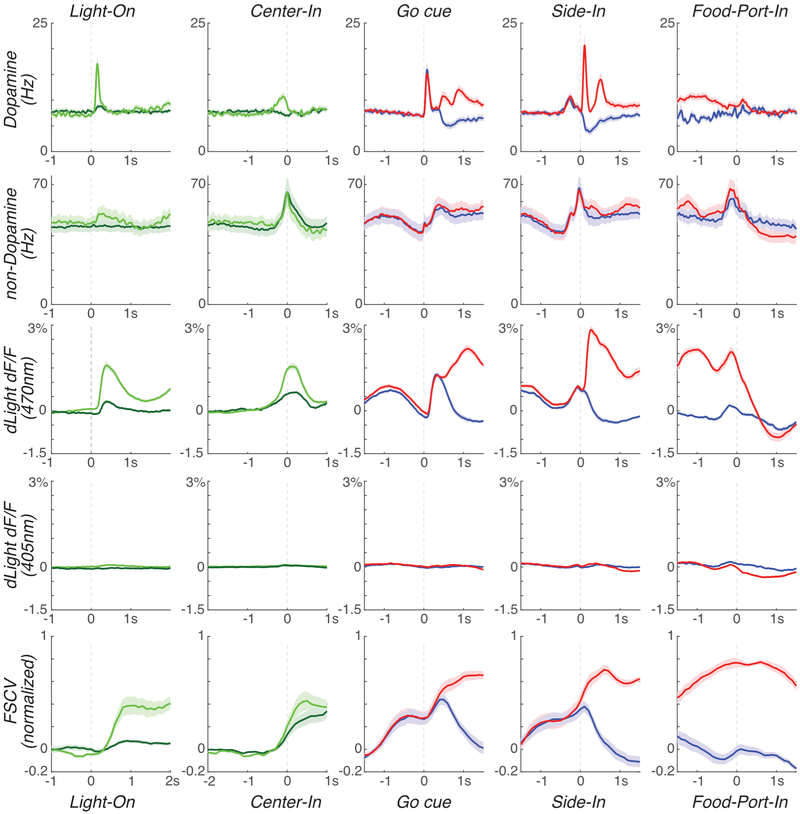
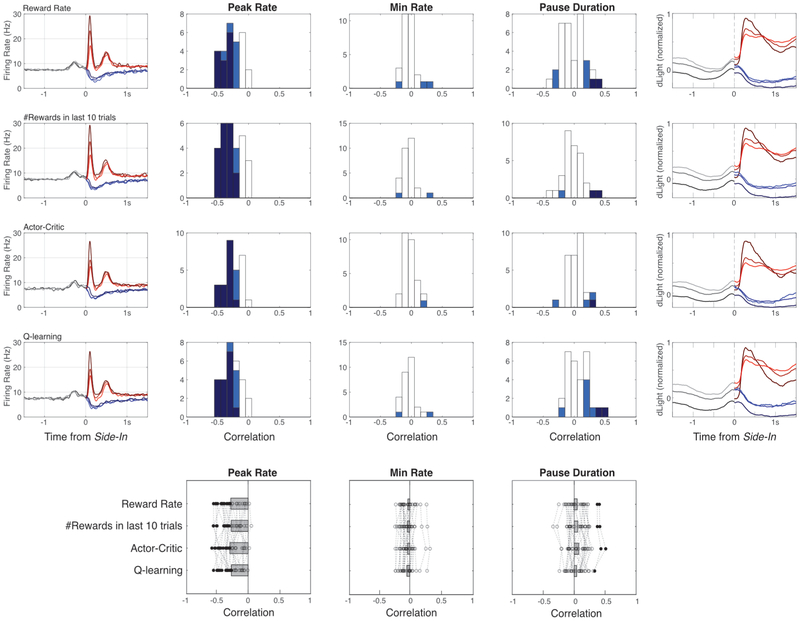
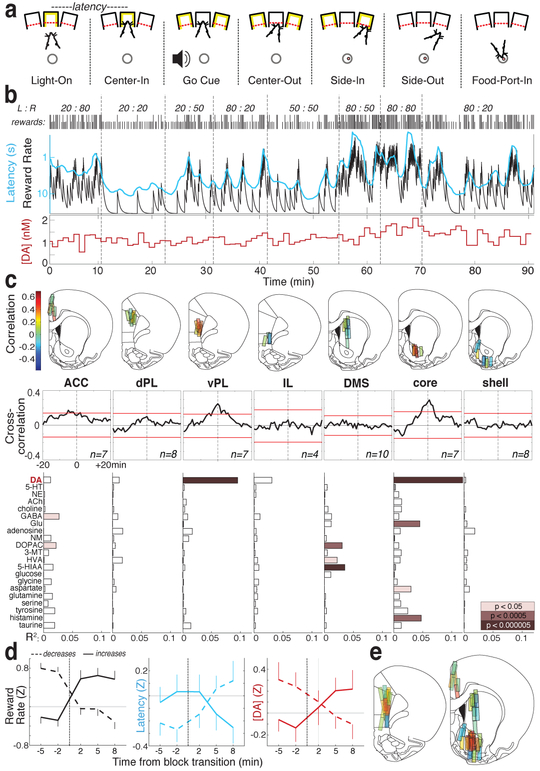
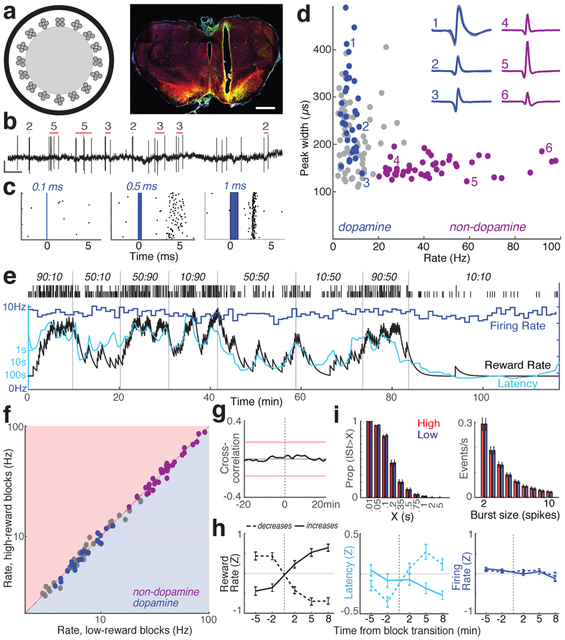
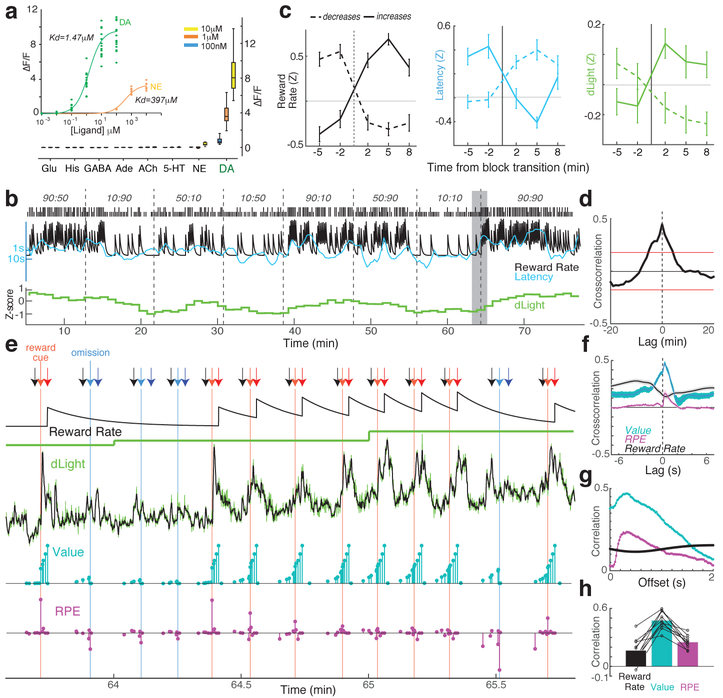
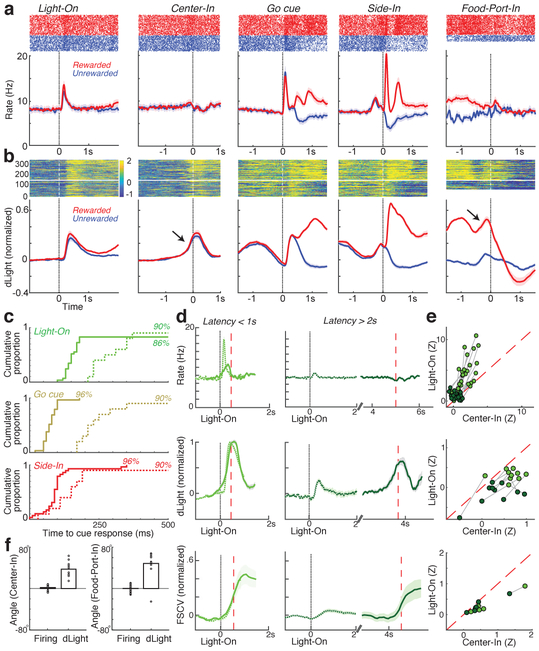
The dopamine projection from ventral tegmental area (VTA) to nucleus accumbens (NAc) is critical for motivation to work for rewards and reward-driven learning. How dopamine supports both functions is unclear. Dopamine cell spiking can encode prediction errors, which are vital learning signals in computational theories of adaptive behaviour. By contrast, dopamine release ramps up as animals approach rewards, mirroring reward expectation. This mismatch might reflect differences in behavioural tasks, slower changes in dopamine cell spiking or spike-independent modulation of dopamine release. Here we compare spiking of identified VTA dopamine cells with NAc dopamine release in the same decision-making task. Cues that indicate an upcoming reward increased both spiking and release. However, NAc core dopamine release also covaried with dynamically evolving reward expectations, without corresponding changes in VTA dopamine cell spiking. Our results suggest a fundamental difference in how dopamine release is regulated to achieve distinct functions: broadcast burst signals promote learning, whereas local control drives motivation.


Figures

Extended Data Figure 1.
a, Top left, anatomical definitions of the subregions examined with microdialysis. Atlas section schematics are from ref. . Other panels map the correlation between dopamine release and reward rate at individual probe placements in coronal (mm from bregma, B) and sagittal (mm from midline) planes. Color bar shows strength of correlation. b, Top left, Regression analysis showing dependency of (log-) latency on the outcome of recent trials, during microdialysis sessions (n=26 sessions, 7113 trials, from 12 rats; error bars show SEM). Asterisks indicate average regression weights significantly different from zero (t-test, p<0.05). Top right, Illustration of how the reward rate definition depends on the time constant (tau) of the leaky integrator. Below, dopamine : reward rate correlations as a function of tau. In the main figures tau was chosen (from a range of 1-1200s) to maximize the (negative) correlation between reward rate and (log) latency in each session. Thin lines represent individual sessions, with the best fit tau used in regression analyses indicated by a dot. Thick lines indicate the average of all dopamine : reward rate correlations for a given tau within each subregion. Overall behavioral metrics were similar between sessions sampling from each of the seven subregions (mean rewards/min: range 1.42-1.77, ANOVA F(6,44)=0.58, p=0.746; mean attempts/min: range 3.32-3.97, F(6,44)=0.40, p=0.872; mean latency: range 5.99-8.02, F(6,44)=0.27, p=0.948).
Extended Data Figure 2.
Extended Data Figure 2.. Correlations between all neurochemicals and a range of behavioral factors.
Bars represent R2 values for linear tests between each analyte (rows) and behavioral covariates (columns). In models with more than one covariate, bar length indicates the R2 for the full model. Negative relationships are reported in blue and positive relationships are in red. P-values are reported at three alpha levels (0.05, 0.0005, 0.000005) after Bonferroni correction for multiple comparisons (7 subregions × 21 analytes × 12 measures). To calculate reward rate, we averaged the leaky-integrator-estimated reward rate in 1 min bins defined by the start and end of each dialysis sample. ‘Attempts’ is the number of initiated trials (including trials that resulted in an error) in each dialysis minute. Attempts and reward rate and an interaction term were combined in a single model (column 2) to examine whether adding attempts could explain additional variance in the analyte signal that could not be explained by reward rate alone. “Latency” is the average of the (log)-latency in each minute. ’Exploit’ is the proportion of choices of the higher reward probability option, in the last half of blocks for which the two ports had different probabilities. ‘Rewards’ and ‘Omissions’ were defined as the number of rewarded and unrewarded trials in each min, respectively. ‘Cumulative Rewards’ and ‘Time’ were included in the same regression model to estimate progressive factors such as satiety, and possible slow timescale increases or decreases in analyte concentration across the session. Cumulative Rewards represents the total number of rewards received by the end of the current dialysis minute, and Time was simply the number of min elapsed since the session began. Bars in this column show color when only the coefficient for the cumulative reward variable was significant. %Ipsi and %Contra represent the fraction of choices to ipsi- or contra-versive ports (relative to probe location in the brain) in each minute, independent of block probability. P(win-stay) is the probability of repeating the previous choice, given the previous choice was rewarded.
Extended Data Figure 3.
Extended Data Figure 3.. Histological analysis of electrophysiological recording locations.
Left, Atlas locations (schematics from ref. 58) and histology photomicrographs for each rat (IM-657, IM-1002, IM-1003, IM-1037, IM-1078) from which opto-tagged dopamine cells were obtained. Red: TH-staining; green: ChR2::eYFP; blue: DAPI. Scale bars: 1mm. IM-1037 and IM-1078 brains were sliced horizontally, so fiber tracks appear as a circle. Font colors for rat ID# correspond to colors of tick marks in coronal atlas sections, indicating estimated recording locations for opto-tagged dopamine cells. For IM-1078 virus was injected into NAc core, and retrogradely-infected dopamine neurons were recorded in VTA. Right, Retrograde tracing of CTb from NAc core (top) to VTA-l (bottom). Top panel shows approximate extent of NAc labeling in each of the 3 rats (each rat indicated by a different color). Bottom left panels show close-ups of TH labeling (blue), CTb (green) and merged image. Bottom right panels show reconstructed locations of TH+ and double-labeled TH+/CTb+ midbrain neurons, on horizontal atlas sections. Estimated optrode locations are shown by red circles (or orange circle, in the case of the retrograde tagging rat IM-1078). Labelled neurons were counted within the red rectangles that span the AP and ML extent of estimated recording locations. Percentages shown are the fraction of TH+ neurons that are also CTb+.
Extended Data Figure 4.
Extended Data Figure 4.. Identification of light-responsive cells.
a. Average waveforms of optogenetically-identified dopamine neurons. Average light-evoked waveforms are shown in blue and session-wide average waveforms are in black. All spikes within 10ms of laser onset were used to construct light-evoked waveform average. Averaged waveforms are normalized to have similar total peak-valley voltages (see Extended Data Fig. 5 for individual voltage ranges). b. Session-wide average waveform for non-dopamine cells. c, Opto-tagging p-value for all units plotted in log-scale, showing a strong bimodal distribution. To classify cells as light-responsive we used a threshold of p<0.001. d. Times to first spike after laser onset, showing mean for each identified dopamine neuron, and standard deviation (jitter).
Extended Data Figure 5.
Extended Data Figure 5.. Dopaminergic responses to Pavlovian cues.
a, Tone pips were followed by reward delivery (“Click”) with different probabilities (zero, medium, high) depending on the tone pitch. During prior training (average, 15.6 sessions; range 2-26) rats had learned about these different probabilities, as indicated by their corresponding scaled likelihood of entering the food port during cue presentation. “Head entry %” indicates proportion of trials for which the rat was at the food port at each moment in time, for one example session. Red, blue indicate rewarded, unrewarded trials. This rat was more likely to go to the food port during the cue that was highly (75%) predictive of rewards compared to the other cues (25% and 0%; one-way ANOVA, F=11.1, p<1.2×10⁻⁶). Unpredictable reward delivery (right) prompts rapid approach. Bottom, raster plots and peri-event time histograms from an identified dopamine neuron during that same session. b, Averaged firing for identified dopamine cells (n=27) in this task. “High”/”Medium” tones were either 75%/25% predictive of reward (n=9 cells), or 100%/50% (n=18) respectively. Data on each individual dopamine neuron is presented in Extended Data Fig. 5. c, Behavior (top), cue response (middle), and click response (bottom) for all Pavlovian sessions with opto-tagged dopamine cells. Statistical comparisons were all one-way ANOVA, using Food Port head entry during 0.3s-3s epoch relative to cue onset, and peak firing rate during 0.5s duration epochs after cue onset or food hopper clicks. dLight d-f, same as above except for dLight measurements (n=10 sessions total). All dLight sessions used tones with 75, 25, and 0% reward probability, and ANOVA tests examined peak signal within 1s of cue onset or food hopper clicks.
Extended Data Figure 6.
Extended Data Figure 6.. Results from each dLight recording session.
Each row shows a distinct optic fiber placement, and the corresponding recording session that was included in data analyses. For two rats (IM-1066, IM-1088) we obtained bilateral NAc dLight recordings. From left to right, panels show histologically-determined NAc location of fiber tip (within horizontal brain atlas section, including atlas coordinates), long timescale cross-correlation with reward rate (as in Fig. 3c), short timescale cross-correlation with reward rate (black), SMDP state value (green) and RPE (magenta; as in Fig 3f); event-aligned averages (as in Fig. 4b, but including more events). For Light-On and Center-In alignments data are split by latencies <1s (light green) or >2s (dark green; as in Fig. 4d), for other alignments data are split by rewarded (red) and unrewarded (blue) trials.
Extended Data Figure 7.
Extended Data Figure 7.. Comparing event-aligned activity between different signals.
Format is as Fig. 4. dLight fluorescence is here shown separately for 470nm and 405nm (control) excitation. To note: 1) Rapid, behavior-linked dLight fluorescence changes occur at 470nm, as expected, not in the control 405nm band. 2) Distinct timing of spiking, dLight, and voltammetry (FSCV) responses to cue onsets; 3) Non-dopamine cell firing is much more variable (wider error bands), but on average shows activity during movements: starting just before Center-In (irrespective of latency), just before Side-In, and just before Food-Port-In.
Extended Data Figure 8.
Extended Data Figure 8.. Different methods for calculating reward expectation produce similar results.
Left column, average firing rate of dopamine cells around Side-In, broken down by terciles of reward expectation, based either on recent reward rate (top; same as Fig. 5a), # of rewards in previous 10 trials, state value (V) of an actor-critic model, or state value (Qleft+Qright) of a Q-learning model. The actor-critic and Q-learning models were both trial-based, rather than evolving continuously in time. The actor-critic model estimated the overall probability of receiving a reward on each trial, V, using the update rule V’ = V + alpha (RPE), where RPE = actual reward [1 or 0] – V. The Q-learning model kept separate estimates of the probabilities of receiving rewards for left and right choices (Qleft, Qright) and updated Q for the chosen action (only) using Q’ = Q + alpha (RPE), where RPE = actual reward [1 or 0] – Q. The learning parameter alpha was determined for each session by best fit to latencies, for V or (Qleft + Qright) respectively. Next columns show correlations between reward expectation and dopamine cell firing after Side-In, measuring either peak firing rate (within 250ms after rewarded Side-In), minimum firing rate (middle; within 2s after unrewarded Side-In), and pause duration (bottom; maximum inter-spike-interval within 2s after unrewarded Side-In). For all histograms, light blue indicates cells with significant correlations (p < 0.01) before multiple comparisons correction, dark blue indicates cells that remained significant after correction. Positive RPE coding is strong and consistent, negative RPE coding less so.
Fig. 1:
Fig. 1:. Dopamine release covaries with reward rate specifically in NAc core and ventral prelimbic cortex.
a, Bandit task events. b, Example session. Top row, reward probabilities in each block (left:right); Next row, ticks indicate outcome of each trial (tall, rewarded; short, unrewarded). Next row, leaky-integrator estimate of reward rate (black) and running-average of latency (cyan; inverted log scale). Bottom, NAc core dopamine in the same session (1 min samples). c, Top, microdialysis locations in medial frontal cortex and striatum (see also Extended Data Fig.1). n=51 probe locations, from 12 rats, each with two microdialysis probes that were lowered between sessions. Bar color indicates correlation between dopamine and reward rate. ACC, anterior cingulate cortex; dPL, dorsal prelimbic cortex; vPL, ventral prelimbic cortex; IL, infralimbic cortex; DMS, dorsal-medial striatum. Middle, averaged cross-correlograms between dopamine, reward rate. Red bars indicate 99% confidence interval from shuffled time series. Bottom, relationships between neurochemicals and reward rate (multiple regression). d, Effect of block transitions on reward rate (left), latency (middle) and NAc core dopamine (right). Transitions were classified by whether the experienced reward rate increased (n=25) or decreased (n=33). Data are from all 14 sessions in which NAc core dopamine was measured (one per rat, combining data from new and previously reported animals), and plotted as mean +− SEM. e, Composite maps of correlations between dopamine and reward rate (n=19 rats, 33 sessions, 58 probe placements).
Fig. 2:
Fig. 2:. Activity of identified VTA dopamine neurons does not change with reward rate.
a, Left, optrode schematic with 16 tetrodes around 200μm-diameter optic fiber. Right, example of optrode placement within lateral VTA. Scale bar = 1mm. Red = dopamine cell marker tyrosine hydroxylase; green = ChR2-EYFP; yellow = overlap. For all placements, see Extended Data Fig.3. b, VTA dopamine cell spikes. Red bars indicate detected bursts, numbers of spikes in those bursts (see Methods). Scale, 0.5s, 0.5mV. c, Example neuron response to laser pulses of increasing duration. d, Session-wide firing rate versus spike width (at half-maximum) for each VTA cell. Blue, tagged dopamine cells; purple, a distinct cluster of presumed non-dopamine neurons. Insets, examples of average waveforms. e, Firing rate (blue; 1min bins) of a VTA dopamine neuron during bandit task. Latency (cyan) covaries with reward rate, but firing rate does not. f, Firing rate for all VTA neurons (blue, dopamine; purple, non-dopamine; grey, unclassified) in low vs. high reward rate blocks. None showed significant differences (Wilcoxon signed rank test using 1-min bins, all p > 0.05 after correcting for multiple comparisons). g, Average cross-correlation between dopamine cell firing and reward rate shows no significant relationship. h, Analysis of dopamine firing rate at block transitions (same format as Fig.1d). n=95 reward increases, 76 decreases. i. Distributions of inter-spike-intervals (ISIs, left) and spike bursts (right) are unchanged between higher- and lower reward rate blocks (Kolmogorov-Smirnov statistics: ISIs, 0.138, p=0.92, bursts, 0.165, p=0.63).
Fig. 3:
Fig. 3:. Bridging timescales of dopamine measurement.
a, Fluorescence response of dLight1.3b. Inset, titrations of dopamine (DA; n=15 ROIs) and norepinephrine (NE; n=9). Main figure, bath-applied neurotransmitters (all n=12 ROIs). Glu, glutamate; His, histamine; ACh, acetylcholine. b, Sample bandit session including normalized NAc dLight1.3b signal (1 min bins). c, dLight signal changes with block transitions. n=35 reward rate increases, 45 decreases. d, Cross-correlation between dLight and reward rate. e, Closer view of the shaded portion of b. Arrows: black, Center-Nose-In; light red, Side-In (rewarded); light blue, Side-In (unrewarded); dark red, Food-Port-In (rewarded); dark blue, Food-Port-In (unrewarded). Next rows: leaky-integrator estimate of reward rate, dLight at low resolution (1 min), high resolution (50Hz, green; 5-point median-filtered, black); model state values (cyan) and RPEs (magenta). After several unrewarded trials state values early in the trial are low, then reward delivery evokes a positive RPE and accompanying sharp increase in dopamine. Successive rewarded trials diminish RPEs, but increase state values, accompanied by ramping dopamine. f, Short timescale crosscorrelations show close relationship between dLight and value, and smaller relationship to RPE. g, Within-trial correlations between model variables and dLight with different lags; correlation to both value and RPE is strongest to dLight ~0.3s later. h, In all sessions maximum correlation was greater for value than RPE or reward rate.
Fig. 4:
Fig. 4:. Phasic VTA dopamine firing does not account for NAc dopamine dynamics.
a, Event-aligned activity of VTA-l dopamine cells. Top, spike rasters for one representative cell; bottom, average (n=29). b, Event-aligned NAc dLight. Top, representative session; bottom, average (n=10), normalized to peak rewarded Side-In response. Throughout this figure, dLight signals are shown relative to a 2s “baseline” epoch ending 1s before Center-In. Note increases (arrows) shortly before Center-In, Food-Port-In. c, Cumulative distributions of time for dopamine cells (solid; n=29), dLight (dashed; n=10), to increase following cue onsets (shuffle test compared to baseline, 10,000 shuffles, p<0.01, multiple comparisons corrected). For Light-On, only latencies <1s included; for Side-In only rewarded trials. Median latencies (from sigmoid fit): Light-On, firing 152ms, dLight 266ms; Go cue, firing 67ms, dLight 212ms; Side-In, firing 85ms, dLight 129ms. Non-dopamine cells were typically indifferent to cue onsets (Extended Data Fig.8). d, Distinct cue-evoked, approach-related dopamine release. Top, average dopamine cell firing (n=29); middle, bottom, average dLight (n=10), voltammetry (n=6), normalized to peak short-latency Light-On response. Left panels, latencies <1s, right, latencies > 2s. Data are aligned on Light-On (solid) or Center-In (dotted); red dashed line, median latency. For longer latencies there is no increase in firing near Center-In, but dLight and voltammetry show a marked increase. e, Scatter plot comparing peak signals aligned on Light-On (y-axis) or Center-In (x-axis). For each cell, session connected lines indicate data for distinct latency ranges (<1s, >2s). Dopamine firing (top) consistently shows Light-On response for short-latency trials (2-way ANOVA, Alignment × Latency interaction F=7.47, p=0.0008). dLight (middle), voltammetry (bottom) signals are consistently better aligned to Center-In (2-way ANOVA for dLight: Alignment × Latency interaction, F=9.28. p=0.0043). f, Dopamine increases during approach, quantified as ramp angle (see Methods). Circles indicate individual dopamine cells (n=29), dLight sessions (n=10).
Fig. 5.
Fig. 5.. Reward history affects VTA dopamine cell firing and NAc dopamine release differently.
a, Top, averaged firing rates of dopamine cells (n=29) aligned to Side-In, broken down by reward rate (terciles, calculated separately for each cell). Before Side-In, activity does not depend on reward expectation. After Side-In rewarded (red), unrewarded (blue) trials are shown separately. Food click response is stronger when reward rate is low, consistent with encoding of positive RPEs. Bottom, fraction of individual dopamine cells whose firing rate significantly varies with reward rate at each moment (shuffle test, p<0.01, multiple comparisons corrected). Tick marks at top indicate times when this fraction was significantly higher than chance (binomial, p<0.01). After Side-In, only negative correlations are tested, i.e. potential RPE-coding. b, Regression plots for sessions with recorded dopamine cells, showing the impact of recent reward history on (log-) latency (top) and dopamine spiking. Asterisks indicate significant regression weights (t-test, p<0.05). During the 0.5s before Go cue (while rat must maintain steady nosepoke for trial to proceed) dopamine spiking is unaffected by reward history (middle). This changes once the outcome is revealed (bottom; assessing peak or trough of activity in the 0.5s after Side-In), but only for rewarded trials. c,d, same as above, except for dLight (normalized to peak Side-In response). Dopamine release reliably scales with reward rate even before Side-In.

Comment in

References

References.

    1. Schultz W, Dayan P & Montague PR A neural substrate of prediction and reward. Science 275, 1593–1599 (1997). - PubMed
    1. Pan WX, Schmidt R, Wickens JR & Hyland BI Dopamine cells respond to predicted events during classical conditioning: evidence for eligibility traces in the reward-learning network. J Neurosci 25, 6235–6242 (2005). - PMC - PubMed
    1. Cohen JY, Haesler S, Vong L, Lowell BB & Uchida N Neuron-type-specific signals for reward and punishment in the ventral tegmental area. Nature 482, 85–88 (2012). - PMC - PubMed
    1. Steinberg EE, Keiflin R, Boivin JR, Witten IB, et al. A causal link between prediction errors, dopamine neurons and learning. Nat Neurosci (2013). - PMC - PubMed
    1. Hamid AA, Pettibone JR, Mabrouk OS, Hetrick VL, et al. Mesolimbic dopamine signals the value of work. Nat Neurosci 19, 117–126 (2016). - PMC - PubMed

Methods References.

    1. Witten IB, Steinberg EE, Lee SY, Davidson TJ, et al. Recombinase-driver rat lines: tools, techniques, and optogenetic application to dopamine-mediated reinforcement. Neuron 72, 721–733 (2011). - PMC - PubMed
    1. Sugrue LP, Corrado GS & Newsome WT Matching behavior and the representation of value in the parietal cortex. Science 304, 1782–1787 (2004). - PubMed
    1. Wong JM, Malec PA, Mabrouk OS, Ro J, et al. Benzoyl chloride derivatization with liquid chromatography-mass spectrometry for targeted metabolomics of neurochemicals in biological samples. J Chromatogr A 1446, 78–90 (2016). - PMC - PubMed
    1. Chung JE, Magland JF, Barnett AH, Tolosa VM, et al. A Fully Automated Approach to Spike Sorting. Neuron 95, 1381–1394.e6 (2017). - PMC - PubMed
    1. Kvitsiani D, Ranade S, Hangya B, Taniguchi H, et al. Distinct behavioural and network correlates of two interneuron types in prefrontal cortex. Nature 498, 363–366 (2013). - PMC - PubMed