. 2017 Nov 13;3(11):3022-3028.
doi: 10.1021/acsbiomaterials.6b00576. Epub 2016 Oct 18.

Fibroblasts Slow Conduction Velocity in a Reconstituted Tissue Model of Fibrotic Cardiomyopathy

Affiliations

Fibroblasts Slow Conduction Velocity in a Reconstituted Tissue Model of Fibrotic Cardiomyopathy

Teresa M Spencer et al. ACS Biomater Sci Eng. .

Abstract

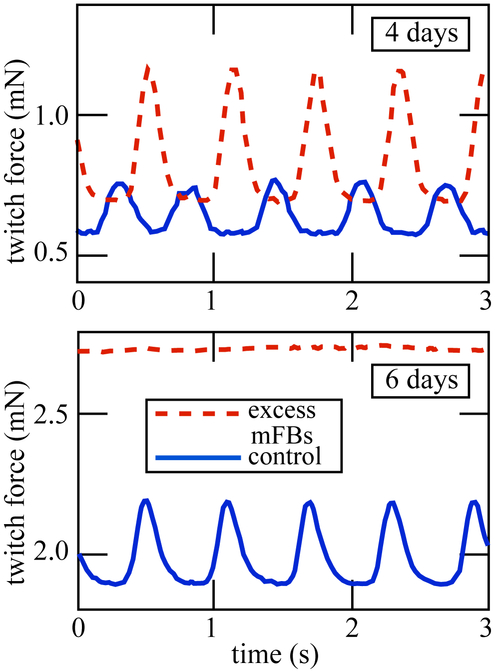
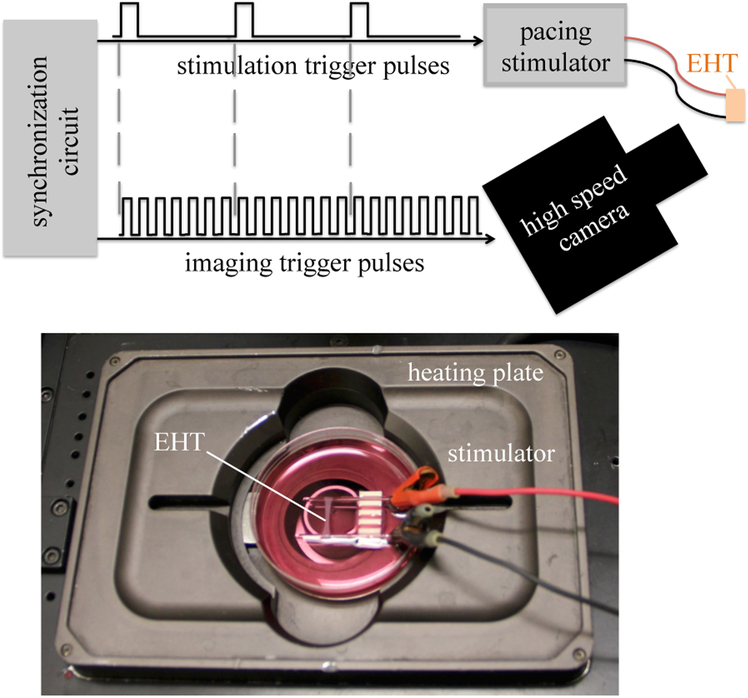
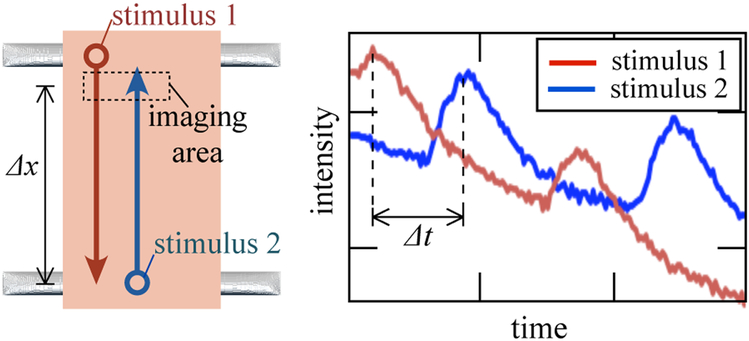
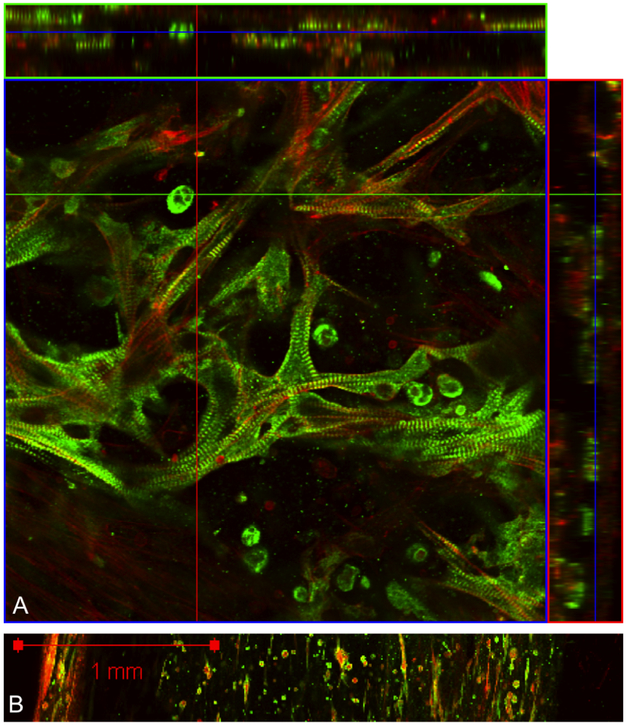
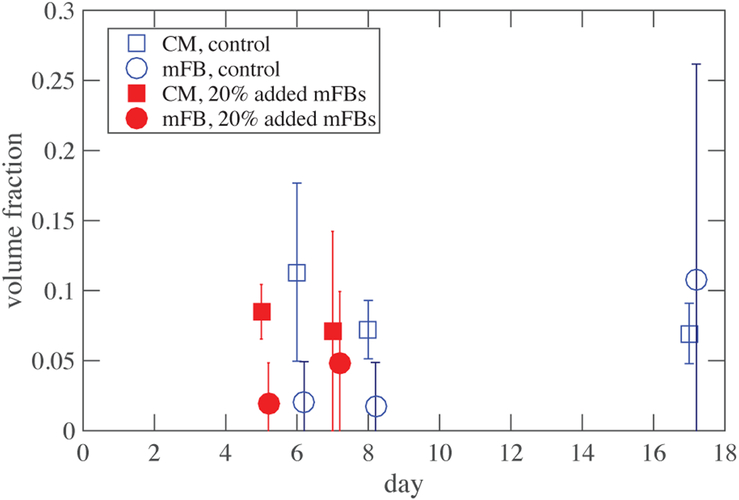
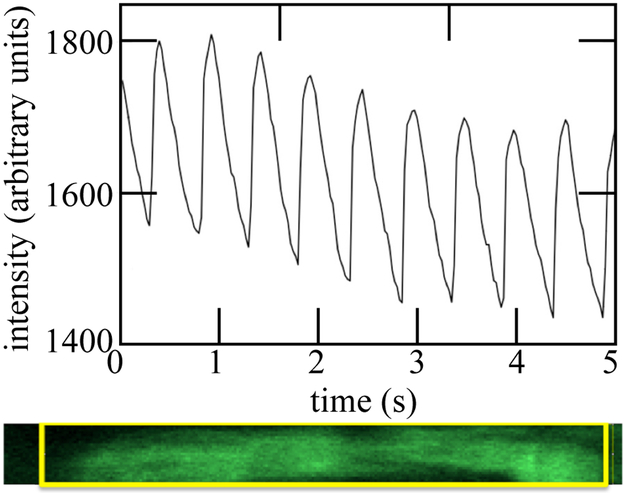
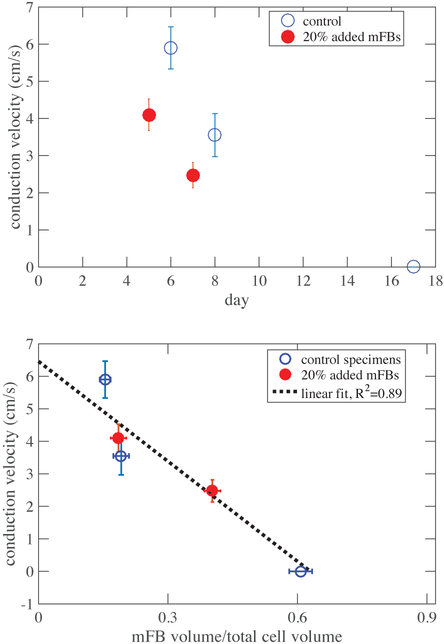
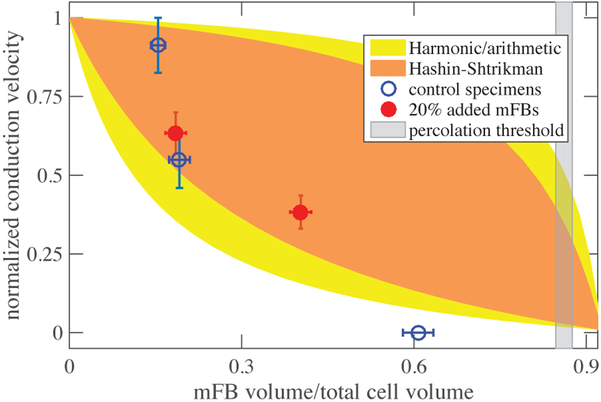
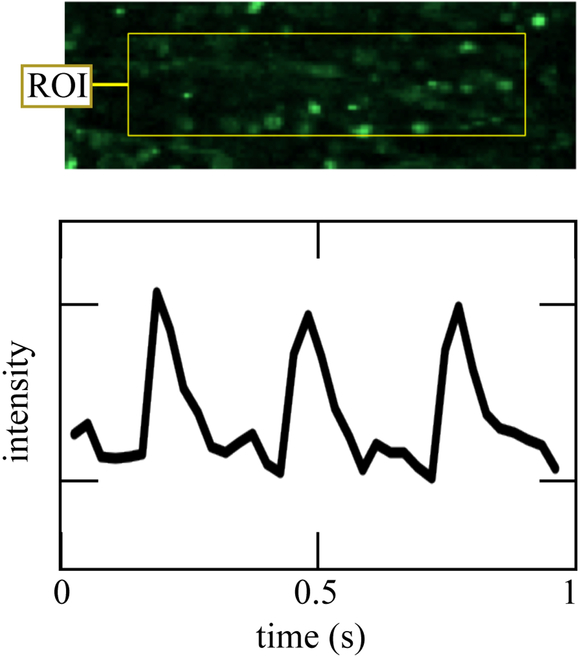
Myocardial function deteriorates over the course of fibrotic cardiomyopathy, due to electrophysiological and mechanical effects of myofibroblasts that are not completely understood. Although a range of experimental model systems and associated theoretical treatments exist at the levels of isolated cardiomyocytes and planar co-cultures of myofibroblasts and cardiomyocytes, interactions between these cell types at the tissue level are less clear. We studied these interactions through an engineered heart tissue (EHT) model of fibrotic myocardium and a mathematical model of the effects of cellular composition on EHT impulse conduction velocity. The EHT model allowed for modulation of cardiomyocyte and myofibroblast volume fractions, and observation of cell behavior in a three-dimensional environment that is more similar to native heart tissue than is planar cell culture. The cardiomyocyte and myofibroblast volume fractions determined the retardation of impulse conduction (spread of the action potential) in EHTs as measured by changes of the fluorescence of the Ca2+ probe, Fluo-2. Interpretation through our model showed retardation far in excess of predictions by homogenization theory, with conduction ceasing far below the fibroblast volume fraction associated with steric percolation. Results point to an important multiscale structural role of myofibroblasts in attenuating impulse conduction in fibrotic cardiomyopathy.


Figures

Figure 1:
Figure 1:
Myofibroblast content of the EHT determines the development of contractile forces. Data from Genin et al..
Figure 2:
Figure 2:
Top: EHT specimens were paced and imaged using an integrated system to enable mapping of calcium transients. Bottom: an EHT mounted for imaging on a heating plate (not shown: glass cover).
Figure 3:
Figure 3:
EHT specimens were paced at opposite ends, and their fluorescence transients were analyzed to estimate cimpulse conduction velocity.
Figure 4:
Figure 4:
A. A representative immunofluorescence image with orthogonal view sliced from left to right (top) and top to bottom (right). Cardiomyocytes are stained for titin (green), cardiomyocytes and myofibroblasts are stained for F-actin (red). B. A tile scan across an entire tissue reveals large variation in cell type and density.
Figure 5:
Figure 5:
Volume fraction of cardiomyocytes remained stable over time, while fibroblasts proliferated unevenly. Error bars represent range of scatter. Negative values (not shown) arose due to challenges associated with subtracting titin signals from actin signals.
Figure 6:
Figure 6:
A transient calcium response of a single cardiomyocyte within an EHT specimen, shown in the lower panel, revealed regular oscillation convoluted with signal attenuation due to photobleaching. The intensity reported was that of the region of interest within the box shown in the lower panel.
Figure 7:
Figure 7:
Top: Conduction velocity declined over time as myofibroblasts proliferated though the EHT. Decline occurred at approximately the same rate for both control and treatment groups, but began earlier in the specimens with added myofibroblasts. Error bars indicate standard deviation in impulse conduction velocity. Bottom: Data collapsed onto a single linear trendline when renormalized against myofibroblast fraction. Error bars indicate standard deviation in impulse conduction velocity. Error bars indicate standard deviation in impulse conduction velocity (y-axis) and standard error of the mean distribution of myofibroblast concentration (x-axis).
Figure 8:
Figure 8:
The observed decline in impulse conduction velocity with increasing myofibroblast concentration fell from the upper to lower Hashin-Shtrikman bound at a concentration far below the percolation threshold. At sufficiently high volume fraction, impulse conduction ceased.
Figure 9:
Figure 9:
Fluo-2 recording of a single cell’s calcium transient at 40 fps revealed possible alternans. This rare event, first predicted by, is an example of a local interaction phenomena that can explain the large effect of myofibroblasts relative tho their volume fraction.

References

    1. Weber KT; Sun Y; Bhattacharya SK; Ahokas RA; Gerling IC Myofibroblast-mediated mechanisms of pathological remodelling of the heart. Nature Reviews Cardiology 2013,10, 15–26. - PubMed
    1. Berk BC; Fujiwara K; Lehoux S ECM remodeling in hypertensive heart disease. The Journal of clinical investigation 2007,117, 568–575. - PMC - PubMed
    1. Rohr S Myofibroblasts in diseased hearts: new players in cardiac arrhythmias? Heart Rhythm 2009, 6, 848–856. - PubMed
    1. Smaill BH; Zhao J; Trew ML Three-Dimensional IMpulse Propagation in Myocardium: Arrhythmogenic Mechanisms at the Tissue Level. Circulation Research 2013,112, 831–833. - PubMed
    1. Miragoli M; Gaudesius G; Rohr S Electrotonic modulation of cardiac impulse conduction by myofibroblasts. Circulation Research 2006, 98, 801–810. - PubMed

LinkOut - more resources