

Symptom Based Clustering of Men in the LURN Observational Cohort Study
- PMID: 31120372
- PMCID: PMC6842034
- DOI: 10.1097/JU.0000000000000354
Symptom Based Clustering of Men in the LURN Observational Cohort Study
Abstract
Purpose: Conventional classification of patients with lower urinary tract symptoms into diagnostic categories based on a predefined symptom complex or predominant symptom appears inadequate. This is due to the frequent presentation of patients with multiple urinary symptoms which could not be perfectly categorized into traditional diagnostic groups. We used a novel clustering method to identify subtypes of male patients with lower urinary tract symptoms based on detailed multisymptom information.
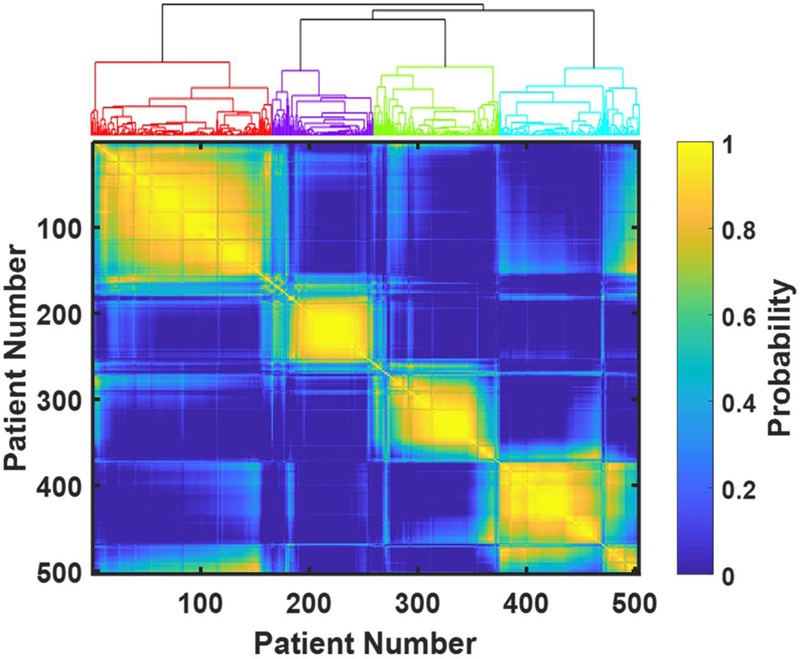
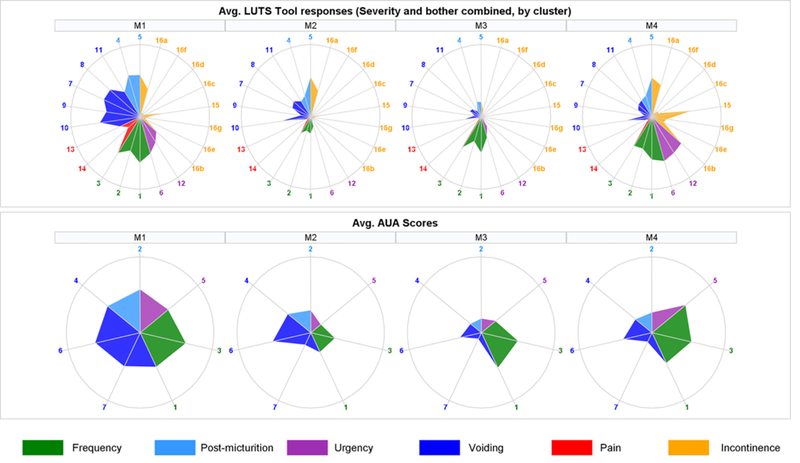
Materials and methods: We analyzed baseline data on 503 care seeking men in the LURN (Symptoms of Lower Urinary Tract Dysfunction Research Network) Observational Cohort Study. Symptoms and symptom severity were assessed using the LUTS (Lower Urinary Tract Symptoms) Tool and the AUA SI (American Urological Association Symptom Index), which include a total of 52 questions. We used a resampling based consensus clustering algorithm to identify patient subtypes with distinct symptom signatures.
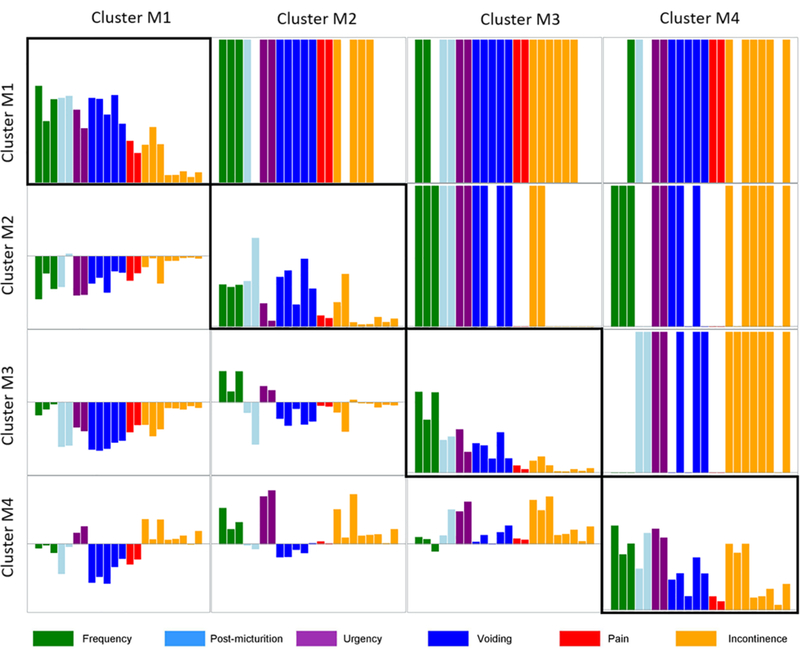
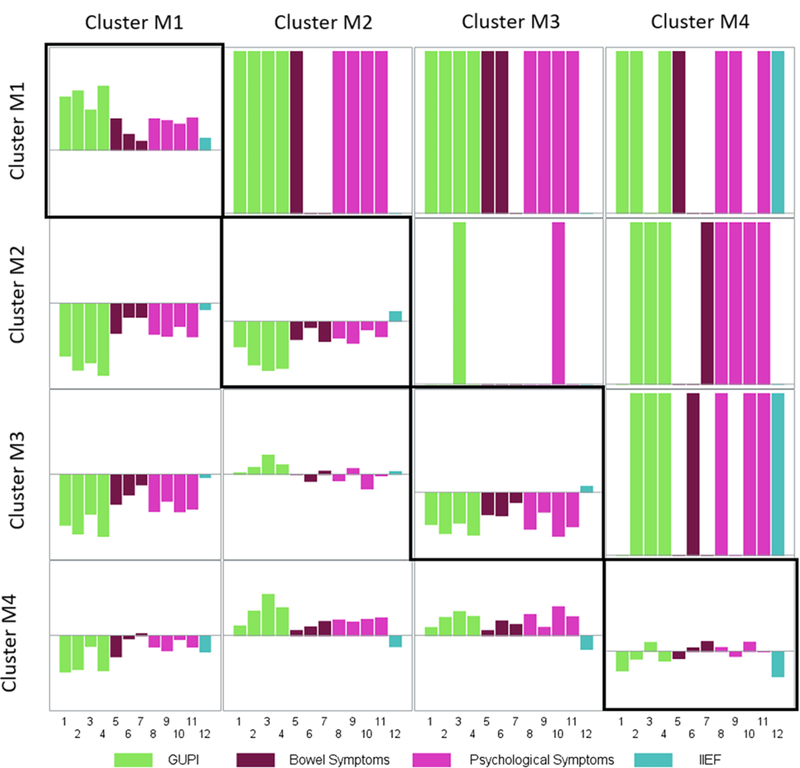
Results: Four distinct symptom clusters were identified. The 166 patients in cluster M1 had predominant symptoms of frequency, nocturia, hesitancy, straining, weak stream, intermittency and incomplete bladder emptying suggestive of bladder outlet obstruction. The 93 patients in cluster M2 mainly endorsed post-micturition symptoms (eg post-void dribbling and post-void leakage) with some weak stream. The 114 patients in cluster M3 reported mostly urinary frequency without incontinence. The 130 patients in cluster M4 reported severe frequency, urgency and urgency incontinence. Most other urinary symptoms statistically differed between cluster pairs. Patient reported outcomes of bowel symptoms, mental health, sleep dysfunction, erectile function and urological pain significantly differed across the clusters.
Conclusions: We identified 4 data derived clusters among men seeking care for lower urinary tract symptoms. The clusters differed from traditional diagnostic categories. Further subtype refinement will be done to incorporate clinical data and nonurinary patient reported outcomes.
Keywords: cluster analysis; diagnosis; lower urinary tract symptoms; patient reported outcome measures; urinary bladder.
Figures
Comment in
-
Editorial Comment.J Urol. 2019 Dec;202(6):1237-1238. doi: 10.1097/01.JU.0000581748.98633.29. Epub 2019 Aug 30. J Urol. 2019. PMID: 31469604 No abstract available.
-
Editorial Comment.J Urol. 2019 Dec;202(6):1238. doi: 10.1097/01.JU.0000581752.36752.2c. Epub 2019 Aug 30. J Urol. 2019. PMID: 31469609 No abstract available.
Similar articles
-
Symptom Based Clustering of Women in the LURN Observational Cohort Study.J Urol. 2018 Dec;200(6):1323-1331. doi: 10.1016/j.juro.2018.06.068. Epub 2018 Jul 7. J Urol. 2018. PMID: 29990467 Free PMC article.
-
A new outcome measure for LUTS: Symptoms of Lower Urinary Tract Dysfunction Research Network Symptom Index-29 (LURN SI-29) questionnaire.Neurourol Urodyn. 2019 Aug;38(6):1751-1759. doi: 10.1002/nau.24067. Epub 2019 Jun 21. Neurourol Urodyn. 2019. PMID: 31225927 Free PMC article.
-
A New Brief Clinical Assessment of Lower Urinary Tract Symptoms for Women and Men: LURN SI-10.J Urol. 2020 Jan;203(1):164-170. doi: 10.1097/JU.0000000000000465. Epub 2019 Jul 31. J Urol. 2020. PMID: 31364922 Free PMC article.
-
Total urgency and frequency score as a measure of urgency and frequency in overactive bladder and storage lower urinary tract symptoms.BJU Int. 2014 May;113(5):696-703. doi: 10.1111/bju.12555. Epub 2014 Feb 20. BJU Int. 2014. PMID: 24712917 Review.
-
EAU Guidelines on the Assessment of Non-neurogenic Male Lower Urinary Tract Symptoms including Benign Prostatic Obstruction.Eur Urol. 2015 Jun;67(6):1099-1109. doi: 10.1016/j.eururo.2014.12.038. Epub 2015 Jan 19. Eur Urol. 2015. PMID: 25613154 Review.
Cited by
-
Subtyping of common complex diseases and disorders by integrating heterogeneous data. Identifying clusters among women with lower urinary tract symptoms in the LURN study.PLoS One. 2022 Jun 10;17(6):e0268547. doi: 10.1371/journal.pone.0268547. eCollection 2022. PLoS One. 2022. PMID: 35687541 Free PMC article.
-
Phenotyping Men With Lower Urinary Tract Symptoms: Results From the Symptoms of Lower Urinary Tract Dysfunction Research Network.Neurourol Urodyn. 2025 Jan;44(1):178-193. doi: 10.1002/nau.25596. Epub 2024 Oct 7. Neurourol Urodyn. 2025. PMID: 39370868 Free PMC article.
-
Characterizing the spectrum of bladder health and lower urinary tract symptoms among men: Results from the CARDIA study.Neurourol Urodyn. 2024 Apr;43(4):840-848. doi: 10.1002/nau.25430. Epub 2024 Feb 26. Neurourol Urodyn. 2024. PMID: 38407331 Free PMC article.
-
Symptoms of Lower Urinary Tract Dysfunction Research Network (LURN): An introduction to the Urinary Urgency Phenotyping Protocol LURN II.Neurourol Urodyn. 2024 Nov;43(8):1800-1808. doi: 10.1002/nau.25566. Epub 2024 Jul 29. Neurourol Urodyn. 2024. PMID: 39075835 Free PMC article. Review.
-
Longitudinal changes in symptom-based female and male LUTS clusters.Neurourol Urodyn. 2020 Jan;39(1):393-402. doi: 10.1002/nau.24219. Epub 2019 Nov 25. Neurourol Urodyn. 2020. PMID: 31765491 Free PMC article.
References
-
- Irwin DE, Milsom I, Hunskaar S, et al. Population-based survey of urinary incontinence, overactive bladder, and other lower urinary tract symptoms in five countries: results of the EPIC study. Eur Urol. 50:1306, 2006. - PubMed
-
- Liao TW. Clustering of time series data -a survey. Pattern Recognit. 38:1857–1874, 2005.
-
- Coyne KS, Matza LS, Kopp ZS et al. Examining lower urinary tract symptom constellations using cluster analysis. BJU Int. 101:1267–73, 2008. - PubMed
-
- Cinar A, Hall SA, Link CL, et al. Cluster analysis and lower urinary tract symptoms in men: findings from the Boston Area Community Health Survey. BJU Int. 101:1247–56, 2008. - PubMed
-
- Abrams P, Donovan JL, de la Rosette JJ, et al. International Continence Society “Benign Prostatic Hyperplasia” Study: background, aims, and methodology. Neurourol Urodyn. 16:79–91, 1997. - PubMed
Publication types
MeSH terms
Grants and funding
LinkOut - more resources
Full Text Sources
Medical
