Epidemic prevalence information on social networks can mediate emergent collective outcomes in voluntary vaccine schemes
- PMID: 31120877
- PMCID: PMC6532839
- DOI: 10.1371/journal.pcbi.1006977
Epidemic prevalence information on social networks can mediate emergent collective outcomes in voluntary vaccine schemes
Abstract
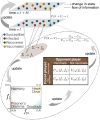
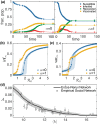
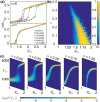
The effectiveness of a mass vaccination program can engender its own undoing if individuals choose to not get vaccinated believing that they are already protected by herd immunity. This would appear to be the optimal decision for an individual, based on a strategic appraisal of her costs and benefits, even though she would be vulnerable during subsequent outbreaks if the majority of the population argues in this manner. We investigate how voluntary vaccination can nevertheless emerge in a social network of rational agents, who make informed decisions whether to be vaccinated, integrated with a model of epidemic dynamics. The information available to each agent includes the prevalence of the disease in their local network neighborhood and/or globally in the population, as well as the fraction of their neighbors that are protected against the disease. Crucially, the payoffs governing the decision of agents vary with disease prevalence, resulting in the vaccine uptake behavior changing in response to contagion spreading. The collective behavior of the agents responding to local prevalence can lead to a significant reduction in the final epidemic size, particularly for less contagious diseases having low basic reproduction number [Formula: see text]. Near the epidemic threshold ([Formula: see text]) the use of local prevalence information can result in divergent responses in the final vaccine coverage. Our results suggest that heterogeneity in the risk perception resulting from the spatio-temporal evolution of an epidemic differentially affects agents' payoffs, which is a critical determinant of the success of voluntary vaccination schemes.
Conflict of interest statement
The authors have declared that no competing interests exist.
Figures


Similar articles
-
A simulation analysis to characterize the dynamics of vaccinating behaviour on contact networks.BMC Infect Dis. 2009 May 28;9:77. doi: 10.1186/1471-2334-9-77. BMC Infect Dis. 2009. PMID: 19476616 Free PMC article.
-
Optimal control of vaccination dynamics during an influenza epidemic.Math Biosci Eng. 2014 Oct;11(5):1045-63. doi: 10.3934/mbe.2014.11.1045. Math Biosci Eng. 2014. PMID: 25347806
-
Outcome inelasticity and outcome variability in behaviour-incidence models: an example from an SEIR infection on a dynamic network.Comput Math Methods Med. 2012;2012:652562. doi: 10.1155/2012/652562. Epub 2012 Dec 5. Comput Math Methods Med. 2012. PMID: 23251231 Free PMC article.
-
Vaccination and herd immunity: what more do we know?Curr Opin Infect Dis. 2012 Jun;25(3):243-9. doi: 10.1097/QCO.0b013e328352f727. Curr Opin Infect Dis. 2012. PMID: 22561998 Review.
-
The estimation of the basic reproduction number for infectious diseases.Stat Methods Med Res. 1993;2(1):23-41. doi: 10.1177/096228029300200103. Stat Methods Med Res. 1993. PMID: 8261248 Review.
Cited by
-
Noncompliance With Safety Guidelines as a Free-Riding Strategy: An Evolutionary Game-Theoretic Approach to Cooperation During the COVID-19 Pandemic.Front Psychol. 2021 Mar 16;12:646892. doi: 10.3389/fpsyg.2021.646892. eCollection 2021. Front Psychol. 2021. PMID: 33796057 Free PMC article. Review.
-
Modelling Voluntary General Population Vaccination Strategies during COVID-19 Outbreak: Influence of Disease Prevalence.Int J Environ Res Public Health. 2021 Jun 8;18(12):6217. doi: 10.3390/ijerph18126217. Int J Environ Res Public Health. 2021. PMID: 34201285 Free PMC article.
-
Exploring epidemic voluntary vaccinating behavior based on information-driven decisions and benefit-cost analysis.Appl Math Comput. 2023 Jun 15;447:127905. doi: 10.1016/j.amc.2023.127905. Epub 2023 Feb 12. Appl Math Comput. 2023. PMID: 36818690 Free PMC article.
-
Mass Testing and Proactiveness Affect Epidemic Spreading.J Indian Inst Sci. 2021;101(3):371-380. doi: 10.1007/s41745-021-00247-z. Epub 2021 Aug 6. J Indian Inst Sci. 2021. PMID: 34393389 Free PMC article. Review.
-
Perceptions towards COVID-19 and adoption of preventive measures among the public in Saudi Arabia: a cross sectional study.BMC Public Health. 2021 Jun 29;21(1):1251. doi: 10.1186/s12889-021-11223-8. BMC Public Health. 2021. PMID: 34187425 Free PMC article.
References
-
- World Health Organization. Immunization coverage. 2016 http://who.int/mediacentre/factsheets/fs378/en/
-
- Centers for Disease Control And Prevention. CDC’s Strategic Framework for Global Immunization, 2016–2020 Atlanta, GA: May 2016. http://www.cdc.gov/globalhealth/immunization
-
- Fenner F, Henderson DA, Arita I, Jezek AZ, Ladnyi ID. Smallpox and its Eradication. World Health Organization, Geneva.; 1988.
Publication types
MeSH terms
Substances
LinkOut - more resources
Full Text Sources
Medical

