. 2019 May 22;8(5):380-394.e4.
doi: 10.1016/j.cels.2019.04.003.

MultiPLIER: A Transfer Learning Framework for Transcriptomics Reveals Systemic Features of Rare Disease

Affiliations

MultiPLIER: A Transfer Learning Framework for Transcriptomics Reveals Systemic Features of Rare Disease

Jaclyn N Taroni et al. Cell Syst. .

Abstract

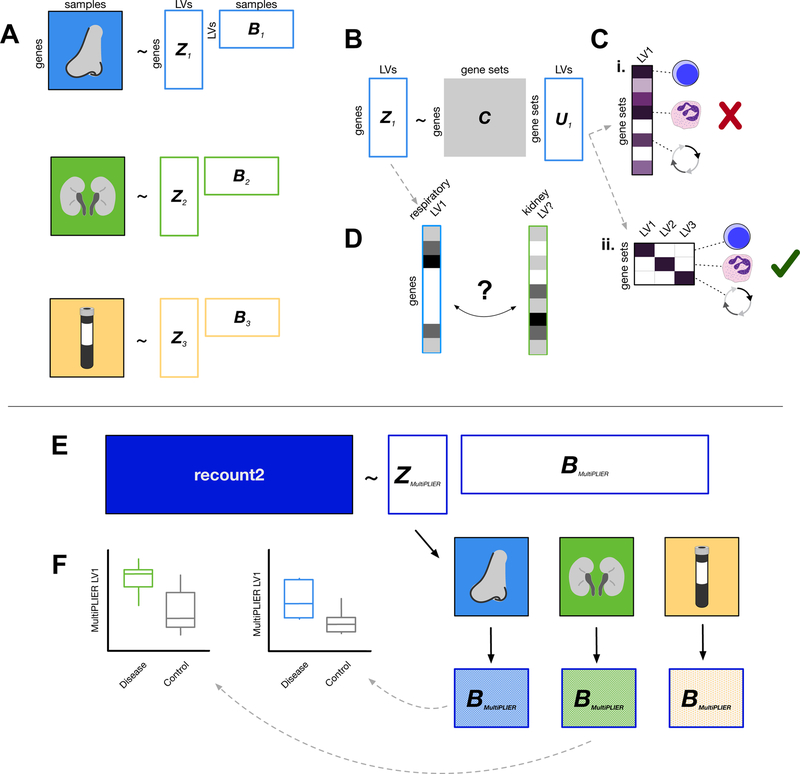
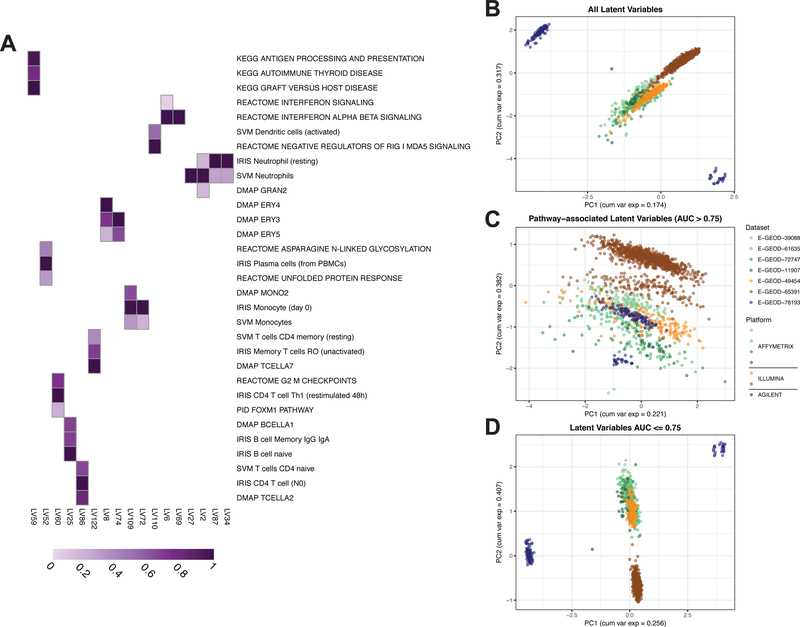
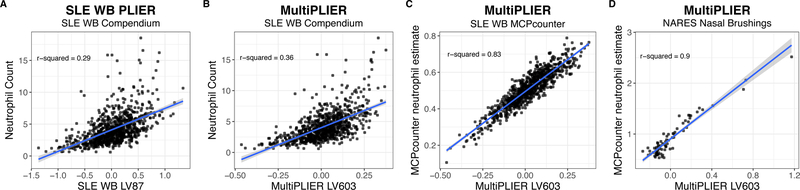
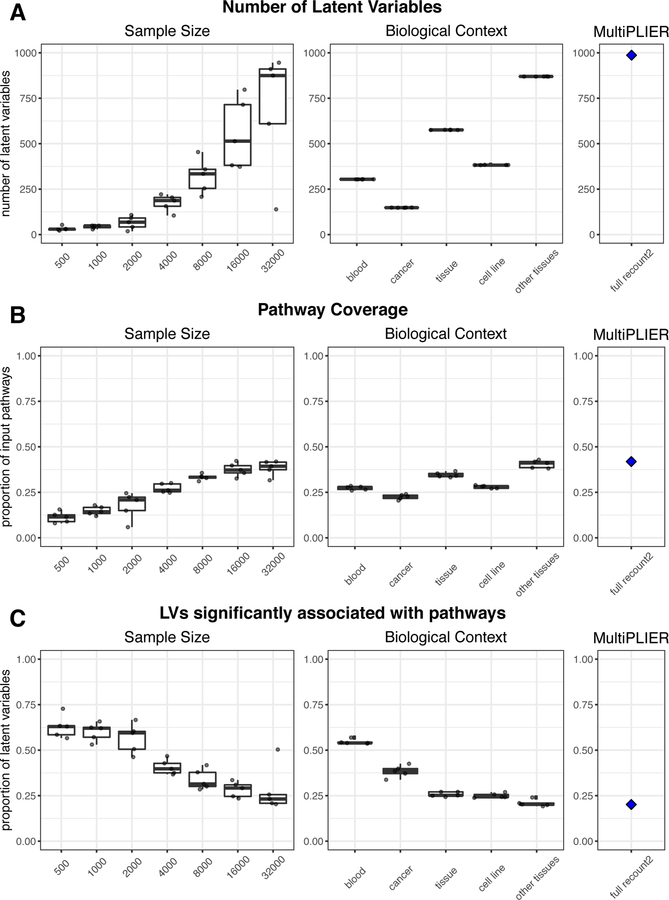
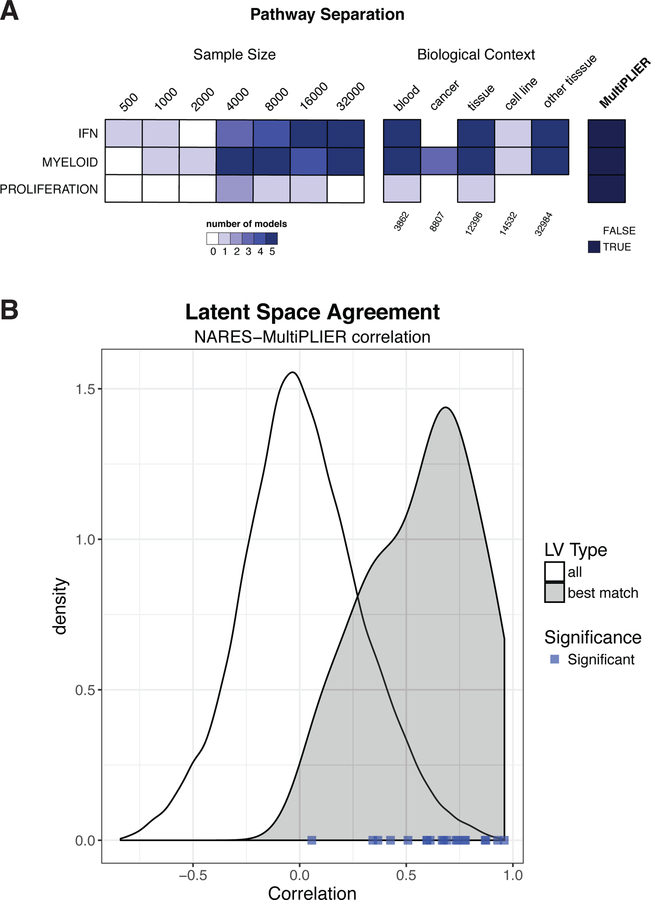
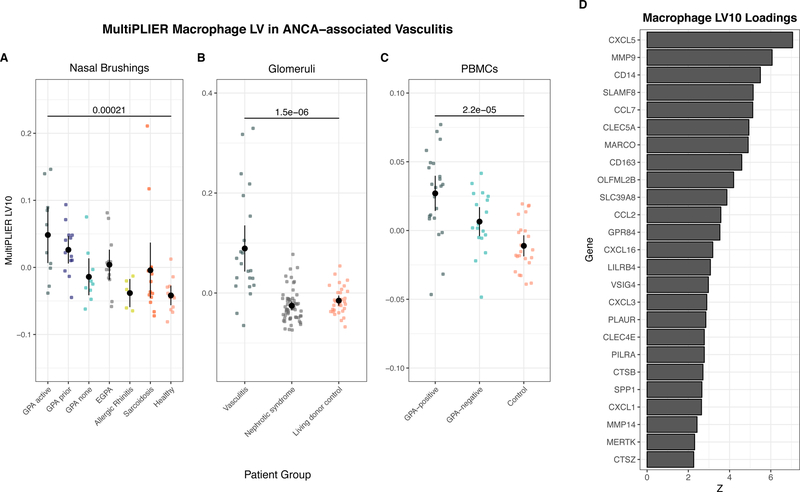
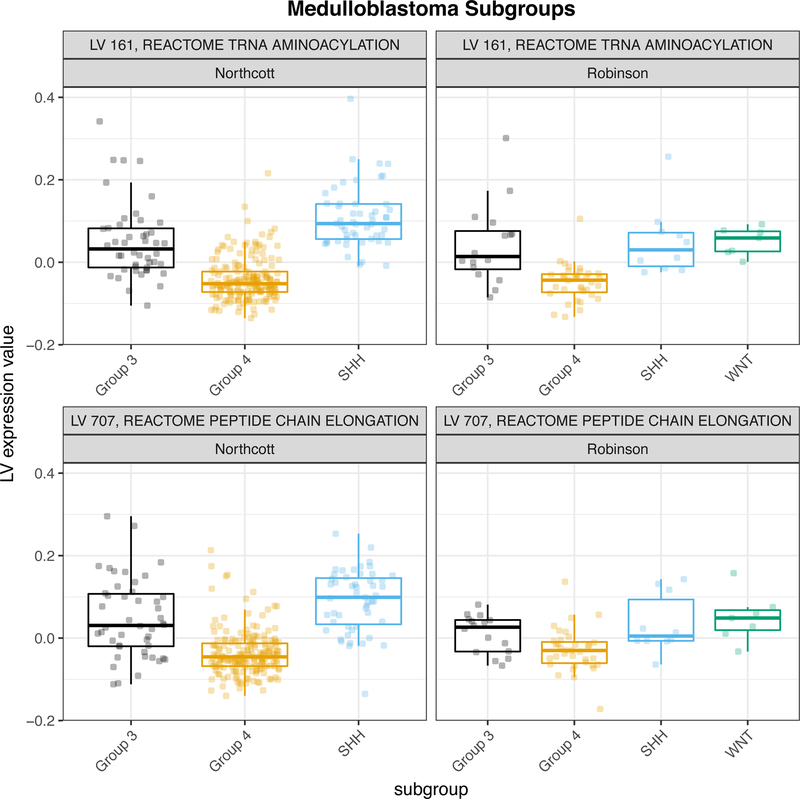
Most gene expression datasets generated by individual researchers are too small to fully benefit from unsupervised machine-learning methods. In the case of rare diseases, there may be too few cases available, even when multiple studies are combined. To address this challenge, we utilize transfer learning to extract coordinated expression patterns and use learned patterns to analyze small rare disease datasets. We trained a pathway-level information extractor (PLIER) model on a large public data compendium comprising multiple experiments, tissues, and biological conditions and then transferred the model to small datasets in an approach we call MultiPLIER. Models constructed from the public data compendium included features that aligned well to known biological factors and were more comprehensive than those constructed from individual datasets or conditions. When transferred to rare disease datasets, the models describe biological processes related to disease severity more effectively than models trained only on a given dataset.

Keywords: genomics; machine learning; medulloblastoma; rare diseases; transcriptomics; transfer learning; unsupervised learning; vasculitis.


Conflict of interest statement

DECLARATIONS OF INTERESTS

The authors declare no competing interests.

Figures

Figure 1.
Figure 1.. Overview of dataset-specific PLIER and MultiPLIER.
Boxes with solid colored fills represent inputs to the model. White boxes with colored outlines represent model output. (A) PLIER (Mao et al., 2017) automatically extracts latent variables (LVs), shown as the matrix B, and their loadings (Z). We can train PLIER model for each of three datasets from different tissues, which results in three dataset-specific latent spaces. (B) PLIER takes as input a prior information/knowledge matrix C and applies a constraint such that some of the loadings (Z) and therefore some of the latent variables capture biological signal in the form of curated pathways or cell type-specific gene sets. (C) Ideally, a latent variable will map to a single gene set or a group of highly related gene sets to allow for easy interpretation of the model. PLIER applies a penalty on U to facilitate this. Purple fill in a cell indicates a non-zero value and a darker purple indicates a higher value. We show an undesirable U matrix in the top toy example (Ci) and a favorable U matrix in the bottom toy example (Cii). (D) If models have been trained on individual datasets, we may be required to find “matching” latent variables in different dataset- or tissue-specific models using the loadings (Z) from each model. Using a metric like the Pearson correlation between loadings, we may or may not be able to find a well-correlated match between datasets. (E) The MultiPLIER approach: train a PLIER on a large collection of uniformly processed data from many different biological contexts and conditions (recount2; Collado-Torres et al., 2017)—a MultiPLIER model—and then project the individual datasets into the MultiPLIER latent space. The hatched fill indicates the sample dataset of origin. (F) Latent variables from the MultiPLIER model can be tested for differential expression between disease and controls in multiple tissues.
Figure 2.
Figure 2.. A PLIER model trained on a systemic lupus erythematosus (SLE) whole blood (WB) compendium learns SLE pathology-relevant latent variables and divides biological signal and technical noise.
(A) Selected latent variables (LVs) from the SLE WB PLIER U matrix. Purple fill in a cell indicates a non-zero value and a darker purple indicates a higher value. Only pathways with AUC > 0.75 in displayed latent variables are shown. Panels B-D display the first two PCs from different subsets of the latent space or B matrix. Points are samples. Samples are colored by dataset of origin and datasets from the same platform manufacturer are similar colors. (B) PC1 and PC2 from PCA on the entire B matrix illustrates a platform- or dataset-specific effect. (C) PC1 and PC2 from only pathway- or geneset-associated latent variables (LVs with AUC > 0.75 for at least one geneset) show a reduction in the technical variance evident in panel B. (D) PC1 and PC2 from only latent variables that do not have an association with an input geneset (all AUC <= 0.75) show a similar pattern to that of all latent variables. The dataset-specific effect in panels B and D is also observed in PCA on the gene-level gene expression data and at different AUC thresholds (Fig. S1).
Figure 3.
Figure 3.. MultiPLIER learns a neutrophil-associated latent variable (LV) that is well-correlated with neutrophil counts or estimates in multiple tissues and disease contexts.
(A) SLE WB LV87, LV87 from the PLIER model trained on the entire SLE WB compendium, can predict neutrophil count in Banchereau, et al. dataset (Banchereau et al., 2016) despite being entirely unsupervised with respect to this task. (B) The MultiPLIER neutrophil-associated latent variable (LV603) performs slightly better than the SLE WB-specific model. Here, the SLE WB compendium is projected into the MultiPLIER latent space. Recall that the MultiPLIER model has not been exposed to the specific technical variance found in the SLE WB compendium. (C) MultiPLIER LV603 values are highly correlated from a state-of-the-art method for estimating immune infiltrate, MCPcounter (Becht et al., 2016). This suggests that the modest correlation with neutrophil count in B is the result of estimating neutrophil, a terminally differentiated cell type, counts from transcriptome data, rather than a limitation of the MultiPLIER approach. (D) MultiPLIER performance is not limited to whole blood, as it is highly correlated with the MCPcounter neutrophil estimate in the NARES dataset (Grayson et al., 2015). NARES is a nasal brushing microarray dataset that includes patients with ANCA-associated vasculitis, patients with sarcoidosis and healthy controls among other groups and was projected into the MultiPLIER latent space.
Figure 4.
Figure 4.. Subsampling of the recount2 compendium demonstrates the contribution of both sample size and breadth of biological conditions to PLIER model characteristics.
PLIER models were trained on samples randomly selected from the recount2 compendium (sample size evaluations) or on a subset of the recount2 compendium mapped to the same ontology term in MetaSRA (Bernstein et al., 2017) (biological context evaluations; see STAR Methods for the specific terms used). The training set for each repeat in the biological context evaluations is comprised of the same samples, but initialized with different random seeds. The boxplot and points in black in A-C represent 5 repeats performed for each sample size or biological context. The blue diamonds and panels labeled MultiPLIER are the values from the full recount2 PLIER model (~37,000 samples). The sample size for each biological context training set is below the biological context heatmap in panel D; the biological contexts are ordered by increasing sample size in all panels. (A) The number of latent variables (k) in a model is generally dependent on sample size. However, the biological contexts where samples are expected to be comprised of a mix of cell types (e.g., blood and tissue) have a high number of latent variable (LV) than we would expect based on the sample size experiments. (B) The proportion of pathways supplied as input to the model that are significantly associated (FDR < 0.05) with at least one latent variable, termed pathway coverage, mirrors the number of latent variables in a model. (C) The proportion of latent variables that are significantly associated (FDR < 0.05) with at least one pathway or gene set generally decreases with sample size. The exceptions are models trained on blood, which is likely the most homogeneous of the training sets, and many gene sets supplied to the models during training are immune cell related which this training set is well-suited to capture. This suggests that increasing the sample size or breadth of the training set introduces more signal that is not biologically relevant, at least with respect to the pathways that have been supplied to the model.
Figure 5.
Figure 5.. MultiPLIER distinguishes related pathways and the latent space of the MultiPLIER model agrees with a dataset-specific PLIER model.
(A) Pathway separation results for three sets of related pathways: type I and type II interferon (IFN), neutrophil- and monocyte-/macrophage-related gene sets (MYELOID) and the G1 and G2 phases of the cell cycle (proliferation). Models were trained on either 5 randomly selected expression matrices of the same size (Sample Size) or on specific biological conditions with different random seeds (Biological Context). The cells of the heatmap are colored based on the number of models where separation for the related pathways is achieved or the presence or absence of separation in the MultiPLIER model. (There is only one MultiPLIER model.) (B) The latent space of the MultiPLIER model (no vasculitis data in the training set) shows agreement with the PLIER model trained on the NARES nasal brushing dataset (n = 79) particularly in the case of latent variables of biological significance. The best match for a NARES model latent variable was determined by identifying the latent variable (LV) in the MultiPLIER model with the most similar loadings (Pearson correlation of Z). NARES data was projected into the MultiPLIER latent space (B) and the Pearson correlation between B matrices (NARES, MultiPLIER) was calculated. Density plot of the latent variable expression value correlation coefficients between best match latent variables, shown in gray, demonstrates a rightward shift from the values for all pairs of latent variables between models (e.g., including random pairs of latent variables), shown in white. The blue points along the bottom of the graph represent best match correlation values for latent variables from the NARES model that are significantly associated (FDR < 0.05) with at least one gene set. This suggests that the values between latent variables that capture biological signal are particularly likely to be preserved in the transfer learning (MultiPLIER) case. Figure S6 shows the correlation values between best match latent variables alongside the correlation between loadings.
Figure 6.
Figure 6.. A MultiPLIER-learned latent variable associated with macrophages is differentially expressed in three tissues from ANCA-associated vasculitis (AAV) and shows increased expression in severe or active disease.
Differentially expressed latent variables (LVs) were identified by comparing all patient groups and using Benjamini-Hochberg correction (FDR). Latent variables with FDR < 0.05 were considered to be differentially expressed. MultiPLIER LV10 had an FDR < 0.05 in all three cohorts. (A-C) Jitter plots of MultiPLIER LV10 in three different tissues: nasal brushings (NARES dataset), kidney microdissected glomeruli, and peripheral blood mononuclear cells. Points and bars represent mean ± 2 * SEM. P-values are from a Wilcoxon rank sum test comparing the control group to the AAV group considered to have the most severe or active disease in the cohort. (D) The loadings of the top (highest weight) 25 genes for MultiPLIER LV10.
Figure 7.
Figure 7.. MultiPLIER latent variables associated with translation-related pathways are differentially expressed between subgroups in two medulloblastoma cohorts.
Differentially expressed latent variables (LVs) were identified by comparing all patient groups and using Benjamini-Hochberg correction (FDR). Latent variables with FDR < 0.05 were considered to be differentially expressed. Expression data and subgroup labels from (Northcott et al., 2012) and (Robinson et al., 2012).

Comment in

References

    1. Abbas AR, Baldwin D, Ma Y, Ouyang W, Gurney A, Martin F, Fong S, van Lookeren Campagne M, Godowski P, and Williams PM (2005). Immune response in silico (IRIS): immune-specific genes identified from a compendium of microarray expression data. Genes and Immunity 6, 319–331. - PubMed
    1. Allen GI, Grosenick L, and Taylor J (2013). A Generalized Least-Square Matrix Decomposition. Journal of the American Statistical Association 109, 145–159.
    1. Banchereau R, Hong S, Cantarel B, Baldwin N, Baisch J, Edens M, Cepika A-M, Acs P, Turner J, Anguiano E, et al. (2016). Personalized Immunomonitoring Uncovers Molecular Networks that Stratify Lupus Patients. Cell 165, 551–565. - PMC - PubMed
    1. Barrett T, Wilhite SE, Ledoux P, Evangelista C, Kim IF, Tomashevsky M, Marshall KA, Phillippy KH, Sherman PM, Holko M, et al. (2012). NCBI GEO: archive for functional genomics data sets—update. Nucleic Acids Research 41, D991–D995. - PMC - PubMed
    1. Becht E, Giraldo NA, Lacroix L, Buttard B, Elarouci N, Petitprez F, Selves J, Laurent-Puig P, Sautès-Fridman C, Fridman WH, et al. (2016). Estimating the population abundance of tissue-infiltrating immune and stromal cell populations using gene expression. Genome Biol. 17, 218. - PMC - PubMed

Publication types