. 2019 Jul 1:410:217-238.
doi: 10.1016/j.neuroscience.2019.05.008. Epub 2019 May 21.

Functional Connectivity of the Parasubiculum and Its Role in Temporal Lobe Epilepsy

Affiliations

Functional Connectivity of the Parasubiculum and Its Role in Temporal Lobe Epilepsy

Thomas Sullenberger et al. Neuroscience. .

Abstract

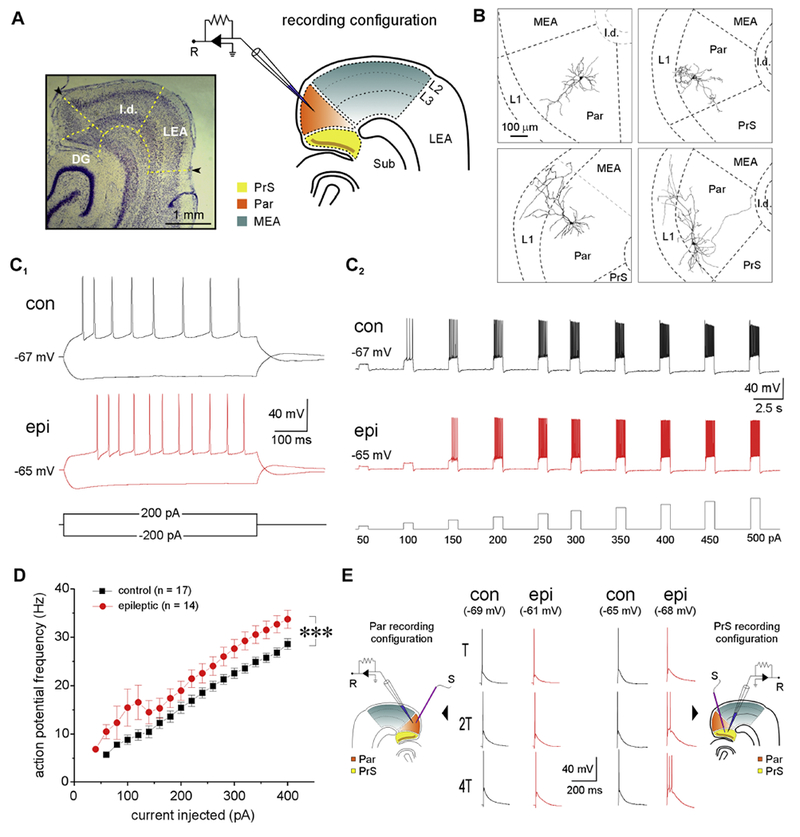
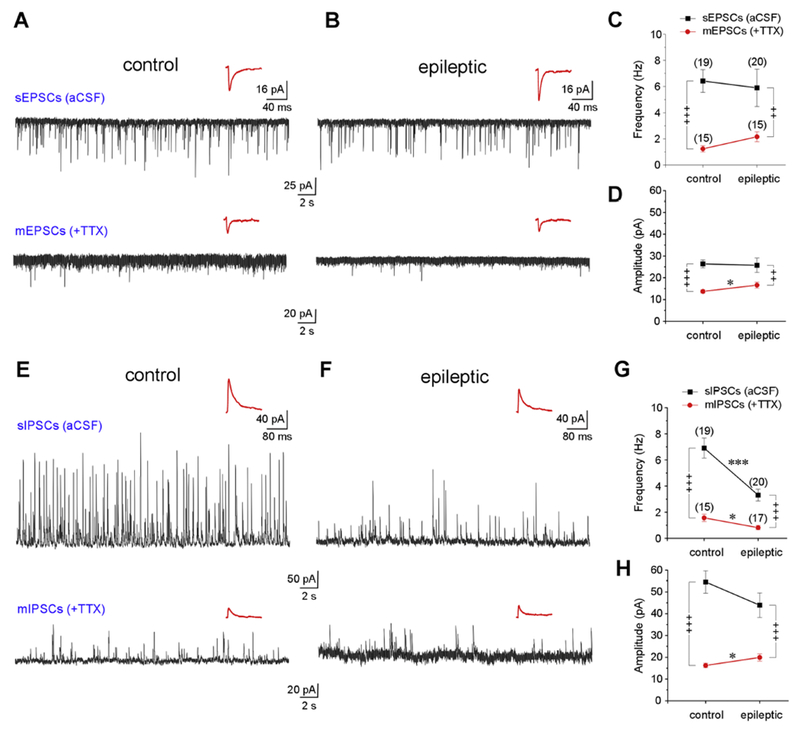
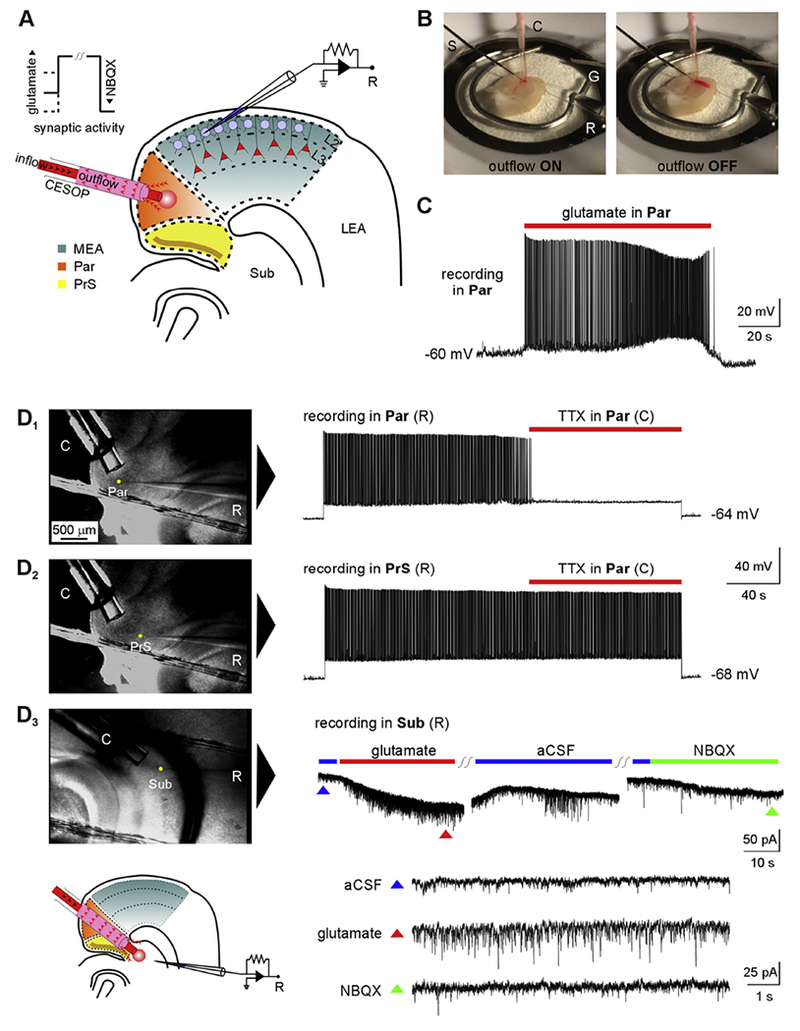
Temporal lobe epilepsy (TLE) is the commonest of adult epilepsies, often refractory to antiepileptic medications, whose prevention and treatment rely on understanding basic pathophysiological mechanisms in interlinked structures of the temporal lobe. The medial entorhinal area (MEA) is affected in TLE but mechanisms underlying hyperexcitability of MEA neurons require further elucidation. Previous studies have examined the role of the presubiculum (PrS) in mediating MEA pathophysiology but not the juxtaposed parasubiculum (Par). Here, we report on an electrophysiological assessment of the cells and circuits of the Par, their excitability under normal and epileptic conditions, and alterations in functional connectivity with neighboring PrS and MEA using the rat pilocarpine model of TLE. We show that Par, unlike the cell heterogeneous PrS, has a single dominant neuronal population whose excitability under epileptic conditions is altered by changes in both intrinsic properties and synaptic drive. These neurons experience significant reductions in synaptic inhibition and perish under chronic epileptic conditions. Connectivity between brain regions was deduced through changes in excitatory and inhibitory synaptic drive to neurons recorded in one region upon focal application of glutamate followed by NBQX to neurons in another using a microfluidic technique called CESOP and TLE-related circuit reorganization was assessed using data from normal and epileptic animals. The region-specific changes in Par and neighboring PrS and MEA together with their unexpected interactions are of significance in identifying ictogenic cells and circuits within the parahippocampal region and in unraveling pathophysiological mechanisms underlying TLE.

Keywords: CESOP; MEA; TLE; hyperexcitability; parasubiculum; presubiculum.


Figures

Figure 1
Figure 1
Electrophysiological profile of regular spiking (RS) cells in the Par under control and epileptic conditions. A, representative thionin-stained brain section and schematic indicating relative locations of the parasubiculum (Par), presubiculum (PrS), medial entorhinal area (MEA), lateral entorhinal area (LEA), lamina dissecans (l.d.), subiculum (Sub) and dentate gyrus (DG) at the level of the hippocampus. Brain regions used for electrophysiological recordings (R) are color-coded for easy reference. B, representative Neiirohicida reconstructions of biocytin-filled neurons in Par highlighting dendritic morphology. C, action potential (AP) discharge profile of RS cells in Par from control (con) and epileptic (epi) rats in response to hyper- and depolarizing current injections (±200 pA at resting Vm, 600 ms) (C1) and in response to current injections of increasing amplitude (50 – 500 pA; increments: 50 pA; duration: 800 ms; interval: 3s) (C2). Note the hyperexcitability of the neuron under epileptic conditions despite an increased rheobase and latency to fire action potentials. D, plot of instantaneous AP firing frequency as a function of current injected (20 – 400 pA; increments: 20 pA; duration: 600 ms) in control and epileptic animals. Each point on the plot is an ensemble average of the indicated number of neurons and error bars, where these are bigger than the size of the symbols used, represent SEM. E, action potentials evoked in RS cells (at resting Vm) from Par (left) and PrS (right, (Abbasi and Kumar, 2014)) in response to local electrical stimulation (S) at threshold (T) and increasing multiples of T. Note that RS cells in the PrS, but not Par, fire multiple APs when stimulated under epileptic conditions. ***p < 0.001, one-way repeated measures ANOVA.
Figure 2
Figure 2
Excitatory and inhibitory synaptic drive to RS cells in control and epileptic rats. A-D, Excitatory synaptic drive to Par neurons in epileptic rats is similar to controls. A, B voltage-clamp recordings (1 min-long) of spontaneous (s) (in aCSF, top) and miniature (m) (in TTX, bottom) EPSCs (inward events recorded at −70 mV holding potential) in control and epileptic animals. C, D plots of averaged frequency and amplitude of s- and mEPSCs in control and epileptic animals. E-H, inhibitory synaptic drive to Par neurons is significantly diminished in epileptic rats. E, F voltage-clamp recordings of s- and mIPSCs (outward events recorded at 0 mV holding potential) in control and epileptic animals. G, H, plots of averaged frequency and amplitude of s- and mIPSCs in control and epileptics. Insets (A-B, E-F) are composite averages of all detectable events in a given trace (below). Error bars, where these are bigger than the size of the symbols used, represent SEM. Statistical significance between control and epileptic groups, * p < 0.05; ** p < 0.01; *** p < 0.001, t-test; before and after TTX comparisons, + p < 0.05, ++ p < 0.01, +++ p < 0.001, paired t-test.
Figure 3
Figure 3
Concomitant ejection and suction of perfusate (CESOP) – a technique for focal application of drugs in submerged brain slices. A, schematic of the CESOP system. The red circle represents the perfusate applied via CESOP while recording from stellate cells in LII of MEA. B, CESOP in action as previously published (Abbasi and Kumar, 2015). Dye-laden aCSI (for visualization and calibration) is localized to the Par when CESOP is activated (left) but diffuses away when outflow is turned off (right) during focal application of perfusate to the region in a brain slice submerged in aCSF (electrodes: S, stimulation; C, CESOP; G, ground; R, recording). C, sustained AP discharge triggered in a RS cell of Par in response to focal application of glutamate (100 μm) via CESOP. D1-2; DIC images (left) of recorded neurons in Par (D1) and PrS (D2) showing differential effects of focal TTX (1 μm) application in Par using CESOP on AP discharge of RS cells in the respective regions evoked by depolarizing current injections (right). Resting membrane potentials in recorded neurons are indicated juxtaposed to the respective traces. D3, Whole-cell voltage-clamp recordings from a subicular neuron in response to application of glutamate and NBQX via CESOP in the subiculum (Sub). Colored triangles in the panel (below) correspond to time-expanded views of regions indicated in the original recording (above).
Figure 4
Figure 4
Assaying PrS→Par interactions using CESOP. Schematic (top left) of the recording configuration showing location of recording (R) and CESOP electrodes. A-B, Voltage-clamp recordings of EPSCs (inward events at −70 mV holding potential) from Par neurons in control (A) and epileptic (B) rats while perfusing the indicated compounds in PrS (top: aCSF; middle: 100 μm glutamate; bottom: 10 μm NBQX) sequentially; insets (A-B) are composite averages of all detectable events in a given trace (below). C-D, plots of averaged frequency (C) and amplitude (D) as a function of the experimental condition for EPSCs during 1 min-long recordings from control and epileptic animals. E-F, Voltage-clamp recordings of IPSCs (outward events at 0 mV holding potential) from Par neurons in control (E) and epileptic (F) rats while perfusing the indicated compound in the PrS; insets (E-F) are composite averages of all detectable events in a given trace (below). G-H, plots of averaged frequency (G) and amplitude (H) as a function of the experimental condition for IPSCs during 1 min-long recordings from control and epileptic animals. Schematic (top) is an interim summary of all PrS→Par interactions gleaned from the electrophysiological data under control (left) and epileptic (right) conditions. PrS-mediated synaptic inhibition but not excitation of Par neurons is compromised under epileptic conditions. For this and all subsequent figures error bars, where these are bigger than the size of the symbols used, represent SEM. Statistical significance between control and epileptic groups, *p < 0.05; ** p < 0.01; *** p < 0.001, t-test; before and after comparisons, † p < 0.05, †† p < 0.01, ††† P < 0.001, paired t-test.
Figure 5
Figure 5
Assaying Par→PrS (LII) interactions using CESOP. Schematic (top left) of the recording configuration showing location of recording (R) and CESOP electrodes. PrS connectivity in this and all subsequent figures as previously published (Abbasi and Kumar, 2015). A-B, Voltage-clamp recordings of EPSCs (inward events at −70 mV holding potential) from LII PrS neurons in control (A) and epileptic (B) rats while perfusing the indicated compounds in Par (top: aCSF; middle: 100 μm glutamate; bottom: 10 μm NBQX) sequentially; insets (A-B) are composite averages of all detectable events in a given trace (below). C-D, plots of averaged frequency (C) and amplitude (D) as a function of the experimental condition for EPSCs during 1 min-long recordings from control and epileptic animals. E-F, Voltage-clamp recordings of IPSCs (outward events at 0 mV holding potential) from LII PrS neurons in control (E) and epileptic (F) rats while perfusing the indicated compound in the Par; insets (E-F) are composite averages of all detectable events in a given trace (below). G-H, plots of averaged frequency (G) and amplitude (H) as a function of the experimental condition for IPSCs during 1 min-long recordings from control and epileptic animals. Schematic (top) is an interim summary of all Par→PrS (LII) interactions gleaned from the electrophysiological data under control (left) and epileptic (right) conditions. The Par and PrS (LII) are not synaptically connected with each other.
Figure 6
Figure 6
Assaying Par→PrS (LIII) interactions using CESOP. Schematic (top left) of the recording configuration showing location of recording (R) and CESOP electrodes. A-B, Voltage-clamp recordings of EPSCs (inward events at −70 mV holding potential) from PrS (LIII) neurons in control (A) and epileptic (B) rats while perfusing the indicated compounds in Par (top: aCSF; middle: 100 μm glutamate; bottom: 10 μm NBQX) sequentially; insets (A-B) are composite averages of all detectable events in a given trace (below). C-D, plots of averaged frequency (C) and amplitude (D) as a function of the experimental condition for EPSCs during 1 min-long recordings from control and epileptic animals. E-F, Voltage-clamp recordings of IPSCs (outward events at 0 mV holding potential) from PrS (LIII) neurons in control (E) and epileptic (F) rats while perfusing the indicated compound in the Par; insets (E-F) are composite averages of all detectable events in a given trace (below). G-H, plots of averaged frequency (G) and amplitude (H) as a function of the experimental condition for IPSCs during 1 min-long recordings from control and epileptic animals. Schematic (top) is an interim summary of all Par→PrS (LIII) interactions gleaned from the electrophysiological data under control (left) and epileptic (right) conditions. Par-mediated synaptic excitation and inhibition of LIII neurons in PrS is compromised in epileptic animals.
Figure 7
Figure 7
Assaying Par→MEA (LII) interactions using CESOP. Schematic (top left) of the recording configuration showing location of recording (R) and CESOP electrodes. A-B, Voltage-clamp recordings of EPSCs (inward events at −70 mV holding potential) from stellate cells in LII of MEA in control (A) and epileptic (B) rats while perfusing the indicated compounds in Par (top: aCSF; middle: 100 μm glutamate; bottom: 10 μm NBQX) sequentially; insets (A-B) are composite averages of all detectable events in a given trace (below). C-D, plots of averaged frequency (C) and amplitude (D) as a function of the experimental condition for EPSCs during 1 min-long recordings from control and epileptic animals. E-F, Voltage-clamp recordings of IPSCs (outward events at 0 mV holding potential) from stellate cells in LII of MEA in control (E) and epileptic (F) rats while perfusing the indicated compound in the Par; insets (E-F) are composite averages of all detectable events in a given trace (below). G-H, plots of averaged frequency (G) and amplitude (H) as a function of the experimental condition for IPSCs during 1 min-long recordings from control and epileptic animals. Schematic (top) is an interim summary of all Par→MEA (LII) interactions gleaned from the electrophysiological data under control (left) and epileptic (right) conditions. Par contributes more to LII stellate cell inhibition in the MEA than excitation.
Figure 8
Figure 8
Assaying Par→MEA (LIII) interactions using CESOP. Schematic (top left) of the recording configuration showing location of recording (R) and CESOP electrodes. A-B, Voltage-clamp recordings of EPSCs (inward events at −70 mV holding potential) from pyramidal cells in LIII of MEA in control (A) and epileptic (B) rats while perfusing the indicated compounds in Par (top: aCSF; middle: 100 μm glutamate; bottom: 10 μm NBQX) sequentially; insets (A-B) are composite averages of all detectable events in a given trace (below). C-D, plots of averaged frequency (C) and amplitude (D) as a function of the experimental condition for EPSCs during 1 min-long recordings from control and epileptic animals. E-F, Voltage-clamp recordings of IPSCs (outward events at 0 mV holding potential) from pyramidal cells in LIII of MEA in control (E) and epileptic (F) rats while perfusing the indicated compound in the Par; insets (E-F) are composite averages of all detectable events in a given trace (below). G-H, plots of averaged frequency (G) and amplitude (H) as a function of the experimental condition for IPSCs during 1 min-long recordings from control and epileptic animals. Schematic (top) is an interim summary of all Par→MEA (LIII) interactions gleaned from the electrophysiological data under control (left) and epileptic (right) conditions. Par-mediated inhibition of pyramidal neurons in LIII of MEA is compromised in TLE.
Figure 9
Figure 9
Evidence for cell loss in Par of epileptic rats. A1, a composite of confocally-acquired tile scan images of z-stacked, maximally-projected optical sections (range: 150 μm; increment: 10 μm; ×63 magnification) of acute brain slices processed for NeuN immunofluorescence (white arrows indicate pial surface). A2, a mosaic of confocal images highlighting the regions used for cell counting (Par, blue; LIII MEA, yellow). A3, a sample tile from the composite image (A2, red border) showing somata of the cells counted (red dots) along with the exclusion (purple) and inclusion (green) boundaries used. B, bar plot of the averaged NeuN-positive cells per mm2 in Par and LIII of MEA (internal control). **p < 0.01, ***p < 0.001, t-test.
Figure 10
Figure 10
Synthesis of CESOP data from interim summary Figures 4 through 8 highlighting detailed functional connectivity between Par, PrS, and MEA in control (left) and epileptic (right) animals. Note that single fiber projections are depicted as monosynaptic for illustrative purposes.

References

    1. Abbasi S, Kumar SS (2013), Electrophysiological and morphological characterization of cells in superficial layers of rat presubiculum. J Comp Neurol 521:3116–3132. - PubMed
    1. Abbasi S, Kumar SS (2014), Regular-spiking cells in the presubiculum are hyperexcitable in a rat model of temporal lobe epilepsy. J Neurophysiol 112:2888–2900. - PMC - PubMed
    1. Abbasi S, Kumar SS (2015), Layer-specific modulation of entorhinal cortical excitability by presubiculum in a rat model of temporal lobe epilepsy. J Neurophysiol 114:2854–2866. - PMC - PubMed
    1. Alonso A, Llinas RR (1989), Subthreshold Na+-dependent theta-like rhythmicity in stellate cells of entorhinal cortex layer II. Nature 342:175–177. - PubMed
    1. Bear J, Fountain NB, Lothman EW (1996), Responses of the superficial entorhinal cortex in vitro in slices from naive and chronically epileptic rats. J Neurophysiol 76:2928–2940. - PubMed