. 2019 Jun;18(12):1349-1363.
doi: 10.1080/15384101.2019.1617615. Epub 2019 May 23.

A tension-independent mechanism reduces Aurora B-mediated phosphorylation upon microtubule capture by CENP-E at the kinetochore

Affiliations

A tension-independent mechanism reduces Aurora B-mediated phosphorylation upon microtubule capture by CENP-E at the kinetochore

Carmen Taveras et al. Cell Cycle. 2019 Jun.

Abstract

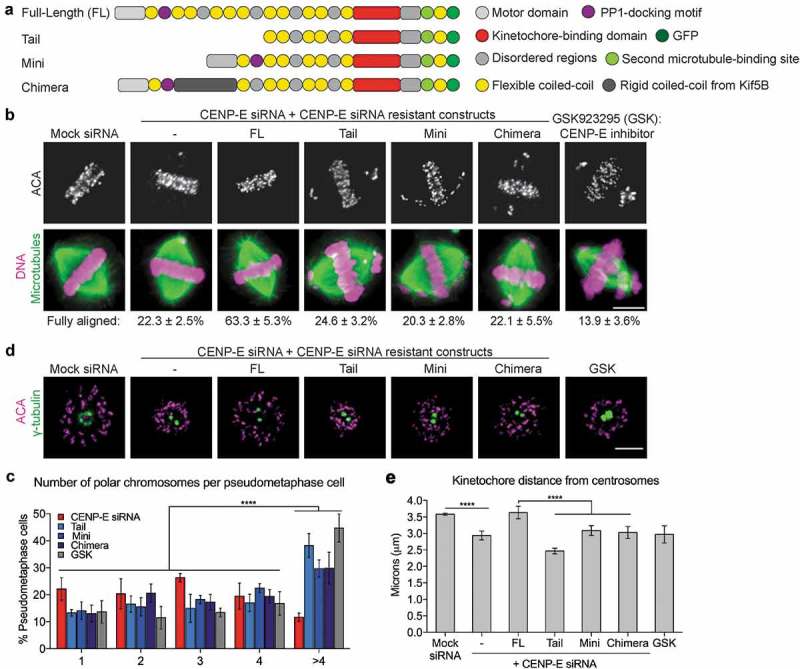
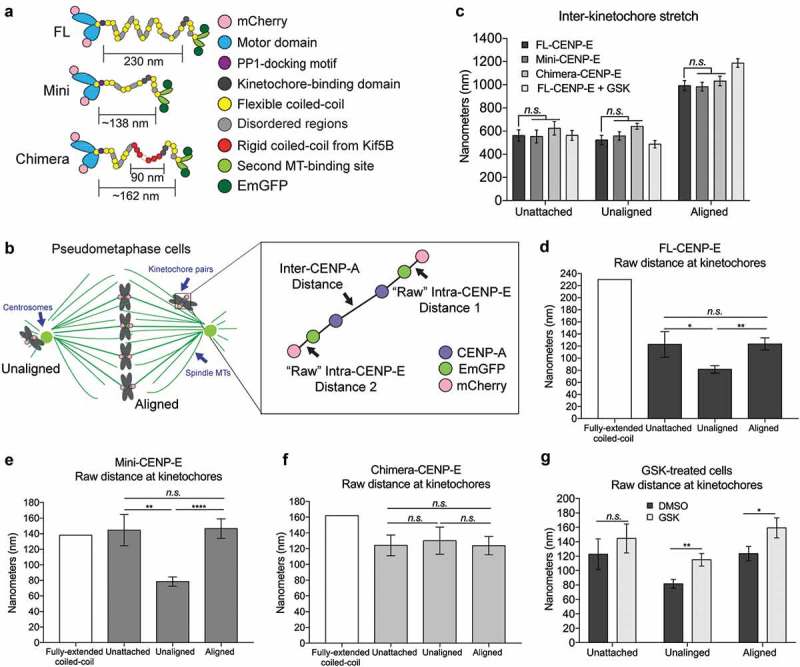
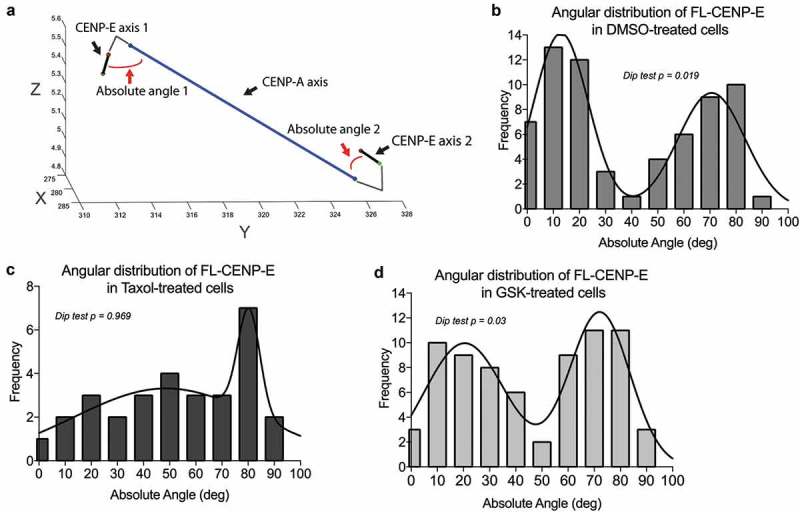
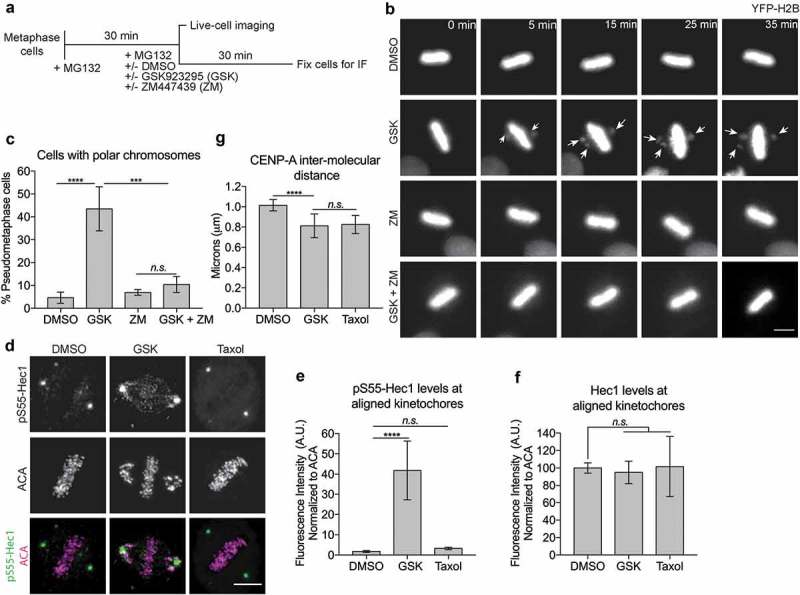
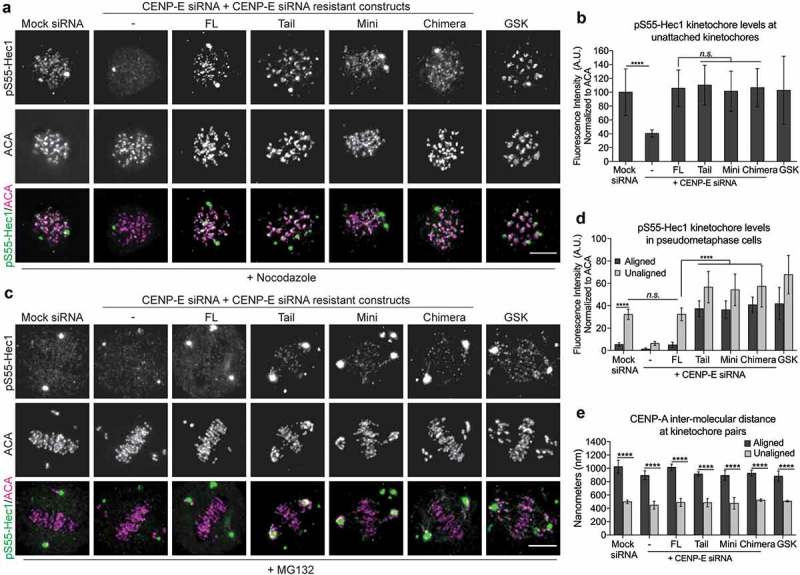
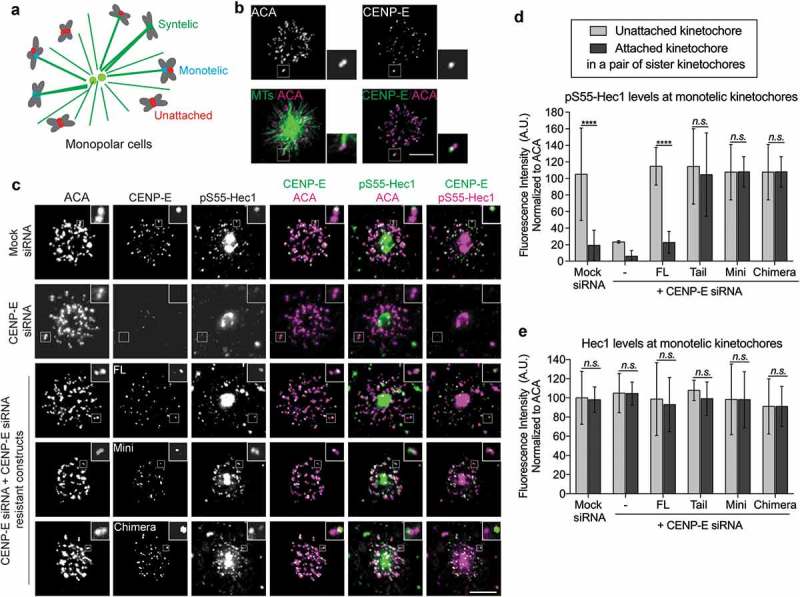
During mitosis, Aurora B kinase is required for forming proper bi-oriented kinetochore-microtubule attachments. Current models suggest that tension exerted between a pair of sister-kinetochores (inter-kinetochore stretch) produces a spatial separation of Aurora B kinase from kinetochore-associated microtubule binding substrates, such as the Knl1-Mis12-Ndc80 (KMN) network, resulting in a decrease of phosphorylation and, thus, an increase of affinity for microtubules. Using Single-Molecule High-Resolution Colocalization (SHREC) microscopy analysis of the kinetochore-associated motor CENP-E, we now show that CENP-E undergoes structural rearrangements prior to and after tension generation at the kinetochore, and displays a bi-modal Gaussian distribution on a pair of bi-oriented sister kinetochores. The conformational change of CENP-E depends on its microtubule-stimulated motor motility and the highly flexible coiled-coil between its motor and kinetochore-binding tail domains. Chemical inhibition of the motor motility or perturbations of the coiled-coil domain of CENP-E increases Aurora B-mediated Ndc80 phosphorylation in a tension-independent manner. Metaphase chromosome misalignment caused by CENP-E inhibition can be rescued by chemical inhibition of Aurora B kinase. Furthermore, a pair of monotelic sister-kinetochores shows asymmetric levels of Aurora B-mediated phosphorylation in mono-polar spindles depending on CENP-E motor activity. These results collectively suggest a tension-independent mechanism to reduce Aurora B-mediated phosphorylation of outer kinetochore components in response to microtubule capture by CENP-E.

Keywords: Aurora B; CENP-E; chromosome; kinetochore; microtubule; mitosis.


Figures

Figure 1.
Figure 1.
The long and highly flexible coiled-coil domain of CENP-E is essential for its kinetochore function. (a) Illustration (not drawn to scale) of GFP-tagged CENP-E constructs generated in this study. (b) Mini- and Chimera-CENP-E cannot rescue chromosome alignment defects caused by depletion of endogenous CENP-E. Immunofluorescence images were acquired using antibodies against centromere (ACA, a centromere/kinetochore marker, in upper panels) and tubulin (microtubules in lower panels) in human T98G cells. DNA was visualized by DAPI in lower panels. The percentage (mean ± SD) of mitotic cells with fully aligned chromosomes from three independent experiments are summarized (Mock siRNA: n = 644, CENP-E siRNA: n = 680, FL: n = 699, Tail: n = 621, Mini: n = 458, Chimera: n = 614, and CENP-E inhibitor GSK923295 (GSK) n = 686 cells). Scale bar, 5 μm. (c) Expressing Tail-, Mini-, and Chimera-CENP-E as well as inhibition of CENP-E motor activity have dominant negative effects on chromosome misalignment compared to CENP-E depletion. Histogram showing the number of polar chromosomes per metaphase cell (mean ± SD from three independent experiments) in cells co-transfected with the CENP-E siRNA and CENP-E constructs as indicated (CENP-E siRNA: n = 272, Tail: n = 376, Mini: n = 186, Chimera: n = 324, and GSK: n = 404). Two-way ANOVA followed by a Tukey’s multiple comparison test was used to compare the means (**** p < 0.0001). (d) The long and flexible coiled-coil is required for CENP-E motor activity. Immunofluorescence images of monastrol-treated cells expressing CENP-E constructs in cells depleted of endogenous CENP-E or treated with GSK923295 as indicated. Spindle poles and kinetochores were stained using antibodies against γ-tubulin and ACA, respectively. Scale bar, 5 μm. (e) Quantification (Mean ± SD from three independent experiments) of the distance of kinetochores from centrosomes shown in (d) (n = 30 cells per each condition). An unpaired t test or a One-way ANOVA followed by a Sidak’s multiple comparison test was used to compare the means (****p < 0.0001).
Figure 2.
Figure 2.
Differential features of CENP-E’s coiled-coil domain and motor domain activity mediate the structural rearrangement of CENP-E. (a) Illustration (not drawn to scale) of transgenes used for CENP-E structural rearrangement analysis at the kinetochore. (b) Illustration (not drawn to scale) of pseudo-metaphase cells depicting unaligned and aligned kinetochores used to analyze the inter-kinetochore distance of CENP-A and intra-kinetochore distance between CENP-E motor and tail domains. (c) Inhibition of CENP-E motility does not affect inter-kinetochore stretch (tension). Quantification (mean ± SD of three independent experiments) of the inter-CENP-A distance at unattached kinetochores in nocodazole treated cells and bi-oriented kinetochores (aligned) and unaligned kinetochores in pseudo-metaphase cells (Unattached, FL: n = 15, Mini: n = 15, and Chimera: n = 16; Unaligned DMSO, FL: n = 36, Mini: n = 33, Chimera: n = 32, and GSK: n = 33; and Aligned DMSO, FL: n = 33, Mini: n = 30, Chimera n = 33; and GSK: n = 36). Two-way ANOVA followed by a Tukey’s multiple comparisons test was used to compare the means (n.s., not significant). (d-f) Both the length and the flexibility of the coiled-coil domain affect CENP-E conformation at the kinetochore in response to different microtubule attachment status. Bar graph (mean ± SEM of three independent experiments) showing the predicted distance (white) along with the measured distance between N-terminal mCherry and C-terminal EmGFP tags (intra-CENP-E) on a single kinetochore in cells expressing (d) FL-, (e) Mini- and (f) Chimera-CENP-E constructs as indicated. In (d), unattached: n = 30, unaligned: n = 72, and aligned: n = 66. In (e), unattached: n = 30, unaligned: n = 66, and aligned: n = 60. In (f), unattached: n = 32, unaligned: n = 66, and aligned: n = 66. One-way ANOVA followed by a Tukey’s multiple comparisons test was used to compare the means (* p < 0.05, ** p < 0.01, **** p < 0.0001, and n.s., not significant). (g) CENP-E motor activity triggers CENP-E conformational changes upon microtubules capture. Bar graph (mean ± SEM of three independent experiments) showing the distance between CENP-E motor domain and tail domain at unattached, unaligned and aligned kinetochores of cells treated with DMSO or GSK923295 (GSK) (Unattached kinetochores, DMSO: n = 30 and GSK: n = 32; unaligned kinetochores, DMSO: n = 72 and GSK: n = 78; and aligned kinetochores, DMSO: n = 66 and GSK: n = 72). An unpaired t test was used to compare the means (* p < 0.05, ** p < 0.01, and n.s., not significant).
Figure 3.
Figure 3.
CENP-E displays a two-state conformation on bi-oriented kinetochores depending on microtubule dynamics and CENP-E motor activity. (a) Representative plots of CENP-E axis and CENP-A axis in a 3-dimensinoal space used to calculate the angular distribution of CENP-E along the kinetochore (CENP-A) axis. The red lines are representative lines depicting how the angular distribution was measured based on the CENP-E’s motor-to-tail axis and CENP-A-to-CENP-A axis in a sister kinetochore pair. Axes are shown in pixel (pixel = 67.1875 nm). (b–d) Angular distribution of FL-CENP-E in T98G cells treated with (b) DMSO, (c) Taxol and (d) GSK from three independent experiments (DMSO: n = 66, Taxol: n = 30, and GSK: n = 72). Plotted lines represent the robust non-linear regression fitting assuming the sum of two Gaussian distribution. The corresponding p-values from a Hartigans’ dip test analysis for multi-modality are shown (p values below 0.05 indicate the distribution is, at least, bimodal).
Figure 4.
Figure 4.
Maintaining low levels of Aurora B-mediated phosphorylation on attached kinetochores depends on the motor motility of CENP-E. (a) Schematic representation of chemical inhibition treatments protocol. (b) Aurora B inhibition can rescue chromosome misalignment caused by inhibition of CENP-E motility. Representative still frames of live-cell imaging of HeLa cells stably expressing YFP-H2B treated with or without a CENP-E inhibitor, GSK923295 (GSK), and an Aurora B inhibitor, ZM447439 (ZM), as indicated. Arrows indicate misaligned chromosomes. Scale bar, 20 μm. (c) Quantification (mean ± SD of three independent experiments) of T98G metaphase cells with fully aligned chromosomes or pseudo-metaphase cells with polar chromosomes after drug treatment (DMSO: n = 465, GSK: n = 487, ZM: n = 328, and GSK + ZM: n = 332). One-way ANOVA followed by a Tukey’s multiple comparison test was used to compare the means (*** p < 0.001, ****p < 0.0001, and n.s., not significant). (d) Inhibition of CENP-E motility results in an increase of Aurora B-mediated Hec1 phosphorylation. Immunofluorescence images showing Hec1 phosphorylation (pS55-Hec1) and ACA (anti-centromere antigen as the kinetochore marker) at aligned kinetochores. Scale bar, 5 μm. (e) Inhibition of CENP-E motor activity, but not microtubule dynamics, results in an increase of Aurora B-mediated phosphorylation of Hec1. Quantification (mean ± SD of three independent experiments) of normalized integrated intensity of pS55-Hec1 signals against ACA signals (DSMO: n = 223, GSK: n = 244, and Taxol: n = 202) on aligned kinetochores at the metaphase plate. One-way ANOVA followed by a Tukey’s multiple comparison test was used to compare the means (****p < 0.0001 and n.s., not significant). (f) Inhibition of CENP-E motor activity or microtubule dynamics does not affect kinetochore recruitment of Hec1. Quantification (mean ± SD of three independent experiments) of normalized integrated intensity of Hec1 signals against ACA signals on aligned kinetochores at the metaphase plate. More than 200 aligned kinetochores per group were quantified. An unpaired t test was used to compare the means (n.s., not significant). (g) A slight reduction of inter-kinetochore stretch (tension) caused by inhibition of CENP-E motor activity can be achieved by inhibition of microtubule dynamics. Quantification (mean ± SD of three independent experiments) of the distance between sister-kinetochore pairs (inter-kinetochore stretch) (DSMO: n = 215, GSK: n = 240, and Taxol: n = 214). One-way ANOVA followed by a Tukey’s multiple comparison test was used to compare the means (****p < 0.0001 and n.s., not significant).
Figure 5.
Figure 5.
Maintaining low levels of Aurora B-mediated phosphorylation of outer kinetochore components on attached kinetochores depends on flexible conformational changes of CENP-E. (a) CENP-E tail domain is essential for Aurora B-mediated phosphorylation of Hec1 on unattached kinetochores. Immunofluorescence analysis of pS55-Hec1 and ACA in nocodazole treated T98G cells depleted of endogenous CENP-E, or expressing FL-CENP-E or CENP-E mutants as indicated. Scale bar, 5 μm. (b) Quantification (mean ± SD of three independent experiments) of the normalized integrated intensities of the kinetochore signals of pS55-Hec1/ACA (Mock siRNA: n = 215, CENP-E siRNA: n = 222, FL: n = 219, Tail: n = 203, Mini: n = 226, Chimera: n = 230, and GSK n = 212). An unpaired t test or a One-way ANOVA followed by a Tukey’s multiple comparison test was used to compare the means (****p < 0.0001 and n.s., not significant). (c) Cells expressing Full-length CENP-E, but not Tail-, Mini-, or Chimera-CENP-E, can maintain low levels of Hec1 phosphorylation on bi-oriented kinetochores. Immunofluorescence analysis of pS55-Hec1 and ACA in MG132-treated pseudo-metaphase T98G cells. Scale bar, 5 μm. (d) Quantification (mean ± SD of three independent experiments) of the normalized integrated intensities of the kinetochore signals of pS55-Hec1/ACA on aligned and unaligned kinetochores (aligned, Mock siRNA: n = 249, CENP-E siRNA: n = 233, FL: n = 193, Tail: n = 207, Mini: n = 197, Chimera: n = 171, and GSK n = 215; unaligned, Mock siRNA: n = 119, CENP-E siRNA: n = 199, FL: n = 100, Tail: n = 134, Mini: n = 118, Chimera: n = 191, and GSK n = 223). An unpaired t test or a One-way ANOVA followed by a Tukey’s multiple comparison test was used to compare the means (****p < 0.0001 and n.s., not significant). (e) CENP-E is not required for inter-kinetochore stretch (tension) upon bio-orientation. Quantification (mean ± SD of three independent experiments) of distance between sister kinetochore pairs (inter-CENP-A stretch) of aligned and unaligned kinetochores. More than 30 kinetochores pairs per group were quantified. An unpaired t test or a One-way ANOVA followed by a Tukey’s multiple comparison test was used to compare the means (****p < 0.0001).
Figure 6.
Figure 6.
A tension-independent mechanism to reduce Aurora B phosphorylation at the kinetochore upon microtubule capture by CENP-E. (a) Diagram depicting the three types of microtubule-kinetochore attachments in monastrol-treated cells. (b) CENP-E levels are asymmetric in monotelic-attached sister-kinetochore pairs. Immunofluorescence images of monastrol-treated cells were stained with antibodies against CENP-E, ACA, and tubulin (microtubules). Scale bar, 5 μm. Insets represent a pair of monotelic-attached sister kinetochores. (c) The levels of pS55-Hec1 are asymmetric in monotelic-attached sister-kinetochore pairs, which depends on normal CENP-E function. Monastrol-treated cells were stained with antibodies against ACA, CENP-E, and pS55-Hec1. Scale bar, 5 μm. Insets represent a pair of monotelic-attached sister kinetochores. (d) Quantification (mean ± SD of three independent experiments) of normalized integrated fluorescence intensity of pS55-Hec1/ACA signals on monotelic kinetochores (Mock siRNA: n = 49, CENP-E siRNA: n = 50, FL: n = 39, Tail: n = 32, Mini: n = 42, and Chimera: n = 35). An unpaired t test was used to compare the means (****p < 0.0001 and n.s., not significant). (e) Quantification (mean ± SD of three independent experiments) of normalized integrated fluorescence intensity of Hec1/ACA signals on monotelic kinetochores (Mock siRNA: n = 35, CENP-E siRNA: n = 31, FL: n = 32, Tail: n = 31, Mini: n = 32, and Chimera: n = 31). An unpaired t test was used to compare the means (n.s., not significant).

Similar articles

Cited by

References

    1. Lampson MA, Cheeseman IM.. Sensing centromere tension: Aurora B and the regulation of kinetochore function. Trends Cell Biol. 2011;21:133–140. - PMC - PubMed
    1. Walczak CE, Heald R. Mechanisms of mitotic spindle assembly and function. Int Rev Cytol. 2008;265:111–158. - PubMed
    1. Yoo TY, Choi JM, Conway W, et al. Measuring NDC80 binding reveals the molecular basis of tension-dependent kinetochore-microtubule attachments. Elife. 2018;7:e36392. - PMC - PubMed
    1. Saurin AT. Kinase and phosphatase cross-talk at the kinetochore. Front Cell Dev Biol. 2018;6:62. - PMC - PubMed
    1. Kapoor TM, Lampson MA, Hergert P, et al. Chromosomes can congress to the metaphase plate before biorientation. Science. 2006;311:388–391. - PMC - PubMed

Publication types

MeSH terms