

Differential color development and response to light deprivation of fig (Ficus carica L.) syconia peel and female flower tissues: transcriptome elucidation
- PMID: 31122203
- PMCID: PMC6533723
- DOI: 10.1186/s12870-019-1816-9
Differential color development and response to light deprivation of fig (Ficus carica L.) syconia peel and female flower tissues: transcriptome elucidation
Abstract
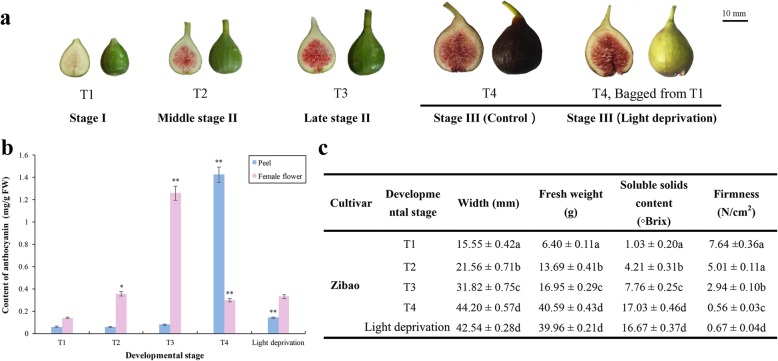
Background: Color directly affects fruit quality and consumer preference. In fig syconia, the female flower tissue is contained in a receptacle. Anthocyanin pigmentation of this tissue and the peel differs temporally and spatially. A transcriptome study was carried out to elucidate key genes and transcription factors regulating differences in fig coloring.
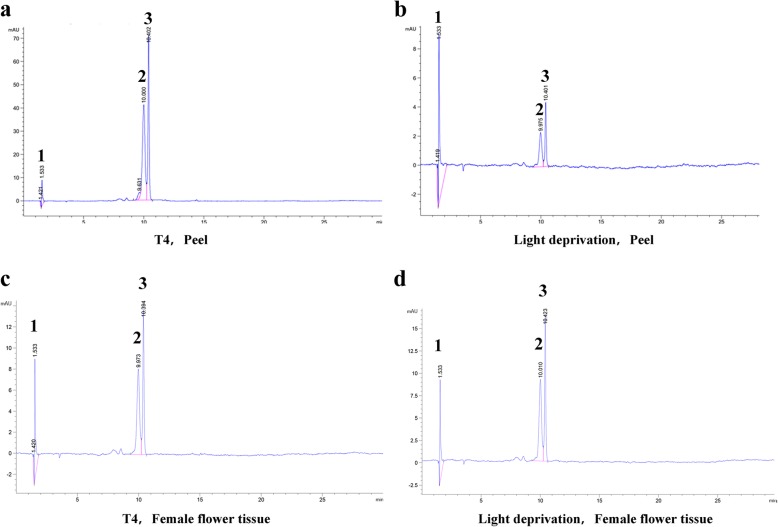
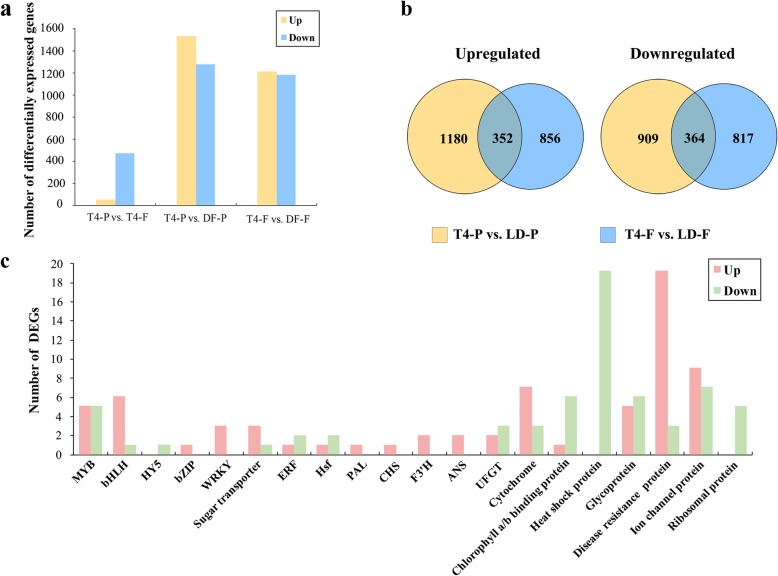
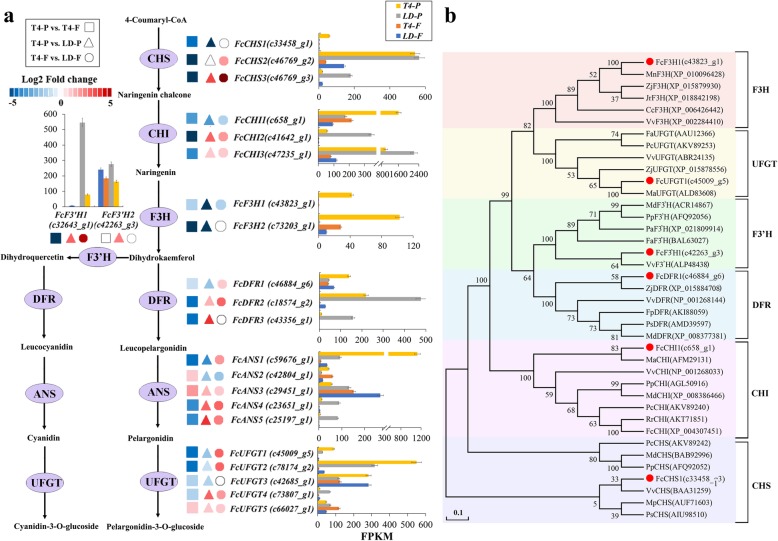
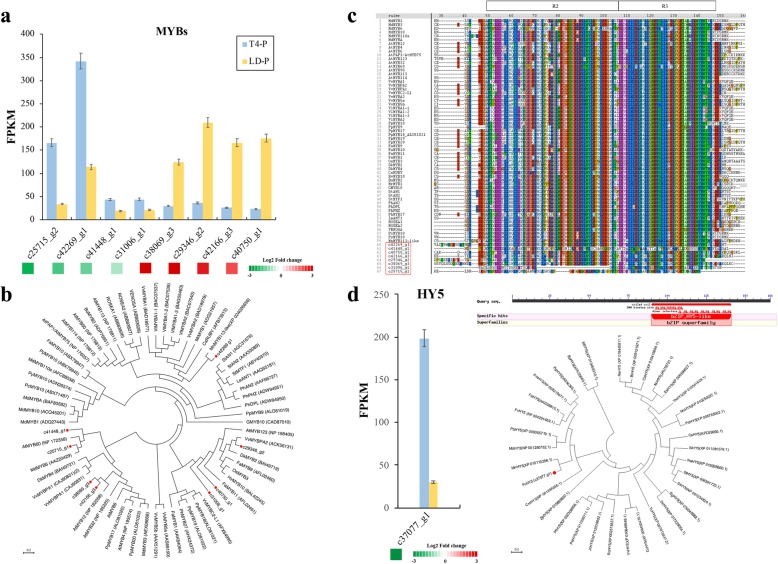
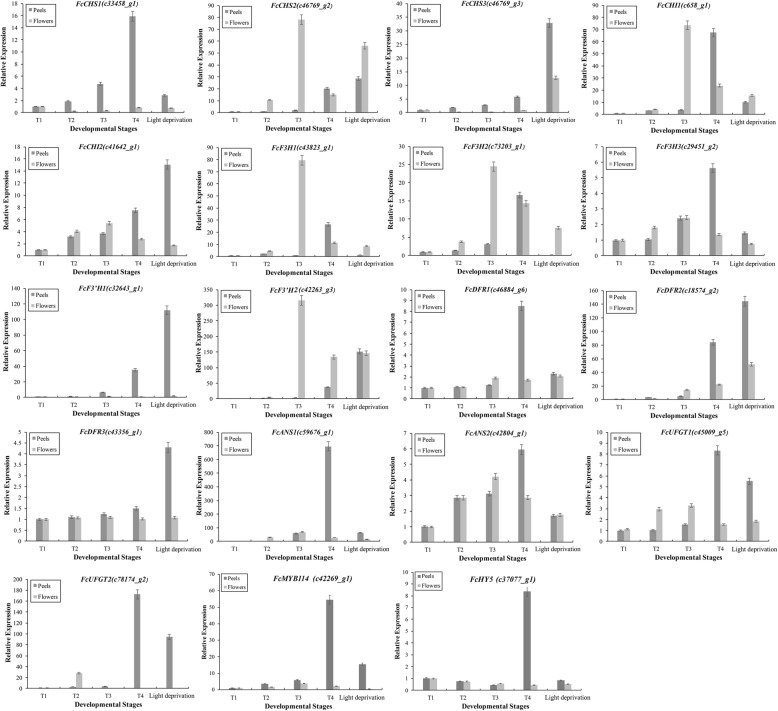
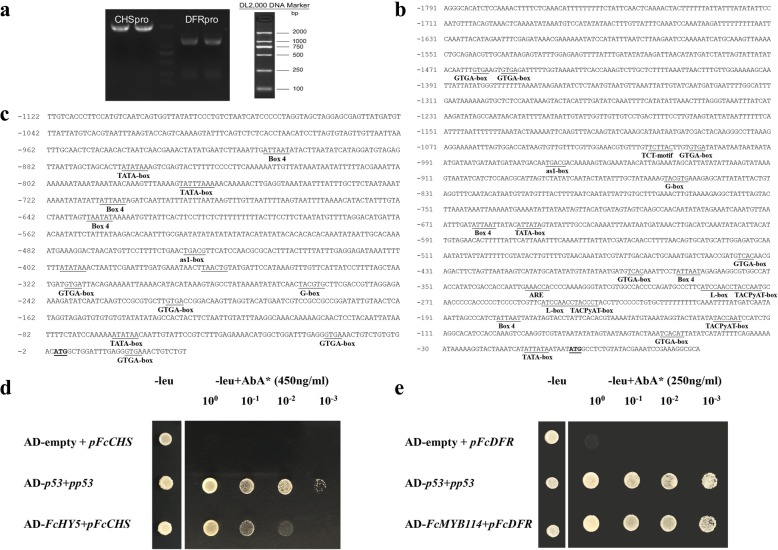
Results: Anthocyanins in the female flower tissue were identified mainly as pelargonidin-3-glucoside and cyanidin-3-rutinoside; in the peel, the major anthocyanins were cyanidin 3-O-glucoside and cyanidin-3-rutinoside. Anthocyanin content was significantly higher in the female flower tissue vs. peel before fig ripening, whereas at ripening, the anthocyanin content in the peel was 5.39 times higher than that in the female flower tissue. Light-deprivation treatment strongly inhibited peel, but not female flower tissue, anthocyanin pigmentation. RNA-Seq revealed 522 differentially expressed genes (recruited with criteria log2 ≥ 2 and P < 0.05) at fig ripening, with 50 upregulated and 472 downregulated genes in the female flower tissue. Light deprivation upregulated 1180 and downregulated 856 genes in the peel, and upregulated 909 and downregulated 817 genes in the female flower tissue. KEGG enrichment revealed significantly changed expression in the phenylpropanoid-biosynthesis and flavonoid-biosynthesis pathways in the peel, but not in the female flower tissue, with significant repression of FcCHS, FcCHI, FcF3H, FcF3'H, FcDFR and FcUFGT transcripts. Light deprivation led to differential expression of 71 and 80 transcription factor genes in the peel and female flower tissue, respectively. Yeast one-hybrid screen revealed that FcHY5 and FcMYB114 bind the promoter regions of FcCHS and FcDFR, respectively in the flavonoid-biosynthesis pathway.
Conclusions: Phenylpropanoid- and flavonoid-biosynthesis pathways were differentially expressed spatially and temporally in the peel and female flower tissue of fig syconia; pathway expression in the peel was strongly regulated by light signal. Differentially expressed transcription factors were recruited as candidates to screen important expression regulators in the light-dependent and light-independent anthocyanin-synthesis pathway. Our study lays the groundwork for further elucidation of crucial players in fig pigmentation.
Keywords: Anthocyanin biosynthesis; Differentially expressed gene; Female flower tissue; Fig (Ficus carica L,); Fruit peel; Light deprivation; RNA-Seq; Transcription factor.
Conflict of interest statement
The authors declare that they have no competing interests.
Figures
Similar articles
-
Anthocyanin accumulation is initiated by abscisic acid to enhance fruit color during fig (Ficus carica L.) ripening.J Plant Physiol. 2020 Aug;251:153192. doi: 10.1016/j.jplph.2020.153192. Epub 2020 Jun 2. J Plant Physiol. 2020. PMID: 32554070
-
Ethephon induces coordinated ripening acceleration and divergent coloration responses in fig (Ficus carica L.) flowers and receptacles.Plant Mol Biol. 2021 Mar;105(4-5):347-364. doi: 10.1007/s11103-020-01092-x. Epub 2020 Nov 13. Plant Mol Biol. 2021. PMID: 33185823
-
Cytokinin-induced parthenocarpy of San Pedro type fig (Ficus carica L.) main crop: explained by phytohormone assay and transcriptomic network comparison.Plant Mol Biol. 2019 Mar;99(4-5):329-346. doi: 10.1007/s11103-019-00820-2. Epub 2019 Jan 17. Plant Mol Biol. 2019. PMID: 30656555
-
Genome-wide in silico identification of glutathione S-transferase (GST) gene family members in fig (Ficus carica L.) and expression characteristics during fruit color development.PeerJ. 2023 Jan 25;11:e14406. doi: 10.7717/peerj.14406. eCollection 2023. PeerJ. 2023. PMID: 36718451 Free PMC article. Review.
-
Why Black Flowers? An Extreme Environment and Molecular Perspective of Black Color Accumulation in the Ornamental and Food Crops.Front Plant Sci. 2022 Apr 14;13:885176. doi: 10.3389/fpls.2022.885176. eCollection 2022. Front Plant Sci. 2022. PMID: 35498642 Free PMC article. Review.
Cited by
-
Genome-Wide Characterization and Analysis of bHLH Transcription Factors Related to Anthocyanin Biosynthesis in Fig (Ficus carica L.).Front Plant Sci. 2021 Oct 8;12:730692. doi: 10.3389/fpls.2021.730692. eCollection 2021. Front Plant Sci. 2021. PMID: 34691109 Free PMC article.
-
Transcriptomic Analysis of Ficus carica Peels with a Focus on the Key Genes for Anthocyanin Biosynthesis.Int J Mol Sci. 2020 Feb 13;21(4):1245. doi: 10.3390/ijms21041245. Int J Mol Sci. 2020. PMID: 32069906 Free PMC article.
-
Metabolome and transcriptome analysis of flavor components and flavonoid biosynthesis in fig female flower tissues (Ficus carica L.) after bagging.BMC Plant Biol. 2021 Aug 25;21(1):396. doi: 10.1186/s12870-021-03169-1. BMC Plant Biol. 2021. PMID: 34433422 Free PMC article.
-
Revealing VCAN as a Potential Common Diagnostic Biomarker of Renal Tubules and Glomerulus in Diabetic Kidney Disease Based on Machine Learning, Single-Cell Transcriptome Analysis and Mendelian Randomization.Diabetes Metab J. 2025 May;49(3):407-420. doi: 10.4093/dmj.2024.0233. Epub 2025 Jan 24. Diabetes Metab J. 2025. PMID: 39849979 Free PMC article.
-
Evaluating the Impacts of Climate Factors and Flavonoids Content on Chinese Prickly Ash Peel Color Based on HPLC-MS and Structural Equation Model.Foods. 2022 Aug 22;11(16):2539. doi: 10.3390/foods11162539. Foods. 2022. PMID: 36010539 Free PMC article.
References
-
- Zhang Q, Hao R, Xu Z, Yang W, Wang J, Cheng T, et al. Isolation and functional characterization of a R2R3-MYB regulator of Prunus mume anthocyanin biosynthetic pathway. Plant Cell Tissue Organ Cult. 2017;131(3):1–13. doi: 10.1007/s11240-017-1294-4. - DOI
MeSH terms
Substances
Grants and funding
LinkOut - more resources
Full Text Sources
