

Spirometric assessment of emphysema presence and severity as measured by quantitative CT and CT-based radiomics in COPD
- PMID: 31122243
- PMCID: PMC6533715
- DOI: 10.1186/s12931-019-1049-3
Spirometric assessment of emphysema presence and severity as measured by quantitative CT and CT-based radiomics in COPD
Abstract
Background: The mechanisms underlying airflow obstruction in COPD cannot be distinguished by standard spirometry. We ascertain whether mathematical modeling of airway biomechanical properties, as assessed from spirometry, could provide estimates of emphysema presence and severity, as quantified by computed tomography (CT) metrics and CT-based radiomics.
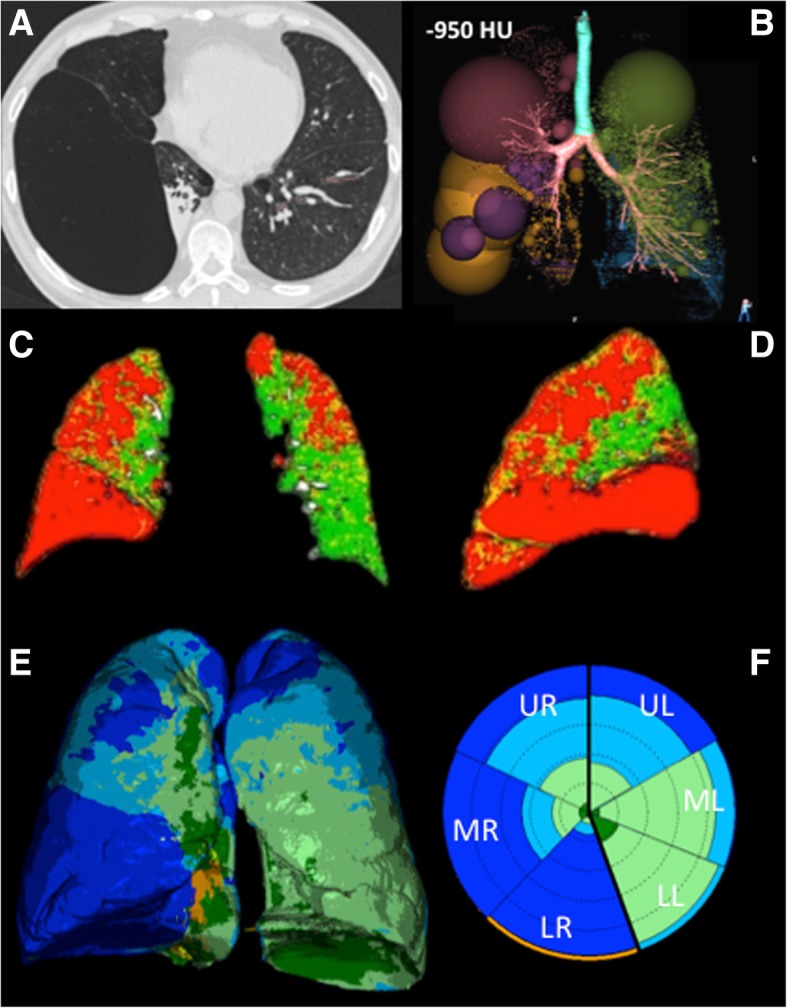
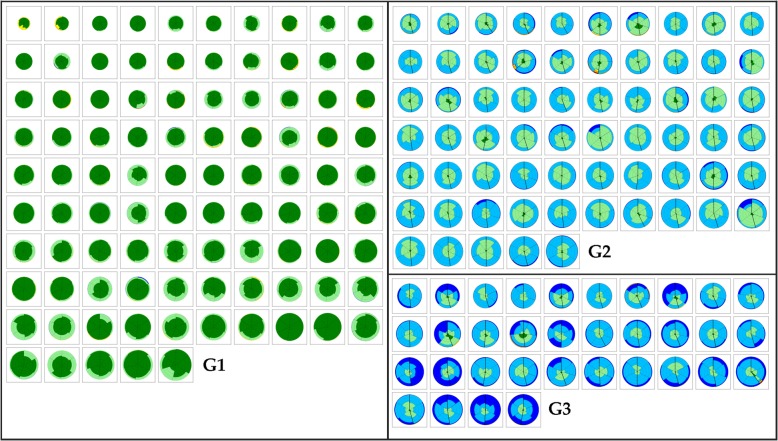
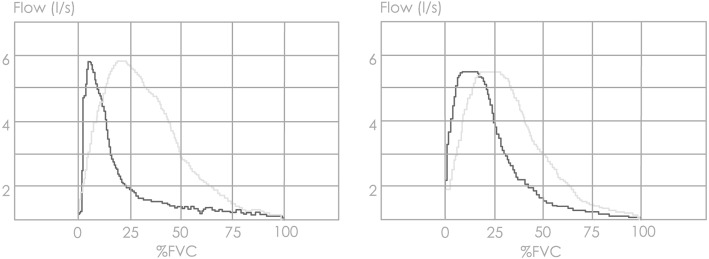
Methods: We quantified presence and severity of emphysema by standard CT metrics (VIDA) and co-registration analysis (ImbioLDA) of inspiratory-expiratory CT in 194 COPD patients who underwent pulmonary function testing. According to percentages of low attenuation area below - 950 Hounsfield Units (%LAA-950insp) patients were classified as having no emphysema (NE) with %LAA-950insp < 6, moderate emphysema (ME) with %LAA-950insp ≥ 6 and < 14, and severe emphysema (SE) with %LAA-950insp ≥ 14. We also obtained stratified clusters of emphysema CT features by an automated unsupervised radiomics approach (CALIPER). An emphysema severity index (ESI), derived from mathematical modeling of the maximum expiratory flow-volume curve descending limb, was compared with pulmonary function data and the three CT classifications of emphysema presence and severity as derived from CT metrics and radiomics.
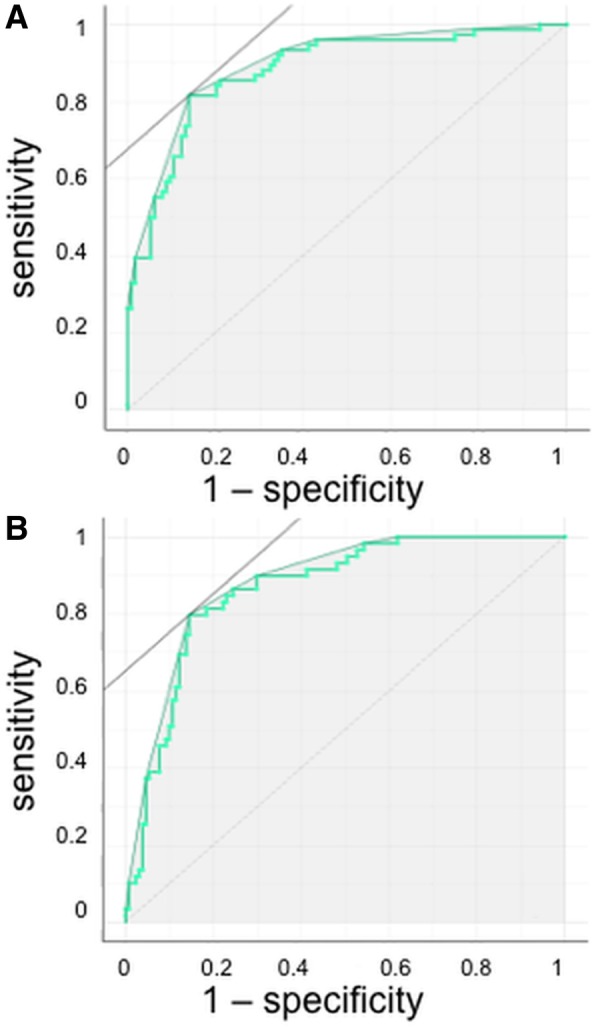
Results: ESI mean values and pulmonary function data differed significantly in the subgroups with different emphysema degree classified by VIDA, ImbioLDA and CALIPER (p < 0.001 by ANOVA). ESI differentiated NE from ME/SE CT-classified patients (sensitivity 0.80, specificity 0.85, AUC 0.86) and SE from ME CT-classified patients (sensitivity 0.82, specificity 0.87, AUC 0.88).
Conclusions: Presence and severity of emphysema in patients with COPD, as quantified by CT metrics and radiomics can be estimated by mathematical modeling of airway function as derived from standard spirometry.
Keywords: Area under curve; COPD; Pulmonary emphysema; Radiomics; Respiratory function tests; Small airway disease; Spirometry; Tomography.
Conflict of interest statement
Dr. Occhipinti reports personal fees from Imbio LLC, grants from Menarini Foundation, outside the submitted work.
Dr. Bartholmai reports personal fees from Promedior, LLC, and from Imbio, LLC, outside the submitted work. Mayo Clinic has received grants from NIH/NHLBI, fees from Imbio, LLC, and Boehringer Ingelheim outside the submitted work. In addition, Dr. Bartholmai has a patent SYSTEMS AND METHODS FOR ANALYZING IN VIVO TISSUE VOLUMES USING MEDICAL IMAGING pending to Mayo Clinic.
Dr. Karwoski reports other from Imbio Inc., outside the submitted work.
Dr. Lavorini reports personal fees from Chiesi Farmaceutici, grants and personal fees from Menarini International, personal fees from GlaxoSmithKline, personal fees from Boehringer Ingelheim, personal fees from Orion Pharma, personal fees from Novartis, outside the submitted work.
Dr. Pistolesi reports grants from MINISTRY OF HEALTH OF ITALY, grants from MINISTRY OF UNIVERSITY AND RESEARCH OF ITALY, during the conduct of the study; personal fees and non-financial support from GSK, grants, personal fees and non-financial support from MENARINI, personal fees and non-financial support from BOEHRINGER IINGELHEIM, personal fees and non-financial support from ASTRAZENECA, personal fees and non-financial support from CHIESI, grants, personal fees and non-financial support from MUNDIPHARMA, personal fees and non-financial support from BIOFUTURA, grants, personal fees and non-financial support from NOVARTIS, personal fees and non-financial support from GUIDOTTI MALESCI, personal fees from MENARINI INTERNATIONAL, grants from SANOFI, grants and personal fees from MSD, personal fees and non-financial support from GRIFOLS, grants from BAYER, outside the submitted work.
M Paoletti, SR, CN, ARL, RI, GC, SC have no competing interests.
Figures
Similar articles
-
Validation of a method to assess emphysema severity by spirometry in the COPDGene study.Respir Res. 2020 May 1;21(1):103. doi: 10.1186/s12931-020-01366-4. Respir Res. 2020. PMID: 32357885 Free PMC article.
-
Total Airway Count on Computed Tomography and the Risk of Chronic Obstructive Pulmonary Disease Progression. Findings from a Population-based Study.Am J Respir Crit Care Med. 2018 Jan 1;197(1):56-65. doi: 10.1164/rccm.201704-0692OC. Am J Respir Crit Care Med. 2018. PMID: 28886252
-
Association of pectoralis muscle area on computed tomography with airflow limitation severity and respiratory outcomes in COPD: A population-based prospective cohort study.Pulmonology. 2025 Dec 31;31(1):2416782. doi: 10.1016/j.pulmoe.2023.02.004. Epub 2024 Nov 14. Pulmonology. 2025. PMID: 36907812
-
Quantitative computed tomography measurements to evaluate airway disease in chronic obstructive pulmonary disease: Relationship to physiological measurements, clinical index and visual assessment of airway disease.Eur J Radiol. 2016 Nov;85(11):2144-2151. doi: 10.1016/j.ejrad.2016.09.010. Epub 2016 Sep 13. Eur J Radiol. 2016. PMID: 27776670 Free PMC article. Review.
-
Computed-tomography findings of emphysema: correlation with spirometric values.Curr Opin Pulm Med. 2008 Mar;14(2):110-4. doi: 10.1097/MCP.0b013e3282f3f18f. Curr Opin Pulm Med. 2008. PMID: 18303419 Review.
Cited by
-
Quantitative CT parameters correlate with lung function in chronic obstructive pulmonary disease: A systematic review and meta-analysis.Front Surg. 2023 Jan 4;9:1066031. doi: 10.3389/fsurg.2022.1066031. eCollection 2022. Front Surg. 2023. PMID: 36684267 Free PMC article. Review.
-
Validation of a method to assess emphysema severity by spirometry in the COPDGene study.Respir Res. 2020 May 1;21(1):103. doi: 10.1186/s12931-020-01366-4. Respir Res. 2020. PMID: 32357885 Free PMC article.
-
What is worth measuring in patients with COPD?Multidiscip Respir Med. 2025 Feb 3;20(1):1010. doi: 10.5826/mrm.2025.1010. Multidiscip Respir Med. 2025. PMID: 39899024 Free PMC article.
-
lnc-IL7R Expression Reflects Physiological Pulmonary Function and Its Aberration Is a Putative Indicator of COPD.Biomedicines. 2022 Mar 28;10(4):786. doi: 10.3390/biomedicines10040786. Biomedicines. 2022. PMID: 35453536 Free PMC article.
-
Prognostic Biomarkers Based on Proteomic Technology in COPD: A Recent Review.Int J Chron Obstruct Pulmon Dis. 2023 Jun 30;18:1353-1365. doi: 10.2147/COPD.S410387. eCollection 2023. Int J Chron Obstruct Pulmon Dis. 2023. PMID: 37408604 Free PMC article. Review.
