

Estrogen receptor α-NOTCH1 axis enhances basal stem-like cells and epithelial-mesenchymal transition phenotypes in prostate cancer
- PMID: 31122254
- PMCID: PMC6533681
- DOI: 10.1186/s12964-019-0367-x
Estrogen receptor α-NOTCH1 axis enhances basal stem-like cells and epithelial-mesenchymal transition phenotypes in prostate cancer
Abstract
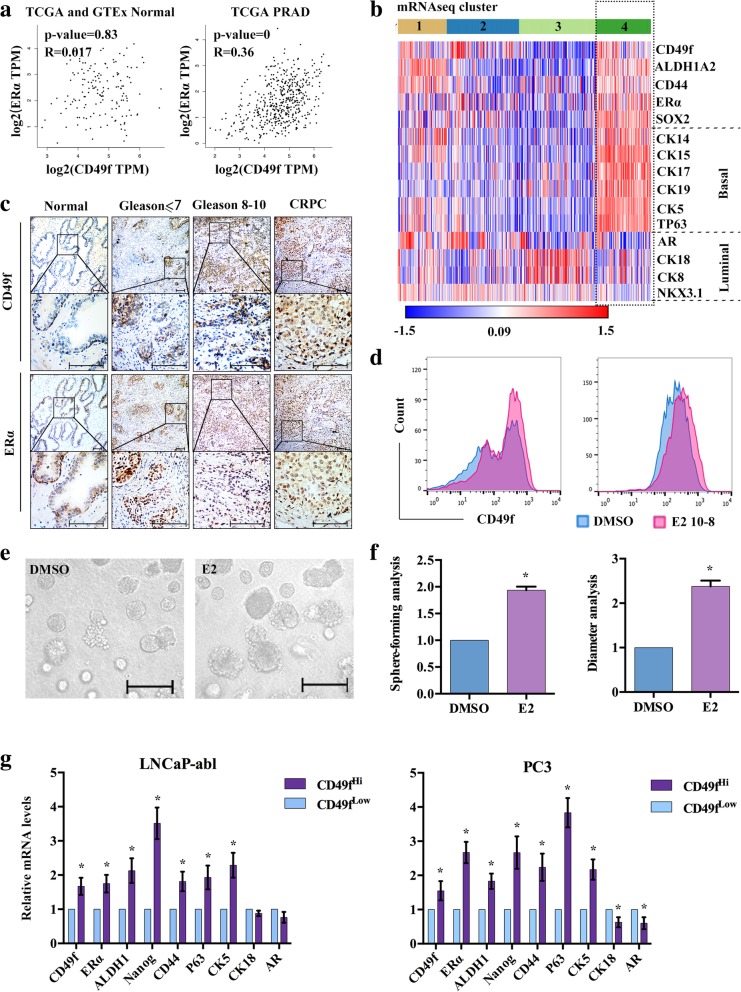
Background: Prostate cancer (PCa) is the second leading cause of mortality and a leading cause of malignant tumors in males. Prostate cancer stem cells (PCSCs) are likely the responsible cell types for cancer initiation, clinical treatment failure, tumor relapse, and metastasis. Estrogen receptor alpha (ERα) is mainly expressed in the basal layer cells of the normal prostate gland and has key roles in coordinating stem cells to control prostate organ development. Here, we investigated the roles of the estrogen-ERα signaling pathway in regulating PCSCs.
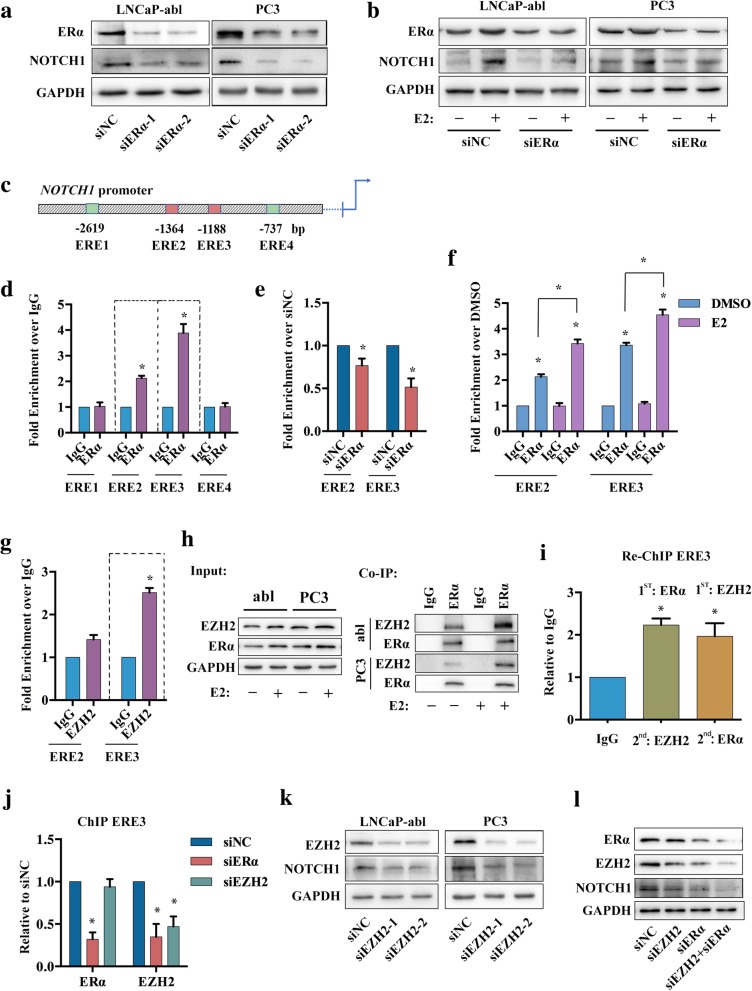
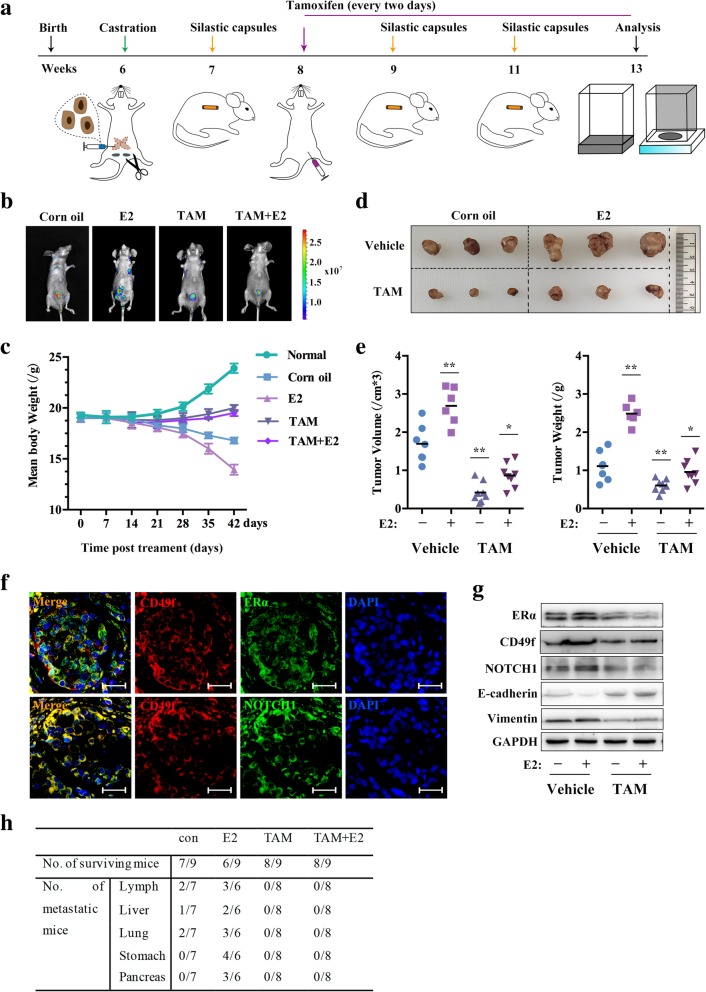
Methods: Correlation of CD49f and ERα/NOTCH1 was analyzed in human clinical datasets and tissue samples. Flow cytometry was used to sort CD49fHi and CD49fLow cells. EZH2 recruitment by ERα and facilitation of ERα binding to the NOTCH1 promoter was validated by Co-IP and ChIP. Primary tumor growth, tumor metastasis and sensitivity to 17β-estradiol (E2) inhibitor (tamoxifen) were evaluated in castrated mice.
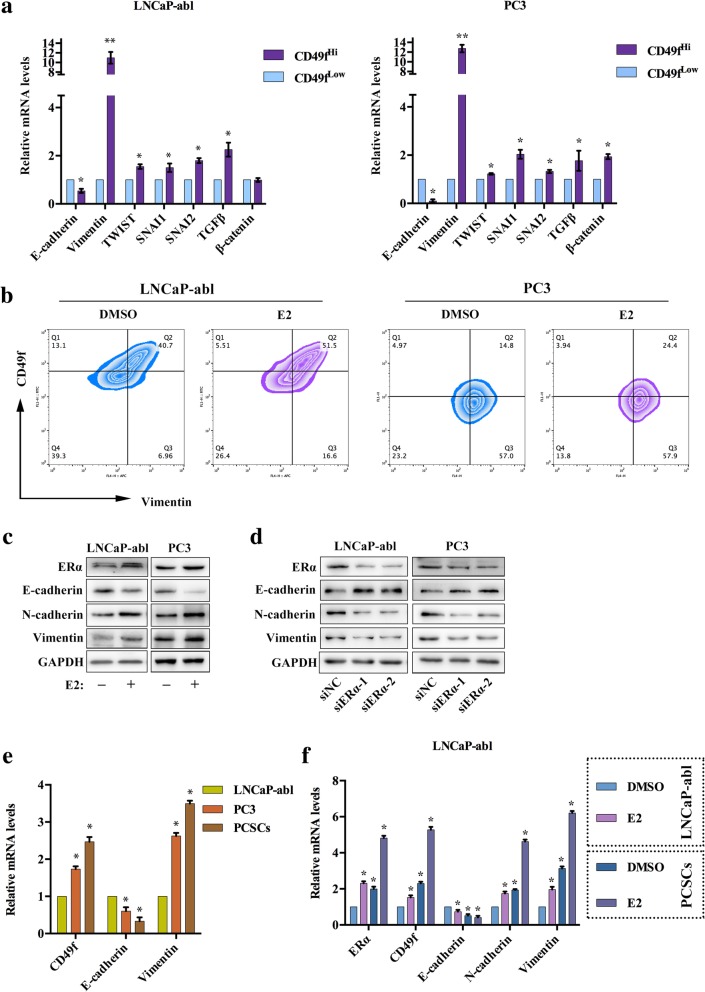
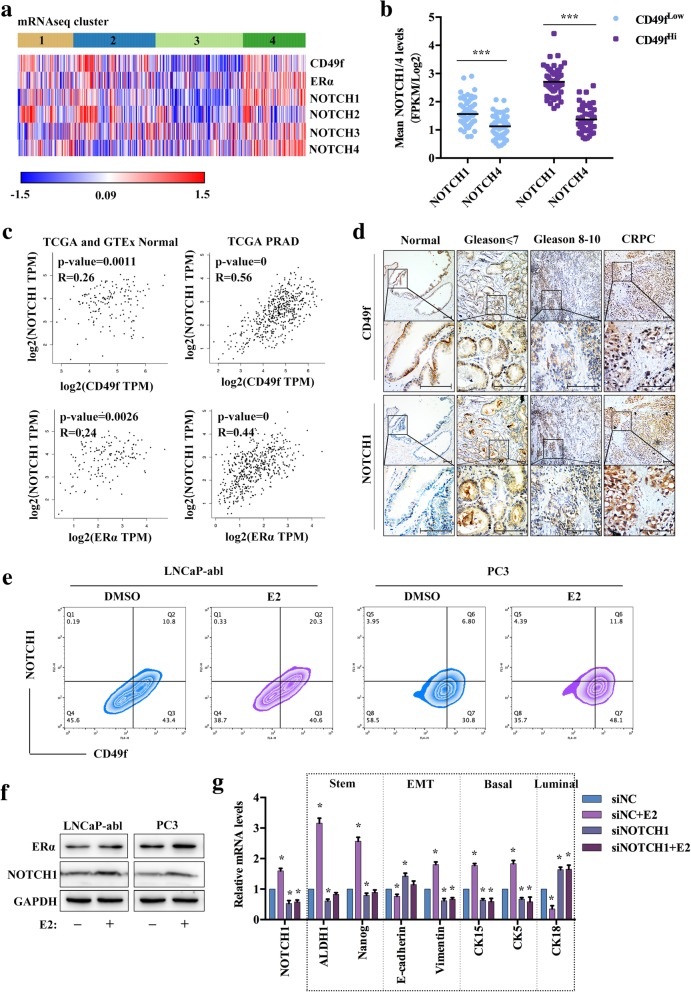
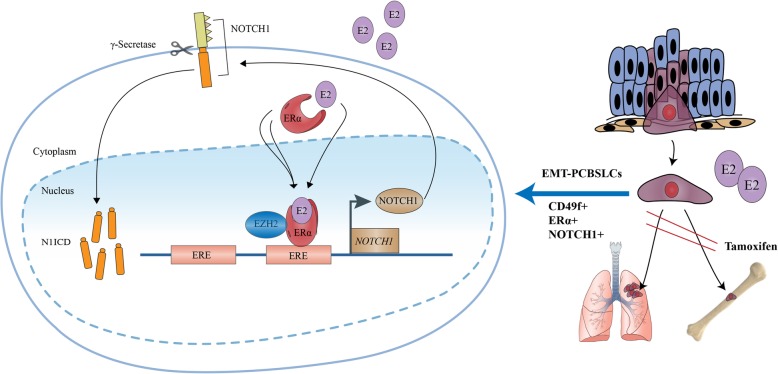
Results: ERα expression was significantly higher in CD49fHi prostate cancer basal stem-like cells (PCBSLCs), which showed basal and EMT features with susceptibility to E2 treatment. ERα-induced estrogen effects were suggested to drive the NOTCH1 signaling pathway activity via binding to the NOTCH1 promoter. Moreover, EZH2 was recruited by ERα and acted as a cofactor to assist ERα-induced estrogen effects in regulating NOTCH1 in PCa. In vivo, E2 promoted tumor formation and metastasis, which were inhibited by tamoxifen.
Conclusions: Our results implicated CD49f+/ERα + prostate cancer cells associated with basal stem-like and EMT features, named EMT-PCBSLCs, in heightened potential for promoting metastasis. NOTCH1 was regulated by E2 in CD49fHi EMT-PCBSLCs. These results contribute to insights into the metastatic mechanisms of EMT-PCBSLCs in PCa.
Keywords: CD49f; EMT; ERα; Estrogen; NOTCH1; Prostate cancer.
Conflict of interest statement
The authors declare that they have no competing interest.
Figures
Similar articles
-
Epithelial to mesenchymal transition is mechanistically linked with stem cell signatures in prostate cancer cells.PLoS One. 2010 Aug 27;5(8):e12445. doi: 10.1371/journal.pone.0012445. PLoS One. 2010. PMID: 20805998 Free PMC article.
-
ITGA6 is directly regulated by hypoxia-inducible factors and enriches for cancer stem cell activity and invasion in metastatic breast cancer models.Mol Cancer. 2016 Mar 22;15:26. doi: 10.1186/s12943-016-0510-x. Mol Cancer. 2016. PMID: 27001172 Free PMC article.
-
Estradiol promotes epithelial-to-mesenchymal transition in human benign prostatic epithelial cells.Prostate. 2017 Oct;77(14):1424-1437. doi: 10.1002/pros.23404. Epub 2017 Aug 29. Prostate. 2017. PMID: 28850686
-
MicroRNAs and epithelial-mesenchymal transition in prostate cancer.Oncotarget. 2016 Oct 11;7(41):67597-67611. doi: 10.18632/oncotarget.11708. Oncotarget. 2016. PMID: 27588490 Free PMC article. Review.
-
MicroRNAs targeting prostate cancer stem cells.Exp Biol Med (Maywood). 2015 Aug;240(8):1071-8. doi: 10.1177/1535370215584935. Epub 2015 May 12. Exp Biol Med (Maywood). 2015. PMID: 25966983 Free PMC article. Review.
Cited by
-
Cell Plasticity and Prostate Cancer: The Role of Epithelial-Mesenchymal Transition in Tumor Progression, Invasion, Metastasis and Cancer Therapy Resistance.Cancers (Basel). 2021 Jun 4;13(11):2795. doi: 10.3390/cancers13112795. Cancers (Basel). 2021. PMID: 34199763 Free PMC article. Review.
-
The number of the intraepithelial T cells correlate with the proliferation index in human bulbourethral gland epithelium.Heliyon. 2022 Nov 17;8(11):e11658. doi: 10.1016/j.heliyon.2022.e11658. eCollection 2022 Nov. Heliyon. 2022. PMID: 36425408 Free PMC article.
-
Context Matters: NOTCH Signatures and Pathway in Cancer Progression and Metastasis.Cells. 2021 Jan 7;10(1):94. doi: 10.3390/cells10010094. Cells. 2021. PMID: 33430387 Free PMC article. Review.
-
Tumor Microenvironment in Prostate Cancer: Toward Identification of Novel Molecular Biomarkers for Diagnosis, Prognosis, and Therapy Development.Front Genet. 2021 Mar 26;12:652747. doi: 10.3389/fgene.2021.652747. eCollection 2021. Front Genet. 2021. PMID: 33841508 Free PMC article. Review.
-
Emerging role of tumor cell plasticity in modifying therapeutic response.Signal Transduct Target Ther. 2020 Oct 7;5(1):228. doi: 10.1038/s41392-020-00313-5. Signal Transduct Target Ther. 2020. PMID: 33028808 Free PMC article. Review.
References
Publication types
MeSH terms
Substances
LinkOut - more resources
Full Text Sources
Medical
