. 2019 May 23;18(1):99.
doi: 10.1186/s12943-019-1024-0.

miR-301a promotes lung tumorigenesis by suppressing Runx3

Affiliations

miR-301a promotes lung tumorigenesis by suppressing Runx3

Xun Li et al. Mol Cancer. .

Abstract

Background: Our previous report demonstrated that genetic ablation of miR-301a reduces Kras-driven lung tumorigenesis in mice. However, the impact of miR-301a on host anti-tumor immunity remains unexplored. Here we assessed the underlying molecular mechanisms of miR-301a in the tumor microenvironment.

Methods: The differentially expressed genes were identified by using deep sequencing. The immune cell counts, and cytokines expression were analyzed by realtime PCR, immunohistochemistry and flow cytometry. The role of miR-301a/Runx3 in lung tumor was evaluated on cell growth, migration and invasion. The function of miR-301a/Runx3 in regulating tumor microenvironment and tumor metastasis were evaluated in Kras transgenic mice and B16/LLC1 syngeneic xenografts tumor models.

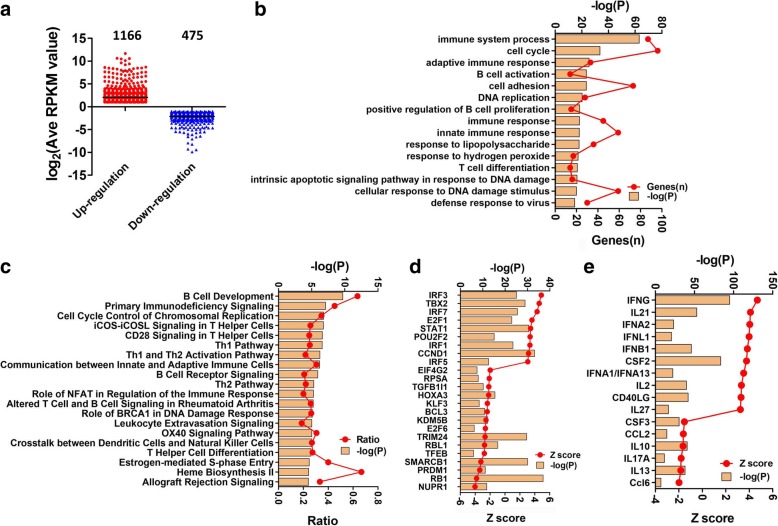
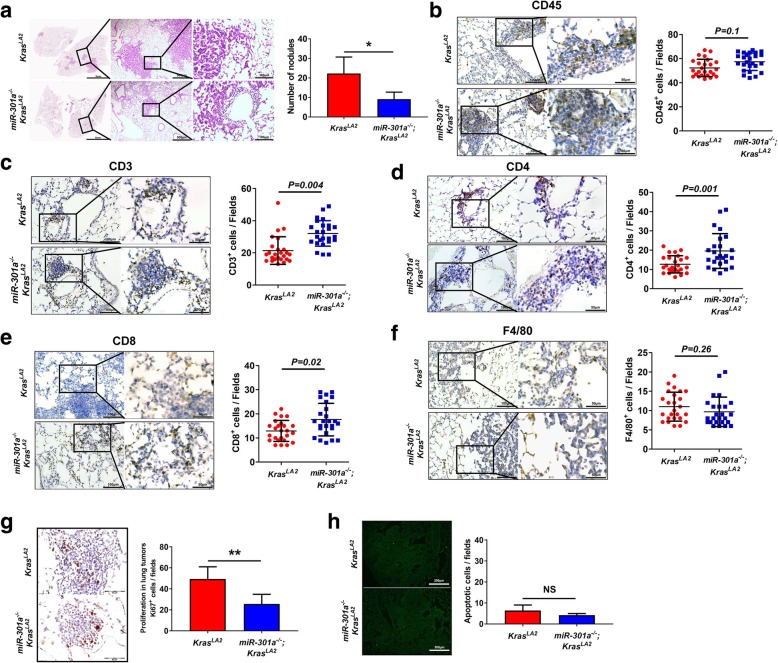
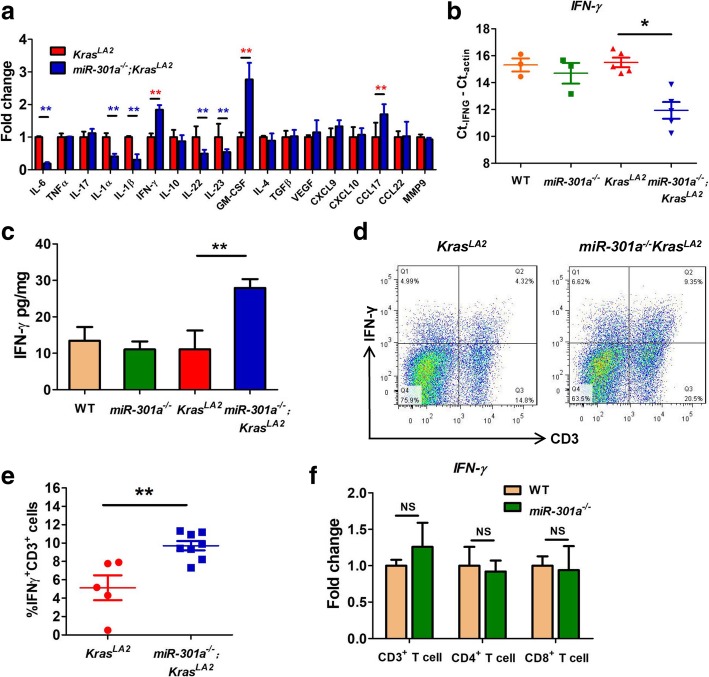
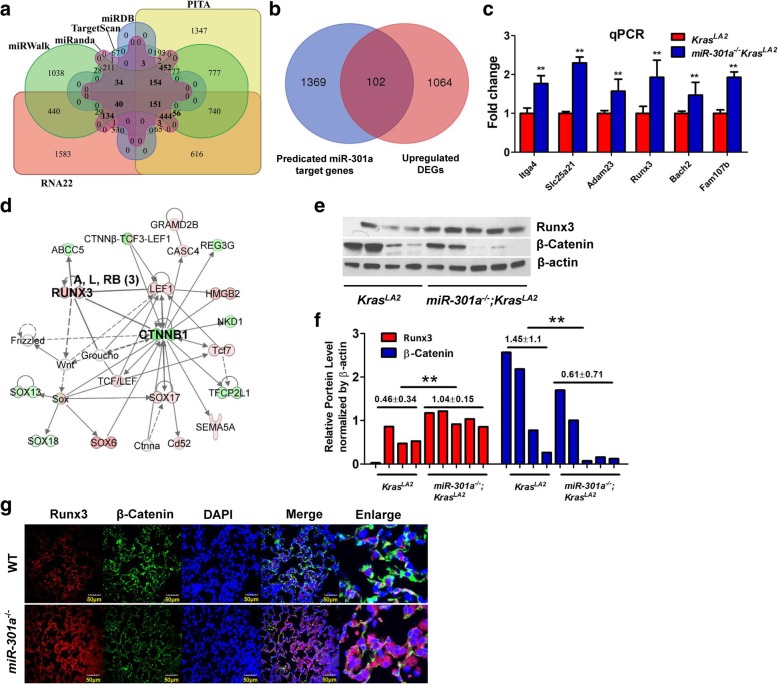
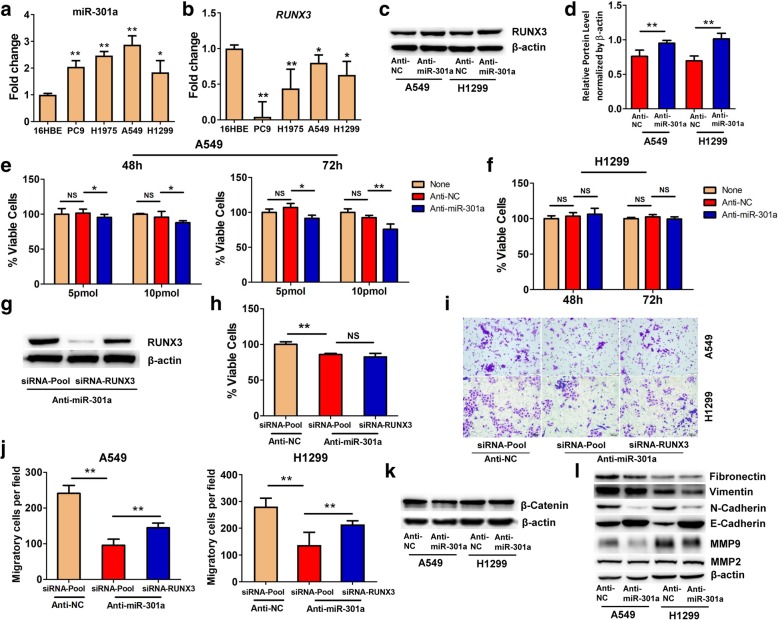
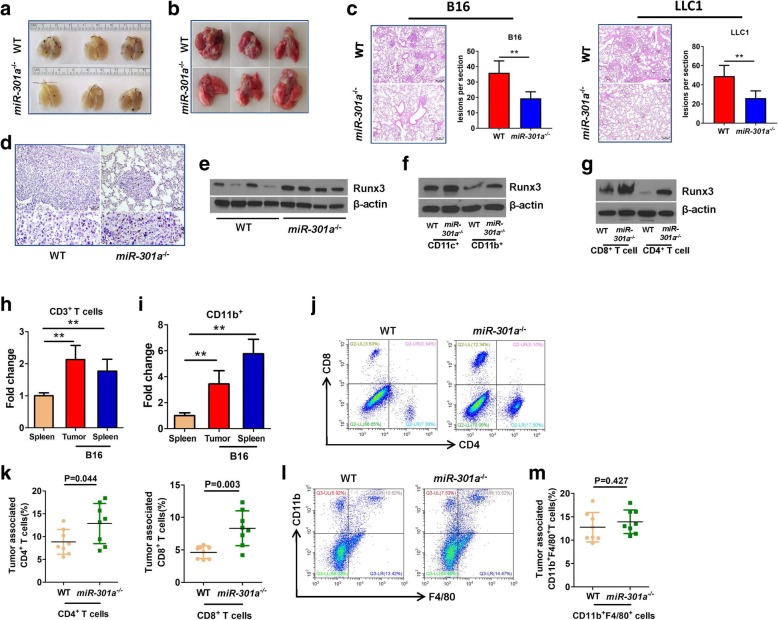
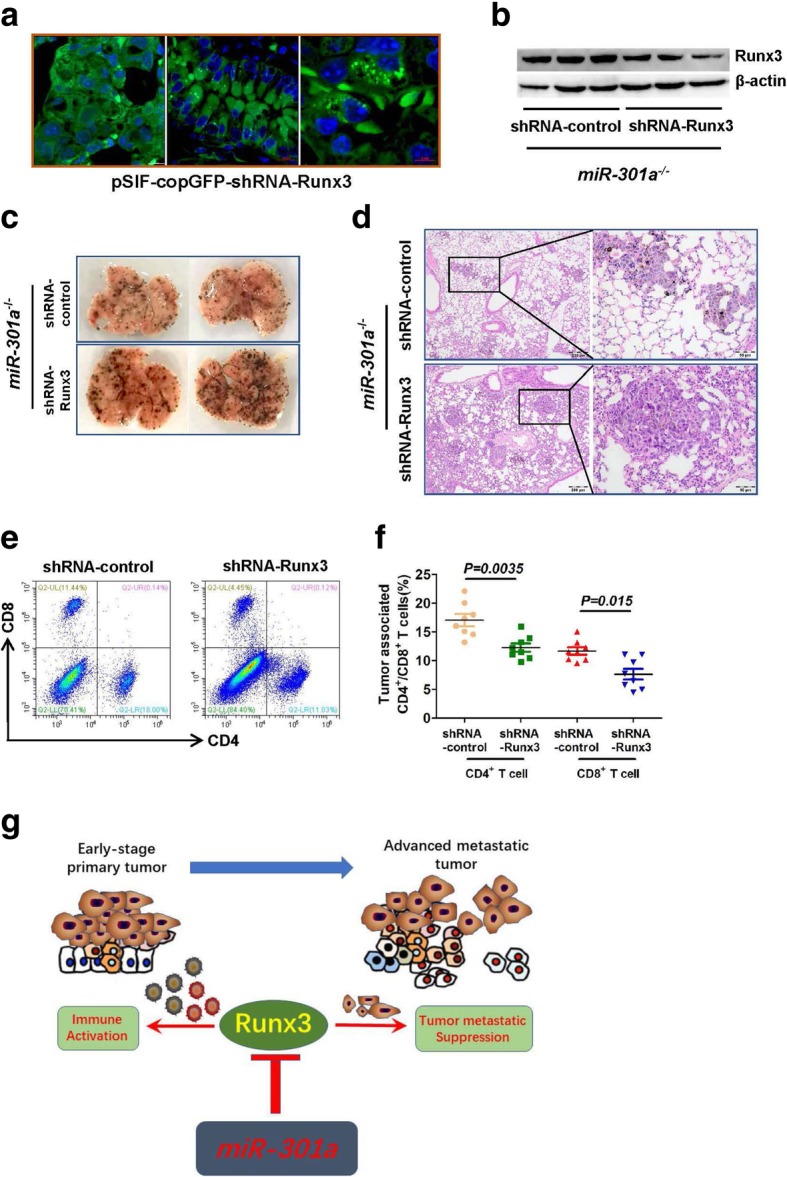
Results: In this work, we identified 1166 up-regulated and 475 down-regulated differentially expressed genes in lung tumor tissues between KrasLA2 and miR-301a-/-; KrasLA2 mice. Immune response and cell cycle were major pathways involved in the protective role of miR-301a deletion in lung tumorigenesis. Overexpression of the miR-301a target, Runx3, was an early event identified in miR-301a-/-; KrasLA2 mice compared to WT-KrasLA2 mice. We found that miR-301a deletion enhanced CD8+ T cell accumulation and IFN-γ production in the tumor microenvironment and mediated antitumor immunity. Further studies revealed that miR-301a deficiency in the tumor microenvironment effectively reduced tumor metastasis by elevating Runx3 and recruiting CD8+ T cells, whereas miR-301a knockdown in tumor cells themselves restrained cell migration by elevating Runx3 expression.

Conclusions: Our findings further underscore that miR-301a facilitates tumor microenvironment antitumor immunity by Runx3 suppression in lung tumorigenesis.

Keywords: CD8+ T cells; IFN-γ; Kras; Runx3; miR-301a.


Conflict of interest statement

The authors declare that they have no competing interests.

Figures

Fig. 1
Fig. 1
Transcriptional signatures analysis in tumors from KrasLA2 and miR-301a−/−;KrasLA2 mice. (a) Number of upregulated and downregulated genes in miR-301a−/−KrasLA2 tumors compared to KrasLA2 tumors. (b) Biological functions, (c) Canonical pathways, (d) Transcription factors and (e) Cytokines were categorized
Fig. 2
Fig. 2
Deletion of miR-301a alters tumor microenvironment. (a) Representative hematoxylin and eosin-stained histological sections of lungs isolated from KrasLA2 (n = 5) and miR-301a−/−;KrasLA2 (n = 5) mice at 9 weeks of age. Lines highlighted regions of inflammation. Average of tumor nodules were counted on the lung surface of KrasLA2 and miR-301a−/−;KrasLA2 littermates at 9 weeks of age. Quantitative immunohistochemical analysis of leukocytes (b: CD45), T cells (c: CD3), CD4+ T cells (d: CD4), CD8+ T cells (e: CD8), and macrophages (f: F4/80) from representative lung adenoma sections; quantitation was restricted to the areas within tumor boundaries. n = 25 individual tumors from 5 KrasLA2 or 5 miR-301a−/−;KrasLA2 mice and each individual tumor was staining from 3 serial sections and quantified and averaged as three independent experiments . Values represented the mean ± s.d. of three independent experiments. **P < 0.01 or *P < 0.05 indicates a significant difference between the indicated two groups (two-tailed, unpaired Student’s t-test)
Fig. 3
Fig. 3
Inhibition of lung tumorigenesis in miR-301a−/−KrasLA2 mice correlates with elevated IFN-γ expression. (a) Cytokine gene expression were measured by qPCR in lung tumors isolated from KrasLA2 (n = 5) and miR-301a−/−KrasLA2 (n = 5) mice at 9 weeks of age. (b) Relative expression IFN-γ in tumor tissues of WT (n = 3), miR-301a−/−(n = 3), KrasLA2 (n = 5), and miR-301a−/−KrasLA2 (n = 5) mice at 9 weeks of age were validated and determined by qPCR. (c) Single-cell suspensions were isolated from lung tissues (n = 5 per group), and IFN-γ secretion ex vivo was determined by ELISA. (d) Representative results of IFN-γ expression by CD3+ T cells isolated from lung tumors in 9-week-old KrasLA2 (n = 5) and miR-301a−/−KrasLA2 mice (n = 8). (e) The percentage of IFN-γ-positive and CD3-positive cells was counted using flow cytometric analysis of lung tissues from KrasLA2 (n = 5) and miR-301a−/−KrasLA2 (n = 8) mice at 9 weeks of age. (f) Relative expression levels of IFN-γ for CD3+, CD4+ and CD8+ T cells of lung tissues from WT (n = 5) and miR-301a−/− mice (n = 5). Values represented the mean ± s.d. of three independent experiments. **P < 0.01 or *P < 0.05 indicates a significant difference between the indicated groups (two-tailed, unpaired Student’s t-test in a, e and f and one-way analysis of variance (ANOVA) in b and c). NS, not significant
Fig. 4
Fig. 4
Inhibition of lung tumorigenesis in miR-301a−/−;KrasLA2 mice correlates with elevated Runx3 expression. (a) Venn diagram of predicted miR-301a target genes based on analysis of 6 databases (shown in bold). (b) Venn diagram of specific genes between predicted miR-301a target genes from (a) and DEGs identified by RNA-Seq. (c) Real-time PCR validation of 6 significantly upregulated genes from (b) (n = 3 per group). (d) IPA interaction network analysis of significant DEGs identifies the Runx3/β-catenin pathway in lung tumorigenesis with miR-301a deletion. (e) Western blotting analyses of Runx3 and β-catenin in the lung. Lung tissues were harvested from KrasLA2 (n = 4) and miR-301a−/−;KrasLA2 (n = 5) mice at 9 weeks of age. (f) Quantification of the expression of Runx3 and β-catenin from (e) using Image J with β-actin as a reference. (g) Immunofluorescence analyses of Runx3 and β-catenin in the lung. Lung tissues were from (e) and lung sections were stained with antibodies against Runx3 and β-catenin and DAPI (nucleus). Scale bars = 50 μm. Value represented the mean ± s.d. of three independent experiments. ** P < 0.01 indicated a significant difference between KrasLA2 and miR-301a−/−KrasLA2 mice (two-tailed, unpaired Student’s t-test in c and f)
Fig. 5
Fig. 5
The effects of miR-301a and Runx3 on cell proliferation and migration in A549 and H1299 cells. qPCR analyses of miR-301a (a) and its target gene RUNX3 (b) expression in NSCLC cell lines (PC9, H1975, A549, and H1299) compared to a noncancerous bronchial cell line (16HBE). Total RNAs were extracted from the cell lines and used for reverse transcription and real-time PCR. (c) Western blotting analyses of RUNX3 expression in A549 and H1299 cells transfected with anti-negative-control (anti-NC) or LNA-anti-miR-301a (anti-miR-301a). (d) Quantification of RUNX3 expression (c) using Image J with β-actin as a reference. (e) Cell viability of A549 cells transfected with only the transfection reagent, RNAiMAX (None), anti-negative control (anti-NC, 10 pmol), or LNA-anti-miR-301a (anti-miR-301a, 10 pmol). A549 cells were incubated for 48 h and 72 h after transfection, and cell viability was determined by counting cells labeled with CCK-8. (f) Cell viability of H1299 cells. H1299 cells were transfected and measured as in (e). (g) Western blotting shows the efficacy of siRNA knockdown in A549 cells co-transfected with LNA-anti-miR-301a and siRNA-RUNX3 or siRNA-control. (h) A549 cells were transfected with anti-NC & siRNA control (siRNA-Pool), anti-miR-301a & siRNA-Pool, or anti-miR-301a & siRNA-RUNX3. At 48 h after transfection, A549 viability was determined as in (e). (i) Migration of A549 cells was determined with a transwell migration assay. (j) The percentage of migratory cells in (i). (k) Western blotting analyses of β-catenin expression in A549 and H1299 cells transfected with Anti-NC or Anti-miR-301a. (l) Western blotting analyses of fibronectin, vimentin, N-cadherin, E-cadherin, MMP9 and MMP2 expression in A549 and H1299 cells transfected with Anti-NC or Anti-miR-301a. Values represented the mean ± s.d. of three independent experiments. **P < 0.01 or *P < 0.05 indicates a significant difference between the indicated groups (two-tailed, unpaired Student’s t-test in d and one-way analysis of variance (ANOVA) in others). NS, not significant
Fig. 6
Fig. 6
miR-301a deficiency in the tumor microenvironment inhibits tumor metastasis. Images of representative B16 tumors (a) and LLC1 (b) tumors developed in the lung of mice. WT and miR-301a−/− mice (n = 8 per group) were implanted with B16 or LLC1 tumor cells by intravenous injection. (c) H&E-stained sections of lungs isolated from WT and KO mice implanted with B16 or LLC1 tumor cells. Scale bars = 200 μm. (d) Runx3 expression in lung tumor sections from WT and KO mice was determined by immunohistochemistry. Scale bars = 100 μm. (e) Western blot analysis of Runx3 expression in lung tumor tissues of WT (n = 4) and miR-301a−/− (n = 4) mice. (f) CD11c+ and CD11b+ cells from lung tumors and (g) CD8+ and CD4+ cells from lung tumors of WT and miR-301a−/− mice implanted with B16 tumor cells. Tumor-associated CD3+ cells (h) and CD11b+ cells (i) were purified from B16 tumors harvested from WT (n = 3) and miR-301a−/− mice (n = 3). miR-301a expression was measured by qPCR. (j) Percentages of infiltrating CD8+ and CD4+ T cells isolated from B16 tumors from WT (n = 8) and miR-301a−/− mice (n = 8) as analyzed by flow cytometry (pregated on CD3 events). (k) CD4+ and CD8+ T cells counts in lung tumor sections from WT (n = 8) and miR-301a−/− mice (n = 8). (l) Percentages of infiltrating CD11b+ and F4/80+ cells isolated from B16 tumors developed in WT (n = 8) and miR-301a−/− mice (n = 8) as analyzed by flow cytometry (pregated on CD3 events). (m) CD11b+ and F4/80+ T cells counts in lung tumor sections from WT (n = 8) and miR-301a−/− mice (n = 8). Values represented the mean ± s.d. of three independent experiments. **P < 0.01 or *P < 0.05 indicates a significant difference between the indicated groups (one-way analysis of variance (ANOVA) in h and i and two-tailed, unpaired Student’s t-test in k and m)
Fig. 7
Fig. 7
Inhibition of tumor metastasis in miR-301a−/− mice correlates with elevated Runx3 expression and CD8+ T cell infiltration. miR-301a−/− mice (n = 8 per group) were implanted with B16 tumor cells by intravenous injection. After 48 h, shRNA control or shRNA-Runx3 lentivirus was injected into miR-301a−/− mice every day until mice were sacrificed and lung tissues collected. (a) Expression of GFP from the shRNA-Runx3 vector in B16 lung tumors. Scale bars = 10 μm or 5 μm. (b) Runx3 expression in lung sections from miR-301a−/− mice (n = 3) with either shRNA-control or shRNA-Runx3 as determined by western blot. (c) Images of representative B16 tumors in the lung from miR-301a−/− mice with either shRNA-control or shRNA-Runx3 lentivirus (n = 8 per group). (d) H&E-stained sections of lungs isolated from miR-301a−/− mice (n = 8 per group) with B16 tumor cells. (e) Infiltrating T cells within lung tumors. Right panel: Percentages of infiltrating CD8+ and CD4+ T cells isolated from B16 tumors implanted in miR-301a−/− mice with either shRNA-control or shRNA-Runx3 lentivirus as analyzed by flow cytometry (pregated on CD3 events). Left panel: CD4+ and CD8+ T cells counts in lung sections (n = 8 per group). (f) Schematic representation of the roles of miR-301a and Runx3 in lung tumorigenesis. Values represented the mean ± s.d. of three independent experiments. **P < 0.01 or *P < 0.05 indicates a significant difference between the indicated groups (two-tailed, unpaired Student’s t-test in f)

Similar articles

Cited by

References

    1. Wistuba II, Gazdar AF. Lung cancer preneoplasia. Annu Rev Pathol. 2006;1:331–348. doi: 10.1146/annurev.pathol.1.110304.100103. - DOI - PubMed
    1. DuPage M, Dooley AL, Jacks T. Conditional mouse lung cancer models using adenoviral or lentiviral delivery of Cre recombinase. Nat Protoc. 2009;4:1064–1072. doi: 10.1038/nprot.2009.95. - DOI - PMC - PubMed
    1. Licciulli S, Avila JL, Hanlon L, Troutman S, Cesaroni M, Kota S, Keith B, Simon MC, Pure E, Radtke F, et al. Notch1 is required for Kras-induced lung adenocarcinoma and controls tumor cell survival via p53. Cancer Res. 2013;73:5974–5984. doi: 10.1158/0008-5472.CAN-13-1384. - DOI - PMC - PubMed
    1. Ma X, Choudhury SN, Hua X, Dai Z, Li Y. Interaction of the oncogenic miR-21 microRNA and the p53 tumor suppressor pathway. Carcinogenesis. 2013;34:1216–1223. doi: 10.1093/carcin/bgt044. - DOI - PMC - PubMed
    1. Gu L, Deng ZJ, Roy S, Hammond PT. A combination RNAi-chemotherapy layer-by-layer nanoparticle for systemic targeting of KRAS/P53 with cisplatin to treat non-small cell lung Cancer. Clin Cancer Res. 2017;23:7312–7323. doi: 10.1158/1078-0432.CCR-16-2186. - DOI - PMC - PubMed

Publication types