. 2019 Jul 17;103(2):250-265.e8.
doi: 10.1016/j.neuron.2019.04.032. Epub 2019 May 20.

Loss of Adaptive Myelination Contributes to Methotrexate Chemotherapy-Related Cognitive Impairment

Affiliations

Loss of Adaptive Myelination Contributes to Methotrexate Chemotherapy-Related Cognitive Impairment

Anna C Geraghty et al. Neuron. .

Abstract

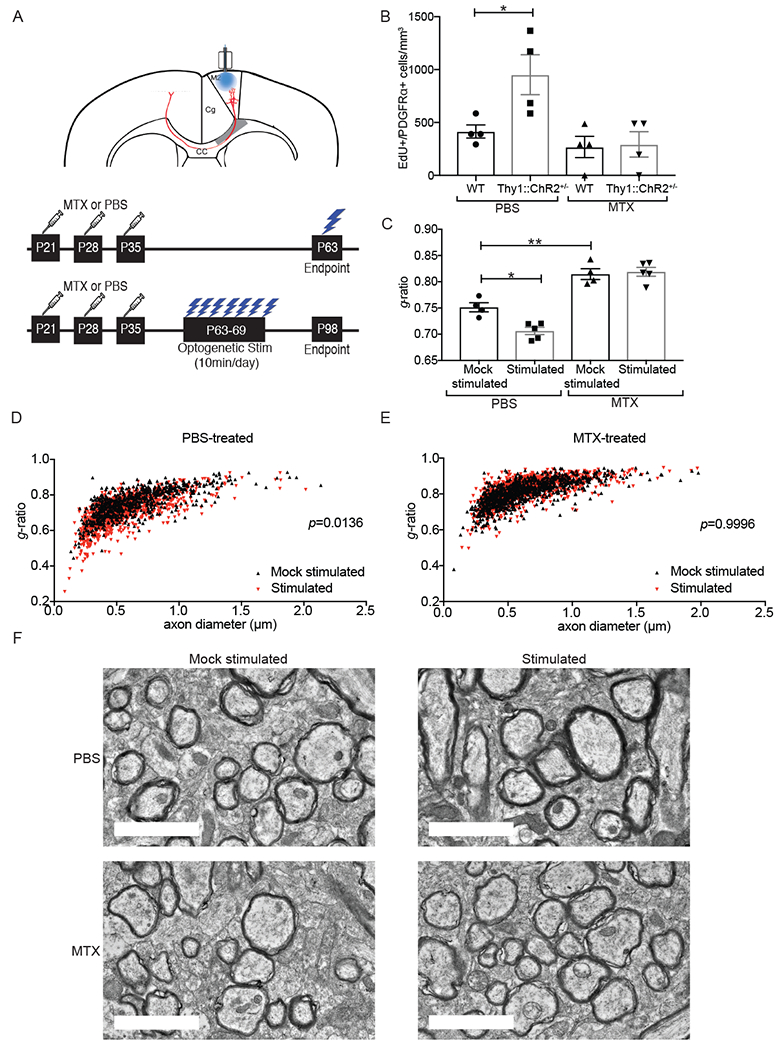
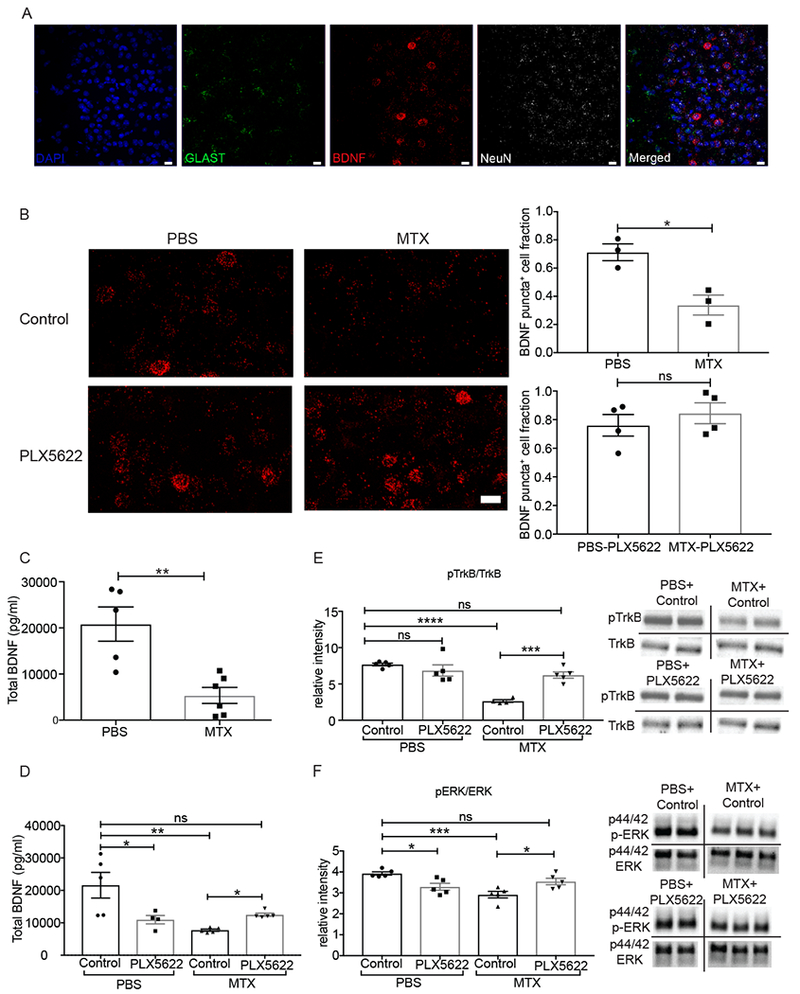
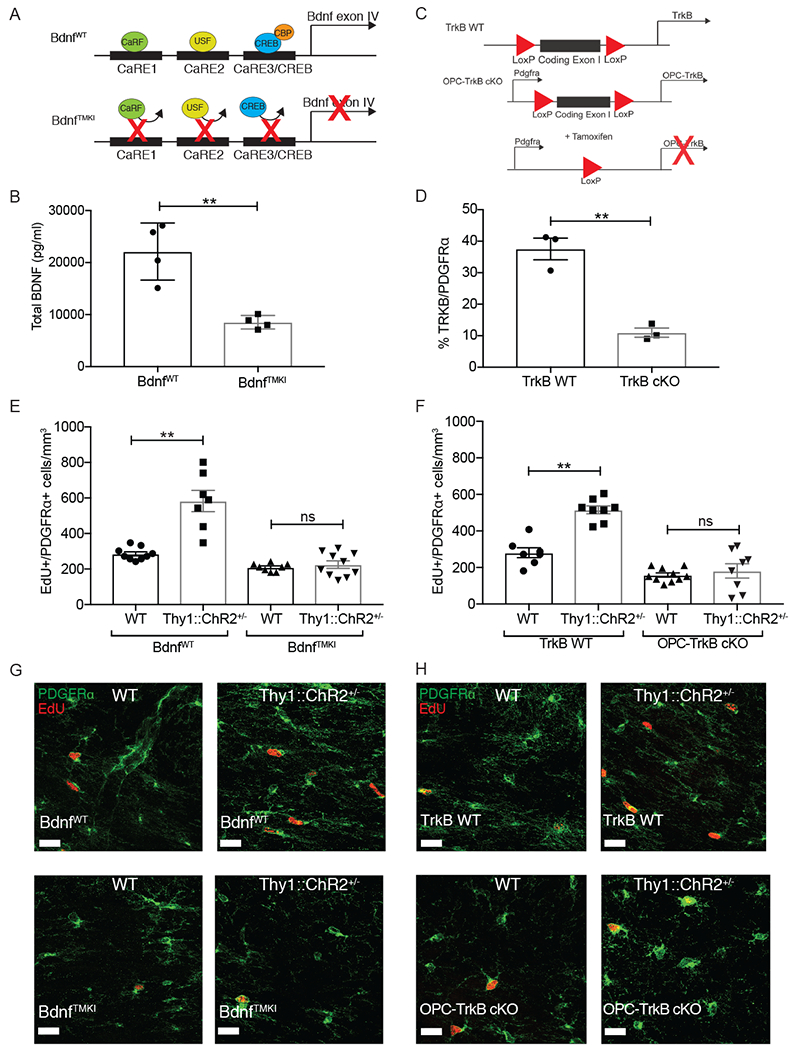
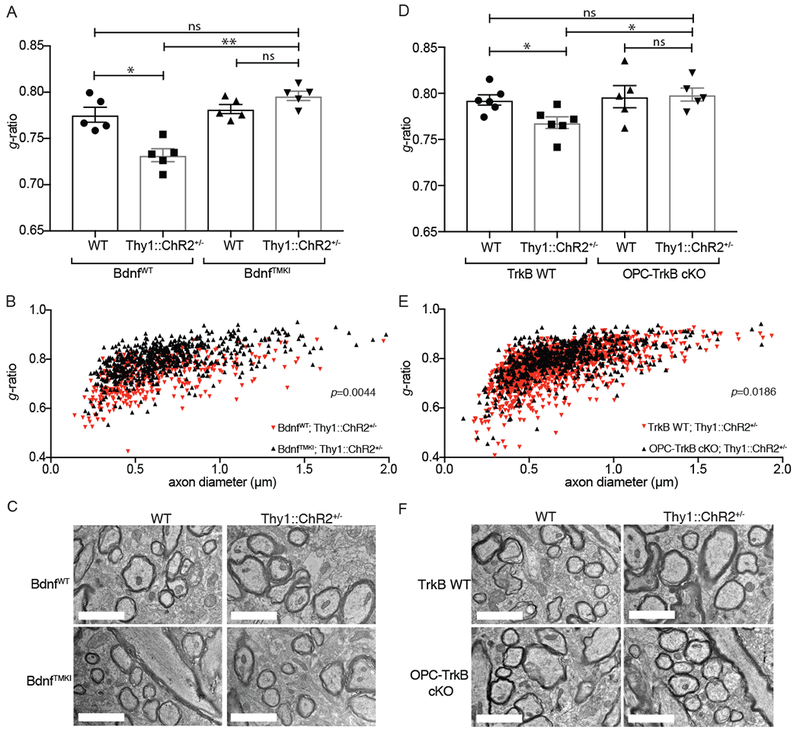
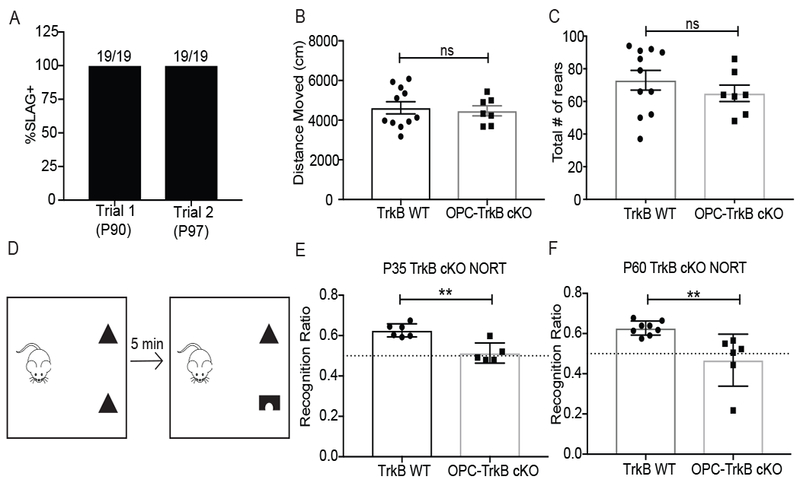
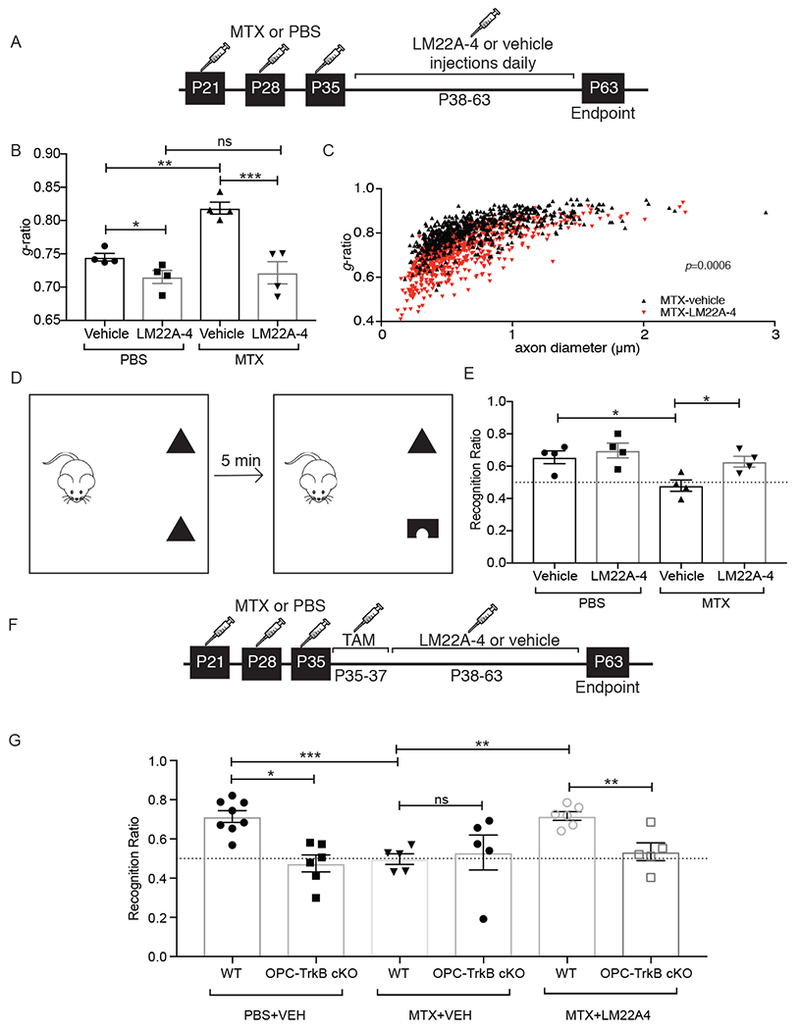
Activity-dependent myelination is thought to contribute to adaptive neurological function. However, the mechanisms by which activity regulates myelination and the extent to which myelin plasticity contributes to non-motor cognitive functions remain incompletely understood. Using a mouse model of chemotherapy-related cognitive impairment (CRCI), we recently demonstrated that methotrexate (MTX) chemotherapy induces complex glial dysfunction for which microglial activation is central. Here, we demonstrate that remote MTX exposure blocks activity-regulated myelination. MTX decreases cortical Bdnf expression, which is restored by microglial depletion. Bdnf-TrkB signaling is a required component of activity-dependent myelination. Oligodendrocyte precursor cell (OPC)-specific TrkB deletion in chemotherapy-naive mice results in impaired cognitive behavioral performance. A small-molecule TrkB agonist rescues both myelination and cognitive impairment after MTX chemotherapy. This rescue after MTX depends on intact TrkB expression in OPCs. Taken together, these findings demonstrate a molecular mechanism required for adaptive myelination that is aberrant in CRCI due to microglial activation.

Keywords: BDNF; TrkB; adaptive myelination; chemotherapy-related cognitive impairment; myelin; myelin plasticity; oligodendrocyte; oligodendrocyte precursor cell.


Conflict of interest statement

Competing interests: Dr. Longo is listed as an inventor on patents relating to LM22A-4, which are assigned to UNC-Chapel Hill and UCSF. Dr. Longo is eligible for royalties distributed by the assigned universities. Dr. Longo also has financial interest in PharmatrophiX, a company focused on the development of small molecule ligands for neurotrophin receptors, which has licensed several of these patents. Drs. Longo and Monje are inventors on a patent application, coordinated through Stanford University, regarding use of LM22A-4 to promote myelination in disease.

Figures

Fig 1.
Fig 1.. Failure of adaptive myelination in a mouse model of MTX CRCI
A) (Above) Coronal section of mouse brain, with prefrontal cortex areas labeled (M2 = premotor cortex; Cg = cingulate cortex). Optogenetic stimulation of premotor (M2) projection neurons, with analysis of oligodendroglial lineage cells in the corpus callosum (CC) in the region of premotor projections (shaded grey). (Below) Timelines of methotrexate (MTX) treatment and optogenetic stimulation (single and 7-day stimulation paradigms). B) MTX abrogates activity-regulated OPC proliferation. Density of EdU-marked OPCs in the corpus callosum of Thy1::ChR2+/− mice and identically manipulated WT (no opsin) mice that were previously exposed to MTX or PBS vehicle control at 3-hours following a single optogenetic stimulation session. n=4 mice per group. C) MTX abrogates activity-regulated myelination. TEM was performed one month following the end of the 7-day optogenetic stimulation paradigm in Thy1::ChR2+/− mice that were either stimulated or identically manipulated (mock-stimulated controls) that were previously exposed to MTX of PBS vehicle control. Myelin sheath thickness (g-ratio) analyzed at the level of the cingulum of the corpus callosum. n = 4-5 mice/group. D-E) g-ratio shown as a function of axon caliber in scatterplot of all axons measured in (D) PBS vehicle control-treated, mock-stimulated mice (n = 4; black triangles) compared to PBS vehicle control-treated, optogenetically stimulated mice (n = 5; red triangles) and in (E) MTX-treated, unstimulated mice (n = 4; black triangles) compared to MTX-treated, optogenetically stimulated mice (n = 5; red triangles). A single point indicates the g-ratio for a single axon; ~100 axons quantified. P-values (indicated on plots) determined by comparing the mean g-ratio per mouse between groups. F) Representative TEM images of premotor projections. Scale bars=2μm. Data shown as mean ± SEM (B, C). Each point = one mouse (B, C). ns = p > 0.05, *p < 0.05, **p < 0.01, two-way ANOVA with Tukey post-hoc analysis for multiple comparisons. See also Figure S1.
Figure 2.
Figure 2.. MTX treatment depletes Bdnf mRNA and protein expression and disrupts TrkB signaling.
A) Representative image demonstrating RNAscope visualization of frontal cortex deep layer neurons (NeuN, white), astrocytes (Glast, green), and Bdnf mRNA (red). DAPI, blue. Scale bar = 20 μm B) MTX treatment decreases Bdnf mRNA expression and microglial depletion with PLX5622 rescues Bdnf levels. (Left) Representative images of Bdnf puncta (red) in mice treated with PBS+control chow (n=3 mice) and PBS+PLX5622 chow (n=4 mice), MTX+control chow (n=3 mice) and MTX+PLX5622 chow (n=4 mice). (right) Quantification of DAPI+ cells expressing above threshold Bdnf mRNA puncta in each group. Scale bar = 20 μm C) Decreased Bdnf protein levels following MTX exposure. Total Bdnf protein levels from frontal deep cortex and corpus callosum tissue microdissected at P63 and measured by ELISA in mice treated with MTX (n = 6 mice) or PBS vehicle control (n = 5 mice). D) Microglial depletion with PLX5622 restores Bdnf levels following MTX exposure. Total Bdnf protein levels from frontal deep cortex and corpus callosum tissue microdissected at P63 and measured by ELISA in mice treated with PBS+control chow (n = 5 mice), PBS+ PLX5622 chow (n = 4 mice), and MTX+control chow (n = 5 mice), MTX+PLX5622 chow (n = 5 mice). E) Microglial depletion with PLX5622 restores TrkB signaling following MTX exposure. Ratio of phospho-TrkB/TrkB western blot band intensity from microdissected frontal deep cortex and corpus callosum tissue of mice treated with PBS+control chow (n = 5 mice), PBS+ PLX5622 chow (n = 5 mice), MTX+control chow (n = 4 mice), and MTX+PLX5622 chow (n = 5 mice). Representative images of westerns to the right of the graph. F) Microglial depletion with PLX5622 restores downstream TrkB signaling following MTX exposure. Ratio of phospho-ERK/ERK western blot band intensity from microdissected frontal deep cortex and corpus callosum tissue of mice treated with PBS+control chow (n = 5 mice), PBS+ PLX5622 chow (n = 5 mice), MTX+control chow (n = 5 mice), and MTX+PLX5622 chow (n = 5 mice). Representative images of westerns to the right of the graph. Data shown as mean ± SEM. Each point = one mouse. ns = p > 0.05, * p < 0.05, ** p < 0.01, *** p<0.001, **** p<0.0001. Students t-tests (B, C); Two-way ANOVA with Tukey post-hoc analysis for multiple comparisons (D,E,F).
Fig. 3.
Fig. 3.. BDNF to TrkB signaling is necessary for activity-regulated oligodendrocyte precursor cell proliferation
A) Schematic of BdnfTMKI mouse, which lacks activity-regulated Bdnf expression. B) Bdnf protein is decreased in TMKI animals. Total Bdnf protein levels in frontal deep cortex and corpus callosum tissue are decreased in BdnfTMKI mice compared to BdnfWT control mice (n = 4 mice/group). C) Schematic of OPC-TrkB cKO genetic mouse model in which exon1 of the TrkB gene is deleted, resulting in loss of both full-length and truncated TrkB receptor in PDGFRα+ cells (OPCs) following tamoxifen administration. D) Residual OPC TrkB expression following recombination induced by tamoxifen (P24-28), expressed as percentage of PDGFRα+ OPCS co-expressing TrkB (n = 3 mice/group). E) Loss of activity-dependent Bdnf blocks neuronal activity-regulated OPC proliferation. Density of proliferating OPCs (EdU+/PDGFRα+) in the corpus callosum of BdnfWT;WT (no opsin; n = 9), BdnfWT;Thy1::ChR2+/− (n = 7), BdnfTMKI;WT (no opsin; n = 8), and BdnfTMKI; Thy1::ChR2+/− (n = 10) mice at 3-hr following a single optogenetic stimulation session. F) Inducible loss of OPC-specific TrkB blocks neuronal activity-regulated OPC proliferation. Density of proliferating OPCs (EdU+/PDGFRα+ cells) in the corpus callosum of TrkB WT;WT (no opsin; n=7), TrkB WT;Thy1::ChR2+/− (n=8), OPC-TrkB cKO;WT (no opsin; n=10), OPC-TrkB cKO;Thy1::ChR2+/− (n=8) mice at 3-hr following a single optogenetic stimulation session. G) Representative confocal images of PDGFRα+ OPCs (green) co-localized with EdU+ nuclei (red) in the corpus callosum. Scale bars = 20μm. Data shown as mean ± SEM. Each point = one mouse. ns = p > 0.05, ** p < 0.01. Student’s t-test (B and D); Two-way ANOVA with Tukey post-hoc analysis for multiple comparisons (E and F). See also Figure S2 and S3
Fig 4.
Fig 4.. BDNF to TrkB signaling is necessary for activity-regulated myelination
A) Loss of activity dependent Bdnf blocks neuronal activity-regulated myelination. TEM performed 4 weeks following the cessation of the 7-day optogenetic stimulation paradigm. Bar graphs representing the g-ratio data shown in B, expressed as mean g-ratio ± SEM for each group of mice (BdnfWT, WT (no opsin), BdnfWTThy1::ChR2+/−, BdnfTMKI;WT (no opsin), and BdnjTMKI; Thy1::ChR2+/−; n=5 mice/group). B) Scatterplot of g-ratios as a function of axon caliber for BdnfWT;Thy1::ChR2+/− mice (n=5; red triangles) compared to BdnfTMKI;Thy1::ChR2+/− mice (n=5; black triangles). A single point indicates the g-ratio for a single axon. ~100 axons quantified for each mouse. P-values (indicated on plots) determined by comparing the mean g-ratio per mouse between groups. C) BdnfTMKI model: Representative TEM images of premotor projections in cross section. Scale bars = 2μm. D) Inducible loss of OPC-specific TrkB blocks neuronal activity-induced myelination. TEM analyses of g-ratio as described in A, in the OPC-TrkB cKO model. Bar graphs representing the g-ratio data shown in C, expressed as mean g-ratio ± SEM for each group of mice (TrkB WT;WT (no opsin), TrkB WT;Thy1::ChR2+/− OPC-TrkB cKO;WT (no opsin), OPC-TrkB cKO;Thy1::ChR2+−; n=6 TrkB WT mice/group and n = 5 OPC-TrkB cKO mice/group). E) Scatterplot of g-ratios as a function of axon caliber in TrkB WT;Thy1::ChR2+/− mice (n=6; red triangles) compared to OPC-TrkB cKO;Thy1::ChR2+/− mice (n=5; black triangles). A single point indicates the g-ratio for a single axon; ~100 axons were quantified for each mouse. P-values (indicated on plots) were determined by comparing the mean g-ratio per mouse between groups. F) OPC-TrkB cKO model: Representative TEM images of premotor projections in cross section. Scale bars = 2μm. Data shown as mean ± SEM;Each point = one mouse (A, D). ns = p > 0.05, *p < 0.05. Two-way ANOVA with Tukey post-hoc analysis for multiple comparisons (A, B, D and E). See also Figure S4
Figure 5.
Figure 5.. OPC-specific TrkB receptor loss results in deficits in cognitive behavioral performance
A) Vision is unaffected in OPC-TrkB cKO mice. OPC-TrkB cKO mice underwent slow angled-descent forepaw grasping (SLAG) testing at P90 and again one week later. All mice (n=19) exhibited SLAG+ behavior consistent with intact visual perception of objects. B) Locomotion is similar between OPC-TrkB cKO mice and WT controls. Total distance moved in Intellicage activity chamber over 10-min testing period in OPC-TrkB cKO mice (n=7) and TrkB WT mice (n=11). C) Rearing behavior is similar between OPC-TrkB cKO mice and WT controls. Total number of rears counted in the Intellicage activity chamber over ten minutes in OPC-TrkB cKO mice (n=7) and TrkB WT mice (n=11). D) Schematic illustrating the Novel Object Recognition Test (NORT) of attention and shortterm memory function. Preference for novel object expressed as percent time spent with novel object over the total time spent interacting with either object (recognition ratio). E) OPC-TrkB cKO mice (juvenile TrkB loss with tamoxifen given to all mice at P35) exhibit a deficit in novel object recognition. NORT performed at P63 in OPC-TrkB ckO mice (n=5 mice) and no Cre, TrkBfl/fl (TrkB WT; n=6) controls. F) OPC-TrkB cKO mice (adult TrkB loss with tamoxifen given to all mice at P60) exhibit a deficit in novel object recognition. NORT performed at P89 in OPC-TrkB ckO mice (n=6 mice) and no Cre, TrkBfl/fl (TrkB WT; n=8) control mice. Data shown as mean ± SEM. Each point = one mouse. ns = p > 0.05, ** p < 0.01, Student’s t-test (B,C,E,F)
Fig 6.
Fig 6.. TrkB partial agonist LM22A-4 normalizes myelination and rescues cognitive behavioral function after methotrexate chemotherapy exposure
A) Schematic of LM22A-4 treatment in MTX CRCI model, with MTX or PBS vehicle control at P21, 28 and 35 followed by daily LM22A-4 or vehicle control administration from P38-P63. B) Treatment with LM22A-4 rescues myelin deficits after MTX. TEM performed at P63 and g-ratios measured at the level of the cingulum of the corpus callosum. Bar graphs representing the g-ratio data shown in C and Fig. S6. n=4 mice/group. C) Scatterplot of g-ratios as a function of axon caliber in MTX+LM22A-4-treated mice (n=4; red triangles) compared to MTX+vehicle control-treated mice (n=4; black triangles). A single point indicates the g-ratio for a single axon; ~100 axons quantified for each mouse. P-values (indicated on plots) determined by comparing the mean g-ratio per mouse between groups. D) Schematic of Novel Object Recognition Test (NORT). Preference for novel object measured as the percent time spent with novel object over the total time spent with either object (recognition ratio). E) LM22A-4 rescues the cognitive behavioral impairment observed after MTX. NORT performance in mice previously exposed to MTX or PBS vehicle control and subsequently treated with LM22A-4 or vehicle control. (n=4 mice in each group). F) Schematic of LM22A-4 treatment in MTX CRCI model, with tamoxifen (TAM) induction of OPC TrkB cKO prior to LM22A-4 exposure. G) TrkB expression in OPCs is required for LM22A-4 rescue of cognitive behavioral performance after MTX. NORT performance in OPC-TrkB cKO and TrkB WT mice previously exposed to either MTX or PBS vehicle control followed by LM22A-4 or vehicle control, as outlined in F. Data shown as mean ± SEM; each point = one mouse (B, E, G). ns = p > 0.05, * p < 0.05, ** p < 0.01 *** p<0.001 as determined by two-way ANOVA (B, C, E) or three-way ANOVA (G) with Tukey post-hoc analysis for multiple comparisons. See also Figure S5 and S6

Comment in

References

    1. Arenkiel BR, Peca J, Davison IG, Feliciano C, Deisseroth K, Augustine GJ, Ehlers MD, and Feng G (2007). In vivo light-induced activation of neural circuitry in transgenic mice expressing channelrhodopsin-2. Neuron 54, 205–218. - PMC - PubMed
    1. Aukema EJ, Caan MW, Oudhuis N, Majoie CB, Vos FM, Reneman L, Last BF, Grootenhuis MA, and Schouten-van Meeteren AY (2009). White matter fractional anisotropy correlates with speed of processing and motor speed in young childhood cancer survivors. Int J Radiat Oncol Biol Phys 74, 837–843. - PubMed
    1. Balkowiec A, and Katz DM (2000). Activity-dependent release of endogenous brain-derived neurotrophic factor from primary sensory neurons detected by ELISA in situ. J Neurosci 20, 7417–7423. - PMC - PubMed
    1. Barres BA, and Raff MC (1993). Proliferation of oligodendrocyte precursor cells depends on electrical activity in axons. Nature 361, 258–260. - PubMed
    1. Barthas F, and Kwan AC (2017). Secondary Motor Cortex: Where ‘Sensory’ Meets ‘Motor’ in the Rodent Frontal Cortex. Trends Neurosci 40, 181–193. - PMC - PubMed

Publication types

MeSH terms

LinkOut - more resources