

Polybrominated Diphenyl Ethers and Gut Microbiome Modulate Metabolic Syndrome-Related Aqueous Metabolites in Mice
- PMID: 31123037
- PMCID: PMC6657215
- DOI: 10.1124/dmd.119.086538
Polybrominated Diphenyl Ethers and Gut Microbiome Modulate Metabolic Syndrome-Related Aqueous Metabolites in Mice
Abstract
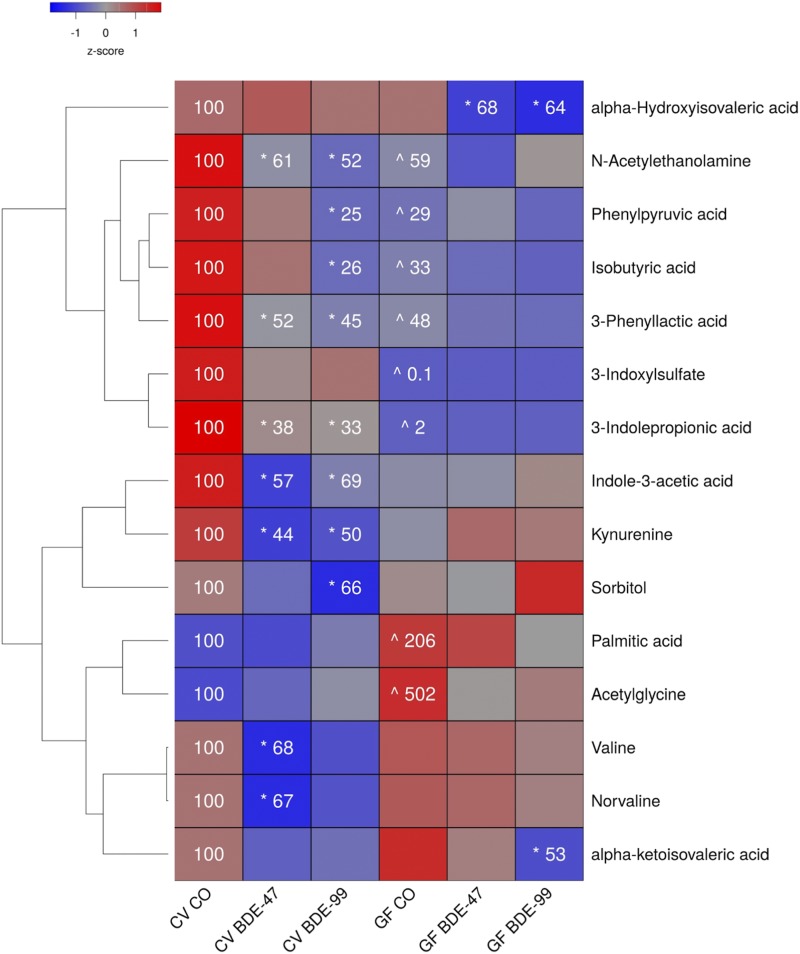
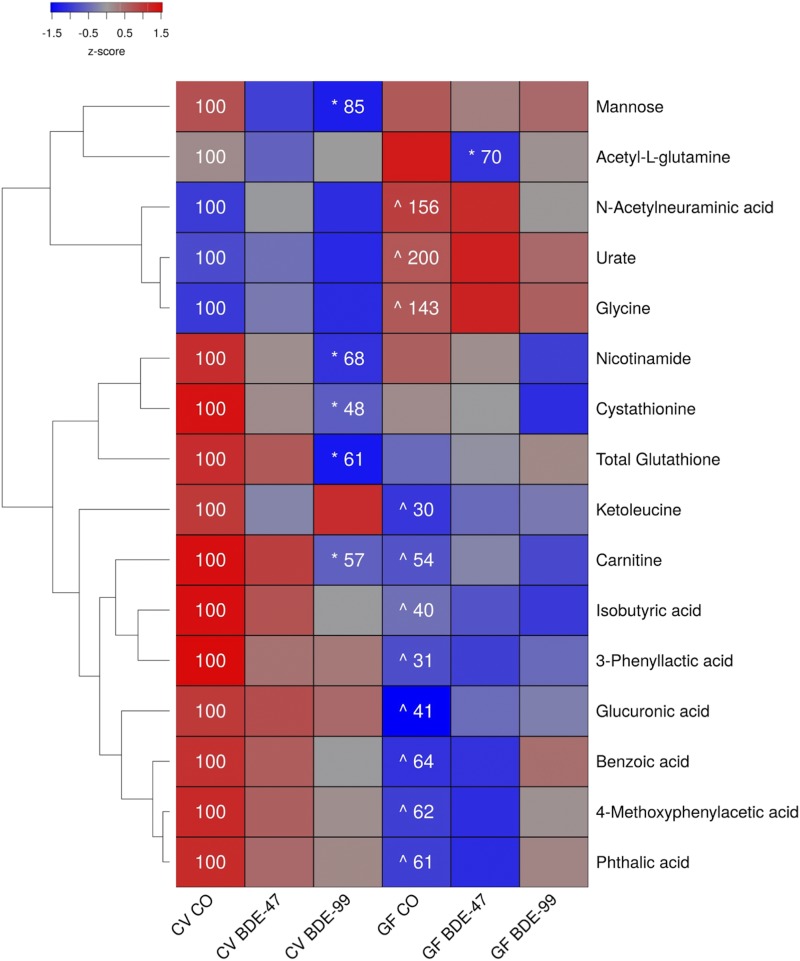
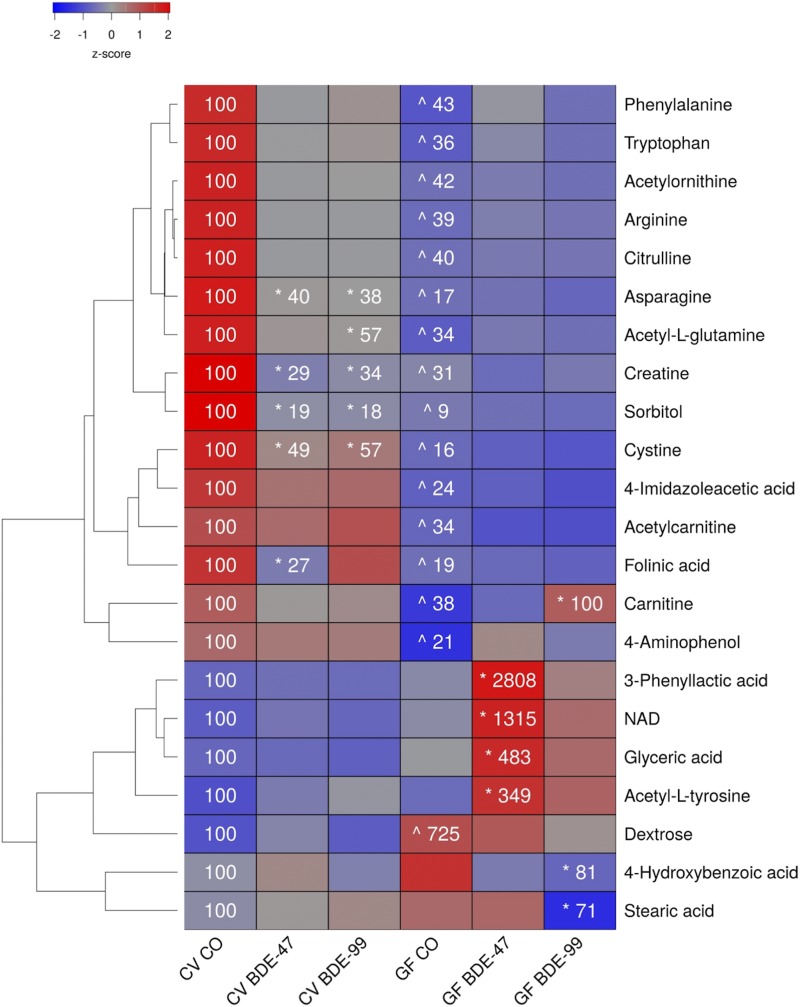
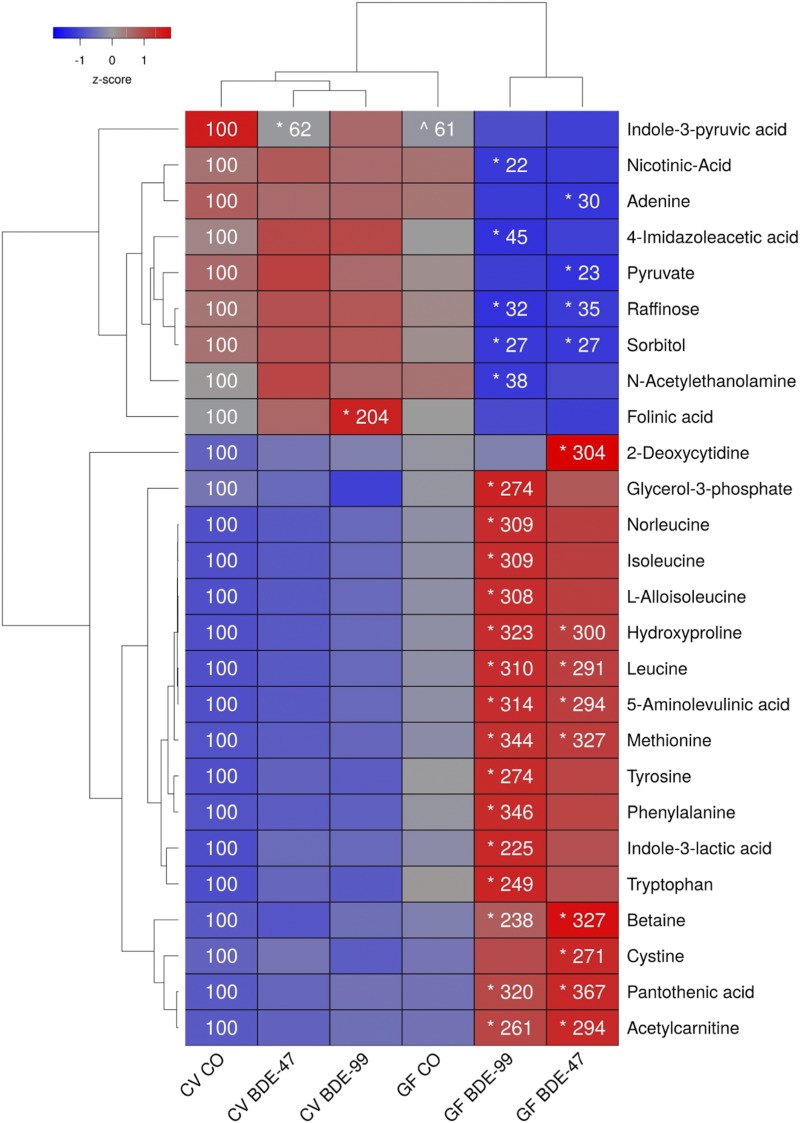
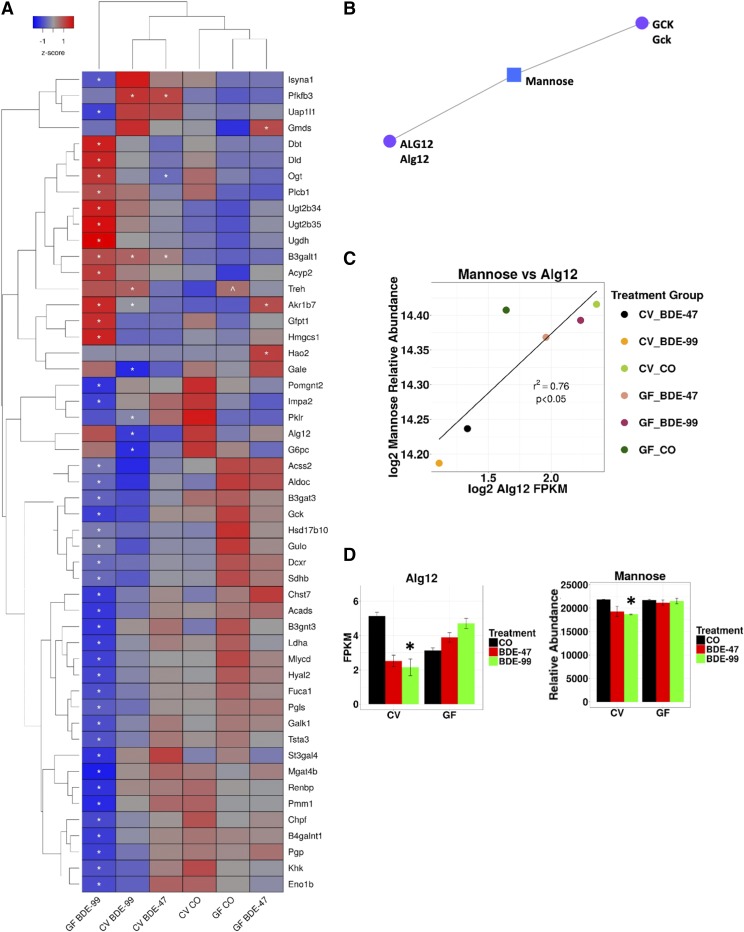
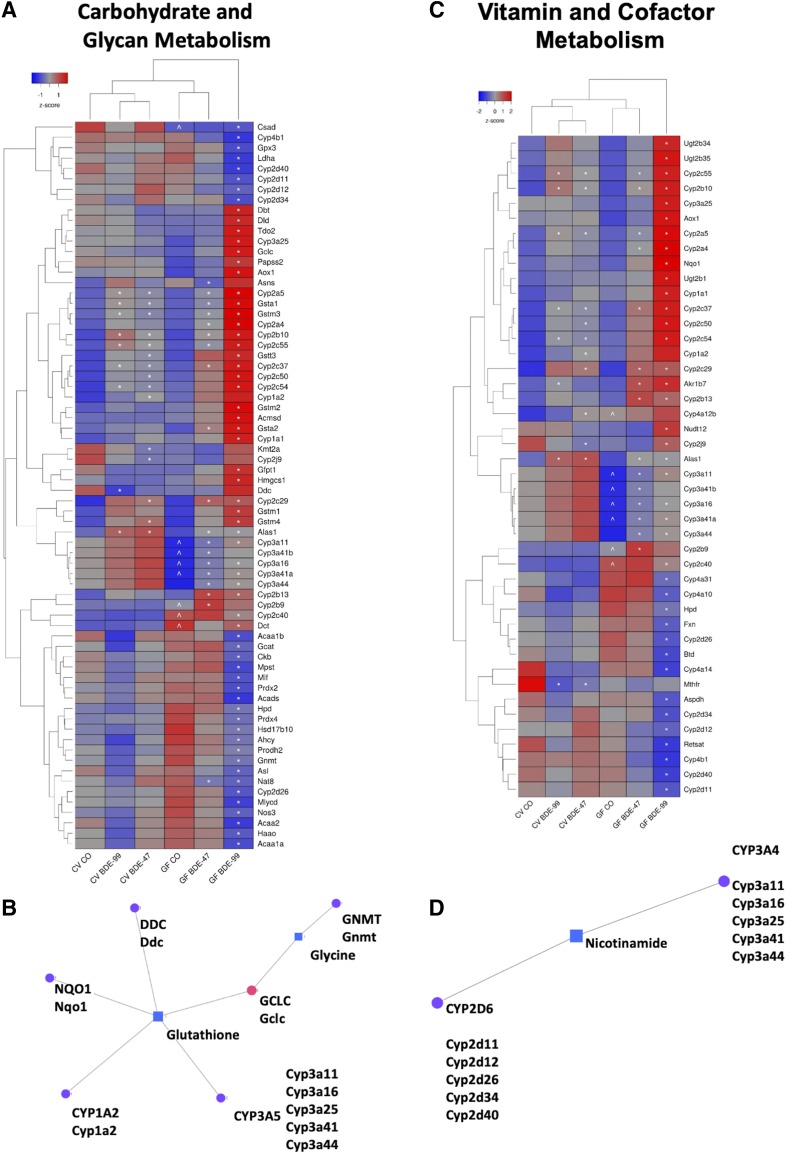
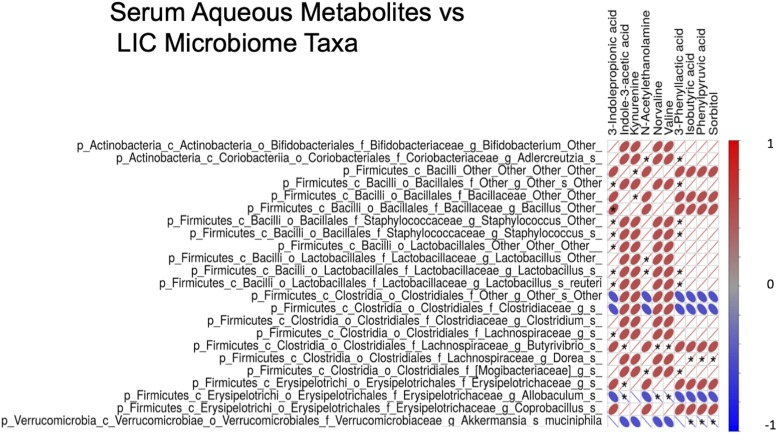
Polybrominated diphenyl ethers (PBDEs) are persistent environmental toxicants associated with increased risk for metabolic syndrome. Intermediary metabolism is influenced by the intestinal microbiome. To test the hypothesis that PBDEs reduce host-beneficial intermediary metabolites in an intestinal microbiome-dependent manner, 9-week old male conventional (CV) and germ-free (GF) C57BL/6 mice were orally gavaged once daily with vehicle, BDE-47, or BDE-99 (100 μmol/kg) for 4 days. Intestinal microbiome (16S rDNA sequencing), liver transcriptome (RNA-Seq), and intermediary metabolites in serum, liver, as well as small and large intestinal contents (SIC and LIC; LC-MS) were examined. Changes in intermediary metabolite abundances in serum, liver, and SIC, were observed under basal conditions (CV vs. GF mice) and by PBDE exposure. PBDEs altered the largest number of metabolites in the LIC; most were regulated by PBDEs in GF conditions. Importantly, intestinal microbiome was necessary for PBDE-mediated decreases in branched-chain and aromatic amino acid metabolites, including 3-indolepropionic acid, a tryptophan metabolite recently shown to be protective against inflammation and diabetes. Gene-metabolite networks revealed a positive association between the hepatic glycan synthesis gene α-1,6-mannosyltransferase (Alg12) mRNA and mannose, which are important for protein glycosylation. Glycome changes have been observed in patients with metabolic syndrome. In LIC of CV mice, 23 bacterial taxa were regulated by PBDEs. Correlations of certain taxa with distinct serum metabolites further highlight a modulatory role of the microbiome in mediating PBDE effects. In summary, PBDEs impact intermediary metabolism in an intestinal microbiome-dependent manner, suggesting that dysbiosis may contribute to PBDE-mediated toxicities that include metabolic syndrome.
Copyright © 2019 by The American Society for Pharmacology and Experimental Therapeutics.
Figures
Similar articles
-
Regulation of protein-coding gene and long noncoding RNA pairs in liver of conventional and germ-free mice following oral PBDE exposure.PLoS One. 2018 Aug 1;13(8):e0201387. doi: 10.1371/journal.pone.0201387. eCollection 2018. PLoS One. 2018. PMID: 30067809 Free PMC article.
-
PBDEs Altered Gut Microbiome and Bile Acid Homeostasis in Male C57BL/6 Mice.Drug Metab Dispos. 2018 Aug;46(8):1226-1240. doi: 10.1124/dmd.118.081547. Epub 2018 May 16. Drug Metab Dispos. 2018. PMID: 29769268 Free PMC article.
-
Novel Interactions between Gut Microbiome and Host Drug-Processing Genes Modify the Hepatic Metabolism of the Environmental Chemicals Polybrominated Diphenyl Ethers.Drug Metab Dispos. 2017 Nov;45(11):1197-1214. doi: 10.1124/dmd.117.077024. Epub 2017 Sep 1. Drug Metab Dispos. 2017. PMID: 28864748 Free PMC article.
-
Neurotoxicity of brominated flame retardants: (in)direct effects of parent and hydroxylated polybrominated diphenyl ethers on the (developing) nervous system.Environ Health Perspect. 2011 Jul;119(7):900-7. doi: 10.1289/ehp.1003035. Epub 2011 Feb 4. Environ Health Perspect. 2011. PMID: 21245014 Free PMC article. Review.
-
Polybrominated diphenyl ethers and their hydroxylated/methoxylated analogs: environmental sources, metabolic relationships, and relative toxicities.Mar Pollut Bull. 2011;63(5-12):179-88. doi: 10.1016/j.marpolbul.2011.02.008. Epub 2011 Mar 24. Mar Pollut Bull. 2011. PMID: 21439595 Review.
Cited by
-
Maternal PBDE exposure disrupts gut microbiome and promotes hepatic proinflammatory signaling in humanized PXR-transgenic mouse offspring over time.Toxicol Sci. 2023 Jul 28;194(2):209-225. doi: 10.1093/toxsci/kfad056. Toxicol Sci. 2023. PMID: 37267213 Free PMC article.
-
Single-cell transcriptomics unveiled that early life BDE-99 exposure reprogrammed the gut-liver axis to promote a proinflammatory metabolic signature in male mice at late adulthood.Toxicol Sci. 2024 Jun 26;200(1):114-136. doi: 10.1093/toxsci/kfae047. Toxicol Sci. 2024. PMID: 38648751 Free PMC article.
-
Effects of Different Concentrations of Ganpu Tea on Fecal Microbiota and Short Chain Fatty Acids in Mice.Nutrients. 2021 Oct 22;13(11):3715. doi: 10.3390/nu13113715. Nutrients. 2021. PMID: 34835972 Free PMC article.
-
Toxic Effects and Mechanisms of Polybrominated Diphenyl Ethers.Int J Mol Sci. 2023 Aug 30;24(17):13487. doi: 10.3390/ijms241713487. Int J Mol Sci. 2023. PMID: 37686292 Free PMC article. Review.
-
Understanding the physiological functions of the host xenobiotic-sensing nuclear receptors PXR and CAR on the gut microbiome using genetically modified mice.Acta Pharm Sin B. 2022 Feb;12(2):801-820. doi: 10.1016/j.apsb.2021.07.022. Epub 2021 Jul 29. Acta Pharm Sin B. 2022. PMID: 35256948 Free PMC article.
References
-
- Abildgaard A, Elfving B, Hokland M, Wegener G, Lund S. (2018) The microbial metabolite indole-3-propionic acid improves glucose metabolism in rats, but does not affect behaviour. Arch Physiol Biochem 124:306–312. - PubMed
-
- Aebi M. (2013) N-linked protein glycosylation in the ER. Biochim Biophys Acta 1833 (11):2430–2437. - PubMed
-
- Arner P, Langin D. (2014) Lipolysis in lipid turnover, cancer cachexia, and obesity-induced insulin resistance. Trends Endocrinol Metab 25:255–262. - PubMed
-
- Barton S, Navarro SL, Buas MF, Schwarz Y, Gu H, Djukovic D, Raftery D, Kratz M, Neuhouser ML, Lampe JW. (2015) Targeted plunknownasma metabolome response to variations in dietary glycemic load in a randomized, controlled, crossover feeding trial in healthy adults. Food Funct 6:2949–2956. - PMC - PubMed
-
- Bezares-Cruz J, Jafvert CT, Hua I. (2004) Solar photodecomposition of decabromodiphenyl ether: products and quantum yield. Environ Sci Technol 38:4149–4156. - PubMed
Publication types
MeSH terms
Substances
Grants and funding
LinkOut - more resources
Full Text Sources
Medical
