. 2019 Jul;212(3):729-742.
doi: 10.1534/genetics.119.302254. Epub 2019 May 22.

Binding of an X-Specific Condensin Correlates with a Reduction in Active Histone Modifications at Gene Regulatory Elements

Affiliations

Binding of an X-Specific Condensin Correlates with a Reduction in Active Histone Modifications at Gene Regulatory Elements

Lena Annika Street et al. Genetics. 2019 Jul.

Abstract

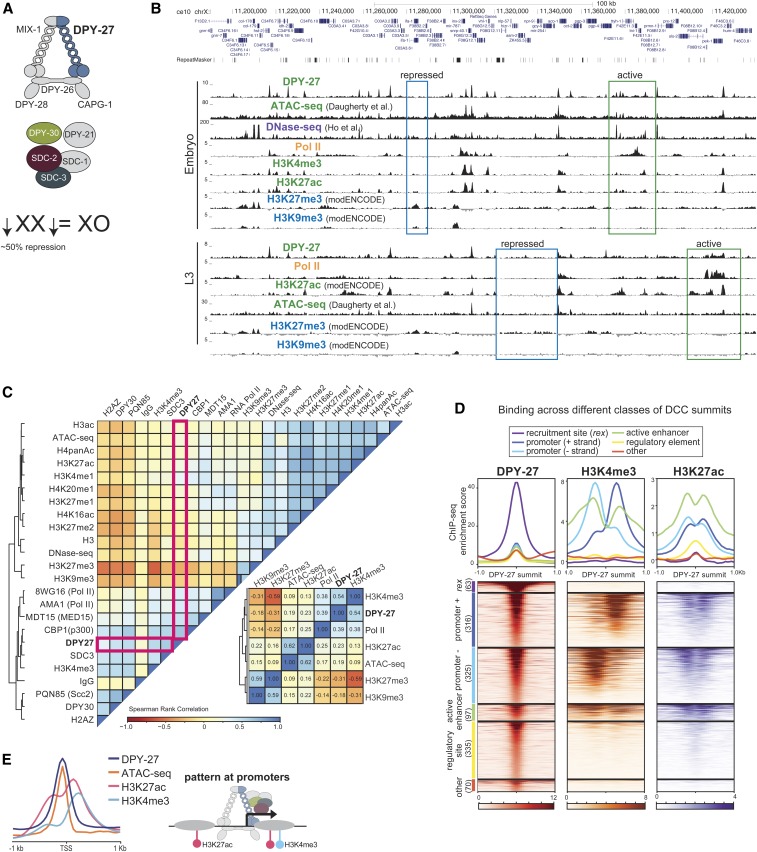
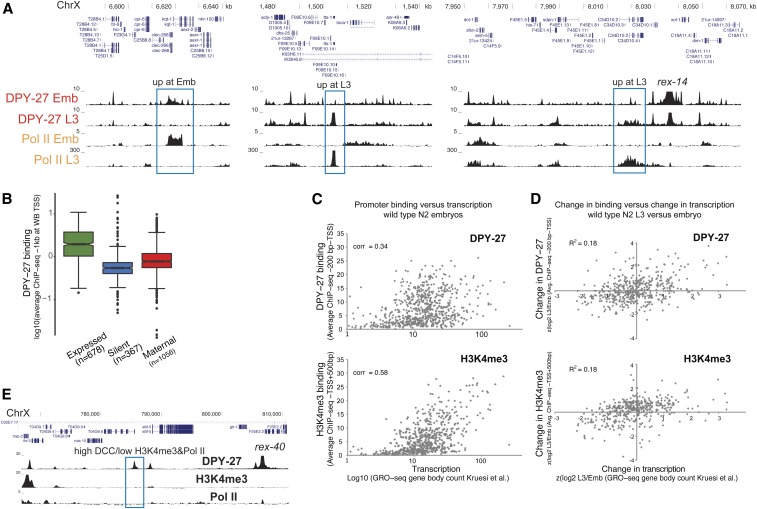
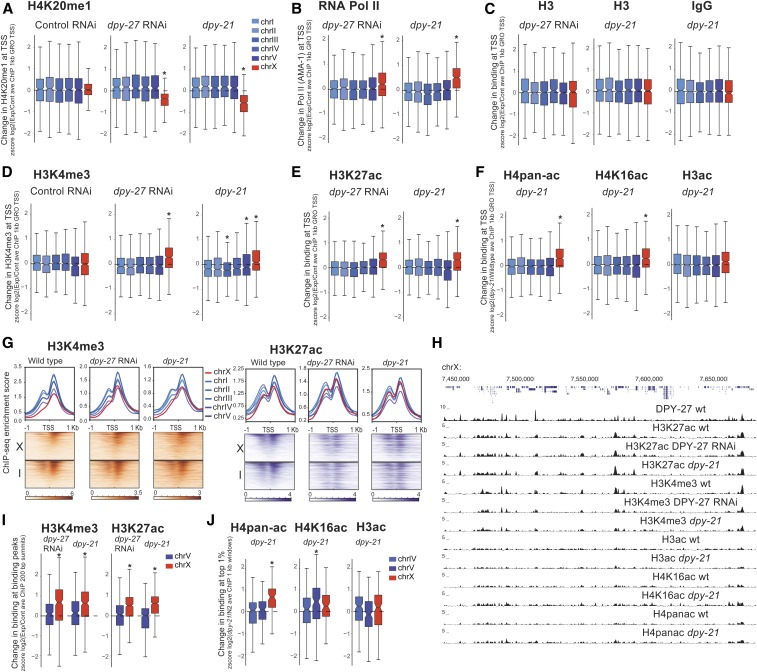
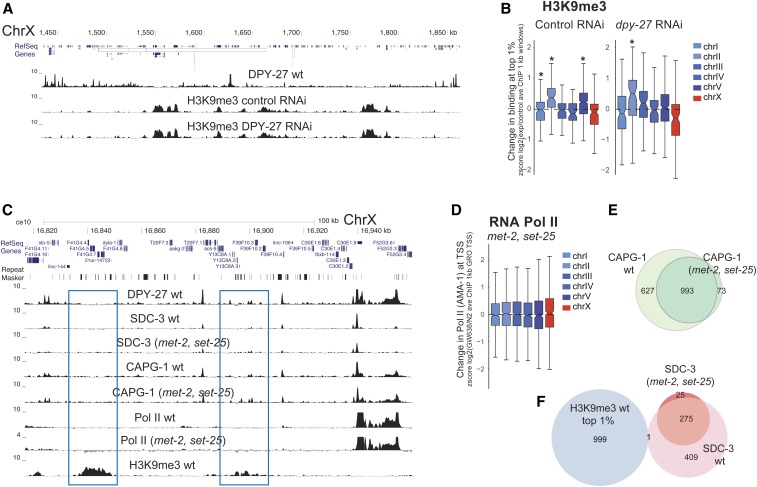
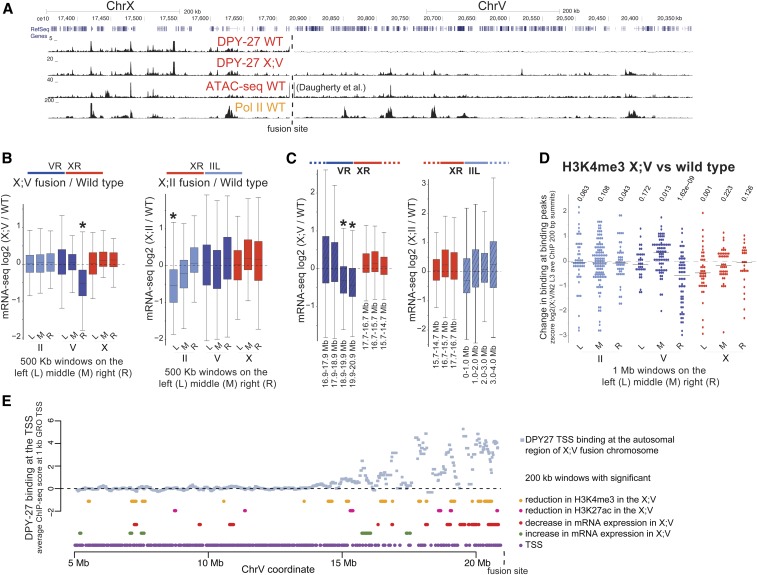
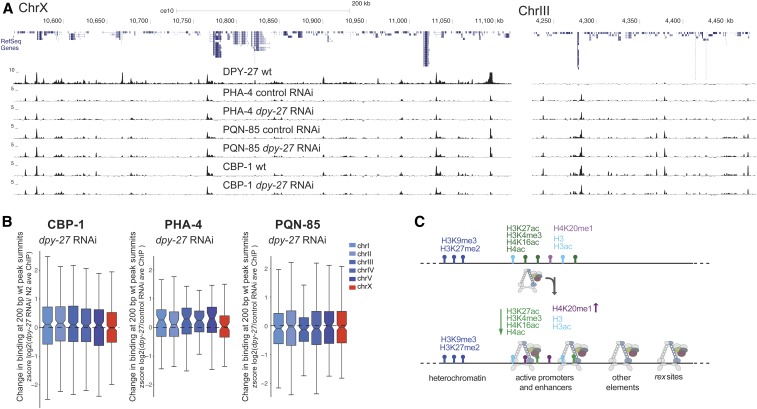
Condensins are evolutionarily conserved protein complexes that are required for chromosome segregation during cell division and genome organization during interphase. In Caenorhabditis elegans, a specialized condensin, which forms the core of the dosage compensation complex (DCC), binds to and represses X chromosome transcription. Here, we analyzed DCC localization and the effect of DCC depletion on histone modifications, transcription factor binding, and gene expression using chromatin immunoprecipitation sequencing and mRNA sequencing. Across the X, the DCC accumulates at accessible gene regulatory sites in active chromatin and not heterochromatin. The DCC is required for reducing the levels of activating histone modifications, including H3K4me3 and H3K27ac, but not repressive modification H3K9me3. In X-to-autosome fusion chromosomes, DCC spreading into the autosomal sequences locally reduces gene expression, thus establishing a direct link between DCC binding and repression. Together, our results indicate that DCC-mediated transcription repression is associated with a reduction in the activity of X chromosomal gene regulatory elements.

Keywords: C. elegans; X chromosome; chromatin; condensin; dosage compensation; gene expression; gene regulation; histone modifications; transcription.


Figures

Figure 1
Figure 1
DCC binding correlates with active chromatin marks at gene regulatory elements. (A) The C. elegans DCC contains a specialized condensin complex (condensin DC) that is distinguished from canonical condensin I by a single SMC-4 variant, DPY-27. The noncondensin DCC subunits SDC-2, SDC-3, and DPY-30 interact with condensin DC, and are required for its recruitment to the X chromosomes. DPY-21 is a histone demethylase that converts H4K20me2 to H4K20me1. DCC binds to and represses X chromosomes in hermaphrodites by approximately twofold. (B) ChIP-seq, DNase-seq (Ho et al. 2017), and ATAC-seq (Daugherty et al. 2017) profiles at a representative 250-kb region of the X chromosome in embryos and L3 larval stage worms. Example active and repressed chromatin regions are labeled in green and blue, respectively. DPY-27 (DCC) binding overlaps with Pol II binding, active chromatin marks, and accessible regions (ATAC-seq). (C) Spearman’s rank correlation values are shown for average ChIP-seq scores of histone modifications, and ATAC-seq and DNase-seq signals within 1-kb contiguous windows across the X chromosome in wild-type embryos. Zoomed-in plot highlights that DCC (DPY-27) binding positively correlates more with promoter marks (H3K4me3) and Pol II, with active enhancers (H3K27ac), and regulatory regions (ATAC-seq), and negatively correlates with repressive marks (H3K27me3 and H3K9me3). (D) The DPY-27 ChIP-seq peak summit coordinates were categorized according to their overlap with recruitment elements on the X chromosome [rex sites defined in Albritton et al. (2017)], promoters (+ and − strand) [within 250 bp of a GRO-seq (Kruesi et al. 2013) or 500 bp of a WormBase-defined TSS], active enhancers (overlapping a H3K27ac peak that is not a promoter), regulatory elements (overlapping an ATAC-seq or DNase-seq peak, and not a promoter or active enhancer), and other, unknown categories. DPY-27 (DCC), H3K4me3, and H3K27ac wild-type embryo ChIP-seq patterns are plotted across the DPY-27 ChIP-seq peak summits belonging to each category. (E) DCC, H3K4me3, and H3K27ac ChIP-seq and ATAC-seq signals are plotted across X chromosome TSSs [defined by GRO-seq (Kruesi et al. 2013)]; DCC signal coincides with the accessibility peak at promoters. ATAC-seq, assay for transposase-accessible chromatin using sequencing; ChIP-seq, chromatin immunoprecipitation sequencing; chr, chromosome; DC, condensin IDC; DCC, dosage compensation complex; DNase-seq, DNAse I hypersensitive site sequencing; GRO-seq, global run-on sequencing; modENCODE, Model Organism ENCyclopedia Of DNA Elements; Pol II, RNA polymerase II; SMC, structural maintenance of chromosomes; TSS, transcription start site.
Figure 2
Figure 2
DCC enrichment at promoters partially correlates with transcriptional activity. (A) DPY-27 ChIP-seq binding across example X chromosomal regions with differential transcription, as shown by Pol II ChIP-seq in embryos vs. L3s. (B) Average DPY-27 ChIP-seq score at 1-kb windows centering around the X chromosomal WB-defined TSS sites were plotted. Genes were categorized as expressed [N2 embryos FPKM > 1 (Kramer et al. 2015) and detected in GRO-seq (Kruesi et al. 2013)], silent (FPKM = 0 and not detected in GRO-seq), and maternally loaded (FPKM > 1 and not detected in GRO-seq). (C) Average DPY-27 and H3K4me3 ChIP-seq scores at proximal promoters [200 bp downstream to – TSS defined by Kruesi et al. (2013)] were plotted on the y-axis, and transcription levels of genes [GRO-seq counts at corresponding gene bodies (Kruesi et al. 2013)] were plotted on the x-axis. Spearman’s rank correlation coefficients are shown on the top left of each plot. (D) Changes in DPY-27 binding at promoters on the y-axis [z score of log2 L3/embryo ratio of average ChIP-seq score within proximal promoters as in (C)] were compared to changes in transcription on the x-axis [z score of log2 L3/embryo of transcription level as in (C)] in L3 vs. embryos. Changes in DPY-27 and H3K4me3 partially correlate with the change in transcription at individual promoters. (E) University of California, Santa Cruz browser view of DPY-27, H3K4me3, and Pol II ChIP-seq signals across a 40-kb region containing a recruitment site. The DCC-binding peak highlighted with a blue rectangle shows low Pol II and H3K4me3, suggesting that DCC enrichment and transcriptional activity at promoters can be uncoupled. ChIP-seq, chromatin immunoprecipitation sequencing; Chr, chromosome; DCC, dosage compensation complex; FPKM, fragments per kilobase of transcript per million mapped reads; GRO-seq, global run-on sequencing; Pol II, RNA polymerase II; TSS, transcription start site; WB, WormBase.
Figure 3
Figure 3
DCC is required for the reduction of active histone modifications on the X chromosome. Changes in levels of histone modifications upon DCC defects in embryos are plotted. Average ChIP enrichment within 1-kb windows centered at the GRO-seq-defined TSSs (Kruesi et al. 2013) was calculated in wild-type (N2), DCC mutant (dpy-21), and DCC-depleted (dpy-27 RNAi) embryos. Change in the level of each histone modification was measured by standardizing (z score) the log2 ratio of experimental to control ChIP-seq scores. Values from each chromosome were tested against all the other autosomes using a two-tailed Student’s t-test, and resulting P-values that were 0.001 were marked with an asterisk. This analysis captured the expected changes in H4K20me1 (A) and RNA Pol II (B) at X chromosomal promoters upon DCC defect. (C) Neither H3 nor IgG negative control ChIP-seq data showed a comparable difference in the dpy-21 mutant, and H3 in dpy-27 RNAi suggesting that nucleosome levels were not significantly affected. (D–F) Same analysis of different histone modifications associated with active transcription. Note that H4pan-ac antibody also recognizes H4K16ac, thus changes may be due to this modification. (G) ChIP-seq enrichment for H3K4me3 and H3K27ac in wild-type, dpy-21 mutant, and dpy-27 RNAi knockdown embryos was plotted across the GRO-seq-defined TSSs (Kruesi et al. 2013) on chromosomes X and I. The level of enrichment is ordered in a descending manner using maximum coverage in wild-type worms. Mutant data were plotted in the same order. (H) Genome browser view of ChIP-seq profiles in wild-type, mutant, and knockdown embryos over a 250-kb representative region of the X chromosome. The pattern of enrichment in wild-type worms and mutants is largely similar. (I) As in (A), but change in binding at the wild-type peak summit, rather than a TSS. Standardized (z score) log2 ratio of mutant/wild-type ChIP-seq score within a 200-bp window centering at the summit of peaks in wild-type embryos. (J) Similar analysis as in (I), but change in top 1% of 1-kb windows ordered by average ChIP-seq in wild-type embryos. ave, average; ChIP-seq, chromatin immunoprecipitation sequencing; chr, chromosome; DCC, dosage compensation complex; GRO-seq, global run-on sequencing; RNAi, RNA interference; RNA Pol II, RNA polymerase II; TSS, transcription start site.
Figure 4
Figure 4
DCC does not affect the levels of repressive histone marks. (A) ChIP-seq profile of H3K9me3 in control and DPY27 RNAi embryos along a representative region of chromosome X exemplifies no significant change in H3K9me3 upon DCC knockdown. (B) Distribution of standardized (z score) log2 dpy-27 RNAi/N2 ratios of H3K9me3 ChIP-seq average at the top 1% most enriched 1-kb windows. Values from each chromosome were tested against all the other autosomes using a two-tailed Student’s t-test, and resulting P-values that were 0.001 were marked with an asterisk. (C) ChIP-seq profiles of DPY-27, DCC subunits (SDC-3 and CAPG-1), Pol II, and H3K9me3 in wild-type embryos and the H3K9me3 null mutant (GW638, met-2, and set-25) across a representative region of the X chromosome. DCC and Pol II binding profiles remained similar in the met-2, set-25 mutant, including in regions enriched in H3K9me3 in wild-type worms (blue rectangle). (D) Pol II binding in the met-2, set-25 H3K9me3 null mutant (GW638) compared to N2 wild-type worms showed no specific effect on X chromosome expression. Distribution of standardized (z score) log2 mutant/N2 ratio of Pol II ChIP-seq within 1-kb windows centered at the GRO-seq-defined TSSs (Kruesi et al. 2013). (E) ChIP-seq peak overlap of DCC subunit CAPG-1 between wild-type and H3K9me3 null mutant. (F) ChIP-seq peak overlap between SDC-3 and top 1% H3K9me3 enriched 1-kb windows. ave, average; ChIP-seq, chromatin immunoprecipitation sequencing; Chr, chromosome; DCC, dosage compensation complex; GRO-seq, global run-on sequencing; RNAi, RNA interference; Pol II, RNA polymerase II; TSS, transcription start site.
Figure 5
Figure 5
DCC spreading into X;A fusion chromosomes reduces gene expression. (A) DPY-27 (DCC) ChIP-seq profile in the wild-type and X;V fusion chromosome-containing strains in L3 larvae. The spreading profile of the DCC in the autosomal region of the fusion chromosome is similar to that on the X, as indicated by the Pol II ChIP-seq and ATAC-seq signal in wild-type worms. (B) mRNA-seq analyses in wild-type embryos and strains containing X;V and X;II fusion chromosomes. DESeq log2 expression ratios were calculated and plotted for genes located within the middle, and the left- and right-most 500-kb windows of chromosomes II, V, and X. * P-value 0.001 (two-tailed Fisher’s test for each window against the rest of the windows across the genome). The schematics above the boxplots show which chromosome arms are fused. For X;II, the right end of X was fused to the left end of chromosome II, and for X;V, the right end of X was fused to the right end of chromosome V (Lowden et al. 2008). (C) Similar to (B), but expression ratios were plotted for genes within 1-Mb windows stepping out from the fusion site. The amount of repression decreases as a function of distance from the fusion border, following the pattern of DCC spreading (Ercan et al. 2009). (D) Change in H3K4me3 levels in X:V fusion chromosome compared to wild-type at the middle, left- and right-most 1-Mb windows of chromosomes II, V, and X. Standardized (z score) log2 X;V/wild-type ratios of ChIP-seq score within 200-bp H3K4me3 peak summits were plotted. H3K4me3 slightly but significantly decreases in the DCC spreading region (two-tailed Student’s t-test comparing ratios of each 1-Mb window against the rest across the genome). (E) Average DPY-27 ChIP-seq scores for 1-kb windows centering at GRO-seq-defined TSSs (Kruesi et al. 2013). Changes in expression and histone modifications were calculated by a moving average analysis using a 200-kb window with a 20-kb step size. For each 200-kb window, ChIP-seq and mRNA-seq ratios in X;V/wild-type were compared to the rest of the chromosome, and a P-value statistic was generated through a Student’s t-test. In this analysis, rather than asking if there is a significant change for each gene (as in DEseq), we asked whether the values in each window are higher or lower than the values observed for the rest of the windows along the chromosome. Windows with a P-value 0.01 are clustered toward the region of spreading. ATAC-seq, assay for transposase-accessible chromatin using sequencing; ChIP-seq, chromatin immunoprecipitation sequencing; Chr, chromosome; DCC, dosage compensation complex; GRO-seq, global run-on sequencing; L, left; M, middle; mRNA-seq, mRNA sequencing; R, right; TSS, transcription start site.
Figure 6
Figure 6
DCC knockdown does not indiscriminately reduce protein binding as measured by ChIP-seq. (A) ChIP-seq profiles of DPY-27 (condensin IDC subunit), PHA-4 (FOXA transcription factor), PQN-85 (Saccharomyces cerevisiae Scc2p homolog), and CBP-1 (putative H3K27 acetyltransferase) in representative regions on chromosomes X and III. (B) Analysis as in Figure 3I, plotting changes in protein binding across 200-bp wt peak summits. CBP-1, PQN-85, and PHA-4 levels on the X chromosomes did not change significantly upon DCC knockdown. (C) Summary of DCC binding and regulation of histone modifications on the X chromosomes. DCC-binding sites coincide with gene regulatory elements marked by accessible chromatin on the X. The majority of these elements also contain histone modifications associated with active transcription. The remaining include recruitment elements and sites that do not contain the analyzed histone modifications. DCC activity correlates with X-specific changes in the level of specific histone modifications (denoted by up and down arrows). ave, average; ChIP-seq, chromatin immunoprecipitation sequencing; Chr, chromosome; DCC, dosage compensation complex; RNAi, RNA interference; wt, wild-type.

Similar articles

Cited by

References

    1. Albritton S. E., Ercan S., 2018. Caenorhabditis elegans dosage compensation: insights into condensin-mediated gene regulation. Trends Genet. 34: 41–53. 10.1016/j.tig.2017.09.010 - DOI - PMC - PubMed
    1. Albritton S. E., Kranz A. L., Rao P., Kramer M., Dieterich C., et al. , 2014. Sex-biased gene expression and evolution of the x chromosome in nematodes. Genetics 197: 865–883. 10.1534/genetics.114.163311 - DOI - PMC - PubMed
    1. Albritton S. E., Kranz A. L., Winterkorn L. H., Street L. A., Ercan S., 2017. Cooperation between a hierarchical set of recruitment sites targets the X chromosome for dosage compensation. Elife 6: e23645 .10.7554/eLife.23645 - DOI - PMC - PubMed
    1. Anders S., Huber W., 2010. Differential expression analysis for sequence count data. Genome Biol. 11: R106 10.1186/gb-2010-11-10-r106 - DOI - PMC - PubMed
    1. Anders S., Pyl P. T., Huber W., 2015. HTSeq–a Python framework to work with high-throughput sequencing data. Bioinformatics 31: 166–169. 10.1093/bioinformatics/btu638 - DOI - PMC - PubMed

Publication types

MeSH terms