

Inferring the Nature of Missing Heritability in Human Traits Using Data from the GWAS Catalog
- PMID: 31123044
- PMCID: PMC6614893
- DOI: 10.1534/genetics.119.302077
Inferring the Nature of Missing Heritability in Human Traits Using Data from the GWAS Catalog
Abstract
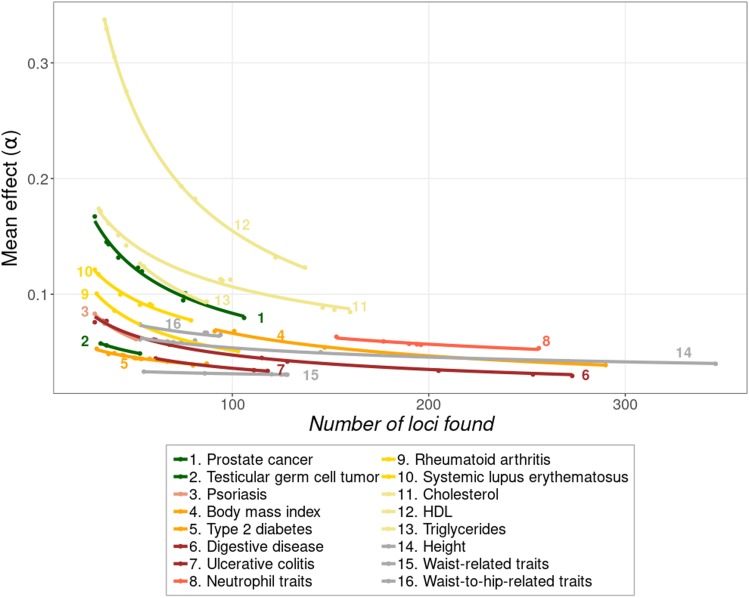
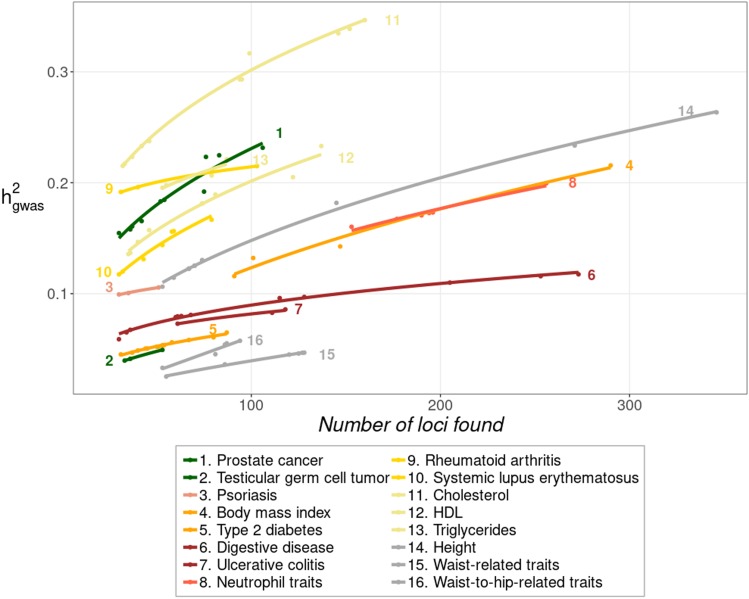
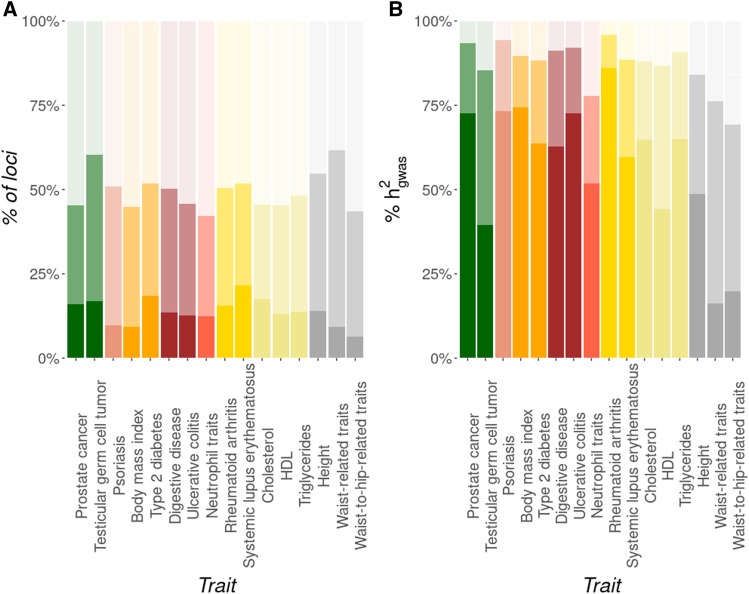
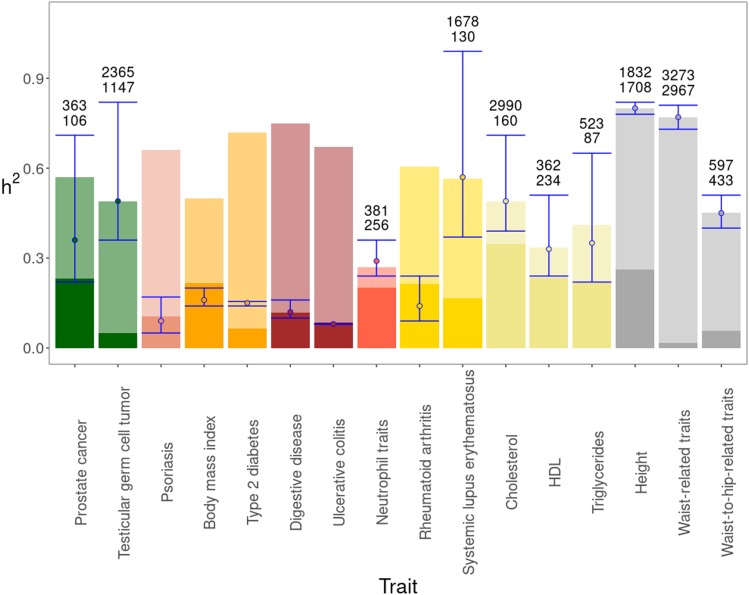
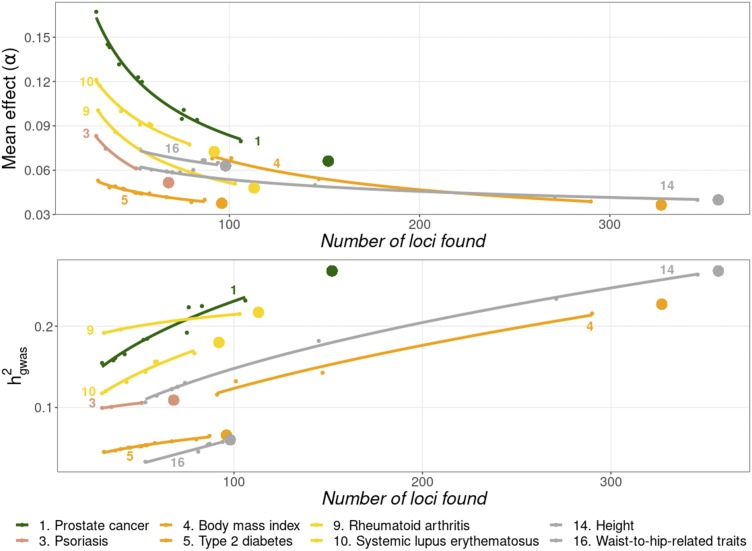
Thousands of genes responsible for many diseases and other common traits in humans have been detected by Genome Wide Association Studies (GWAS) in the last decade. However, candidate causal variants found so far usually explain only a small fraction of the heritability estimated by family data. The most common explanation for this observation is that the missing heritability corresponds to variants, either rare or common, with very small effect, which pass undetected due to a lack of statistical power. We carried out a meta-analysis using data from the NHGRI-EBI GWAS Catalog in order to explore the observed distribution of locus effects for a set of 42 complex traits and to quantify their contribution to narrow-sense heritability. With the data at hand, we were able to predict the expected distribution of locus effects for 16 traits and diseases, their expected contribution to heritability, and the missing number of loci yet to be discovered to fully explain the familial heritability estimates. Our results indicate that, for 6 out of the 16 traits, the additive contribution of a great number of loci is unable to explain the familial (broad-sense) heritability, suggesting that the gap between GWAS and familial estimates of heritability may not ever be closed for these traits. In contrast, for the other 10 traits, the additive contribution of hundreds or thousands of loci yet to be found could potentially explain the familial heritability estimates, if this were the case. Computer simulations are used to illustrate the possible contribution from nonadditive genetic effects to the gap between GWAS and familial estimates of heritability.
Keywords: GWAS; big data; missing heritability; prediction of complex traits.
Copyright © 2019 by the Genetics Society of America.
Figures
Similar articles
-
GWEHS: A Genome-Wide Effect Sizes and Heritability Screener.Genes (Basel). 2019 Jul 24;10(8):558. doi: 10.3390/genes10080558. Genes (Basel). 2019. PMID: 31344961 Free PMC article.
-
Regional heritability mapping and genome-wide association identify loci for complex growth, wood and disease resistance traits in Eucalyptus.New Phytol. 2017 Feb;213(3):1287-1300. doi: 10.1111/nph.14266. Epub 2016 Nov 7. New Phytol. 2017. PMID: 28079935
-
Multitrait genome association analysis identifies new susceptibility genes for human anthropometric variation in the GCAT cohort.J Med Genet. 2018 Nov;55(11):765-778. doi: 10.1136/jmedgenet-2018-105437. Epub 2018 Aug 30. J Med Genet. 2018. PMID: 30166351 Free PMC article.
-
Evolutionary perspectives on polygenic selection, missing heritability, and GWAS.Hum Genet. 2020 Jan;139(1):5-21. doi: 10.1007/s00439-019-02040-6. Epub 2019 Jun 14. Hum Genet. 2020. PMID: 31201529 Free PMC article. Review.
-
Missing heritability and strategies for finding the underlying causes of complex disease.Nat Rev Genet. 2010 Jun;11(6):446-50. doi: 10.1038/nrg2809. Nat Rev Genet. 2010. PMID: 20479774 Free PMC article. Review.
Cited by
-
GWEHS: A Genome-Wide Effect Sizes and Heritability Screener.Genes (Basel). 2019 Jul 24;10(8):558. doi: 10.3390/genes10080558. Genes (Basel). 2019. PMID: 31344961 Free PMC article.
-
Kernel-based gene-environment interaction tests for rare variants with multiple quantitative phenotypes.PLoS One. 2022 Oct 12;17(10):e0275929. doi: 10.1371/journal.pone.0275929. eCollection 2022. PLoS One. 2022. PMID: 36223383 Free PMC article.
-
Accelerated inbreeding depression suggests synergistic epistasis for deleterious mutations in Drosophila melanogaster.Heredity (Edinb). 2019 Dec;123(6):709-722. doi: 10.1038/s41437-019-0263-6. Epub 2019 Sep 2. Heredity (Edinb). 2019. PMID: 31477803 Free PMC article.
-
Leveraging Single-Cell Populations to Uncover the Genetic Basis of Complex Traits.Annu Rev Genet. 2023 Nov 27;57:297-319. doi: 10.1146/annurev-genet-022123-110824. Epub 2023 Aug 10. Annu Rev Genet. 2023. PMID: 37562412 Free PMC article. Review.
-
Genetic control of non-genetic inheritance in mammals: state-of-the-art and perspectives.Mamm Genome. 2020 Jun;31(5-6):146-156. doi: 10.1007/s00335-020-09841-5. Epub 2020 Jun 11. Mamm Genome. 2020. PMID: 32529318 Free PMC article. Review.
References
-
- Akaike H., 1974. A new look at the statistical model identification. IEEE Trans. Automat. Contr. 19: 716–723. 10.1109/TAC.1974.1100705 - DOI
Publication types
MeSH terms
LinkOut - more resources
Full Text Sources
Miscellaneous
