. 2019 Jul;31(7):1614-1632.
doi: 10.1105/tpc.18.00500. Epub 2019 May 13.

Default Activation and Nuclear Translocation of the Plant Cellular Energy Sensor SnRK1 Regulate Metabolic Stress Responses and Development

Affiliations

Default Activation and Nuclear Translocation of the Plant Cellular Energy Sensor SnRK1 Regulate Metabolic Stress Responses and Development

Matthew Ramon et al. Plant Cell. 2019 Jul.

Abstract

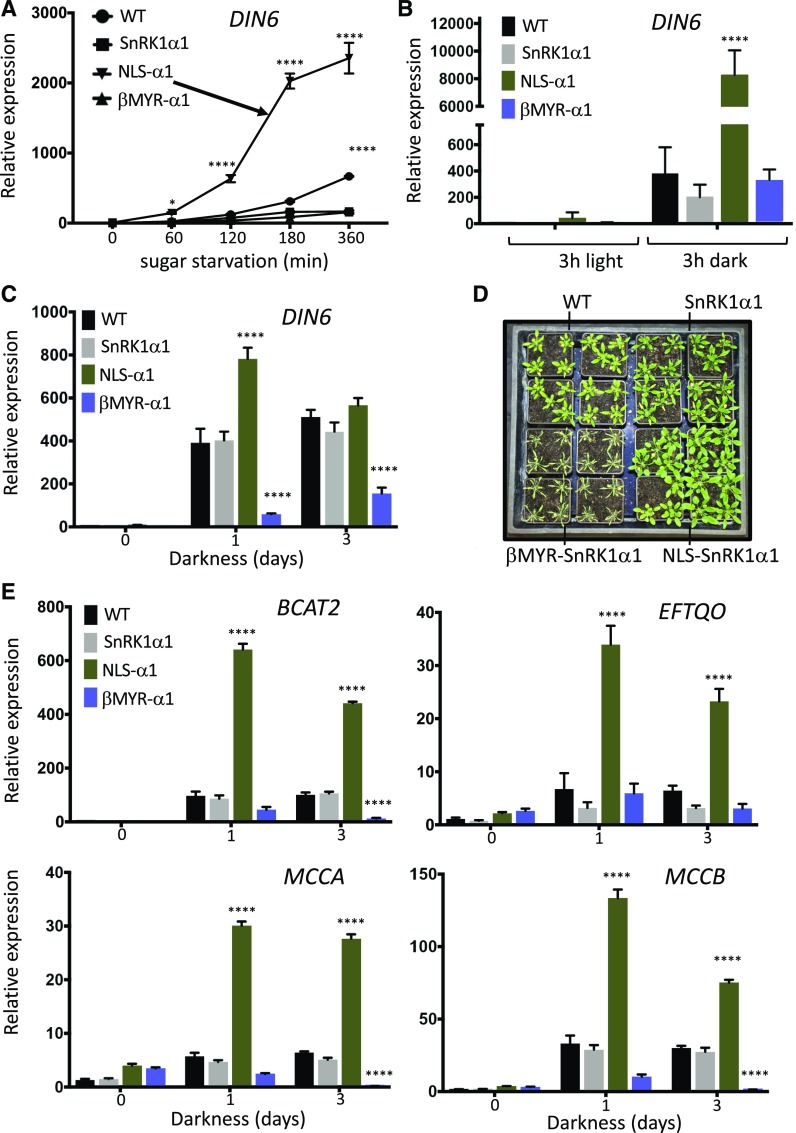
Energy homeostasis is vital to all living organisms. In eukaryotes, this process is controlled by fuel gauging protein kinases: AMP-activated kinase in mammals, Sucrose Non-Fermenting1 (SNF1) in yeast (Saccharomyces cerevisiae), and SNF1-related kinase1 (SnRK1) in plants. These kinases are highly conserved in structure and function and (according to this paradigm) operate as heterotrimeric complexes of catalytic-α and regulatory β- and γ-subunits, responding to low cellular nucleotide charge. Here, we determined that the Arabidopsis (Arabidopsis thaliana) SnRK1 catalytic α-subunit has regulatory subunit-independent activity, which is consistent with default activation (and thus controlled repression), a strategy more generally used by plants. Low energy stress (caused by darkness, inhibited photosynthesis, or hypoxia) also triggers SnRK1α nuclear translocation, thereby controlling induced but not repressed target gene expression to replenish cellular energy for plant survival. The myristoylated and membrane-associated regulatory β-subunits restrict nuclear localization and inhibit target gene induction. Transgenic plants with forced SnRK1α-subunit localization consistently were affected in metabolic stress responses, but their analysis also revealed key roles for nuclear SnRK1 in leaf and root growth and development. Our findings suggest that plants have modified the ancient, highly conserved eukaryotic energy sensor to better fit their unique lifestyle and to more effectively cope with changing environmental conditions.


Figures

Figure 1.
Figure 1.
Constitutive Regulatory Subunit-Independent Activity of the SnRK1 Catalytic α-Subunit. (A) Space-filling homology models of the SnRK1α1β2βγ heterotrimeric complex, the FL (512-amino acid) SnRK1α1 subunit, and the truncated SnRK1α1 proteins, lacking part of (404-amino acid, 333-amino acid) or the entire regulatory domain (290-amino acid). The regulatory-α C-terminal domain (αCTD), α-linker, and ubiquitin-associated (UBA) domain are indicated in addition to the N-lobe, C-lobe, and catalytic cleft of the catalytic domain. (B) Loss of SnRK1α1 interaction with the regulatory SnRK1β2 subunit upon truncation. CoIP of transiently coexpressed FL and truncated SnRK1α-HA with FLAG-tagged SnRK1β2 from Arabidopsis Col-0 leaf mesophyll protoplasts. Protein input and IP were visualized by immunoblot analysis using anti-HA and anti-FLAG epitope tag antibodies, as indicated. (C) DIN6 promoter activity in leaf mesophyll protoplasts upon transient coexpression of FL and truncated SnRK1α1 subunits. Relative and normalized LUC reporter values are averages with sds, n = 6 biological repeats (independent protoplast transfections). One-way ANOVA statistical analysis was performed in GraphPad Prism v7, ****P < 0.0001. Protein expression was assessed by immunoblot analysis with anti-HA and anti-FLAG antibodies. RBCS staining with Coomassie Brilliant Blue R-250 was used as a protein loading control. (D) qRT-PCR analysis of (induced) DIN1/SEN1 and (repressed) EXP10 SnRK1 target gene expression in leaf mesophyll protoplasts expressing the SnRK1α1 subunit. Values are averages with sds, n = 3 technical repeats. One-way ANOVA statistical analysis was performed in GraphPad Prism v7, ns = not significant. (E) Phos-tag acrylamide-based (Wako Chemicals) mobility shift assay of (T175) T-loop phosphorylation of FL and truncated (404, 333, and 290 amino acids) SnRK1α1-HA proteins expressed in leaf mesophyll protoplasts. SnRK1α1 T175A was included as a negative control for T-loop phosphorylation. SnRK1α1 K48M is a kinase-dead (ATP binding site mutant) control. Arrows indicate phosphorylated protein bands. Immunoblot analysis was performed using anti-HA and anti-FLAG antibodies and RBCS staining with Coomassie Brilliant Blue R-250 as a protein loading control. (F) Yeast mutant complementation. Growth of yeast snf1Δ and snf1Δsnf4Δgal83Δsip1Δsip2Δ (αβγ null) mutants expressing Snf1, SnRK1α1/KIN10, and SnRK1α2/KIN11 on fermentable Glc (Glc 2% [w/v]) and nonfermentable Glycerol (Gly 2% [v/v]-Ethanol (Eth; EtOH 3% [v/v]) medium. WT, wild type.
Figure 2.
Figure 2.
Inhibition of SnRK1α Target Gene Induction, But Not Repression, by the Regulatory SnR1β2 Subunit. (A) DIN6 promoter activity (activation) in Arabidopsis leaf mesophyll protoplasts upon transient coexpression of SnRK1α1 with SnRK1β1, SnRK1β2, and SnRK1β3. (B) DIN6 promoter activity in leaf mesophyll protoplasts upon transient coexpression of FL and truncated (290-amino acid) SnRK1α1 with SnRK1β2. (C) DIN6 promoter activity in leaf mesophyll protoplasts upon transient coexpression of SnRK1α1 with FL SnRK1β2 and with SnRK1β2 lacking the C-terminal domain (−βCTD) or carbohydrate-binding module (−CBM). (D) Phos-tag acrylamide-based (Wako Chemicals) mobility shift assay of (T175) T-loop phosphorylation of SnRK1α1-HA in leaf mesophyll protoplasts coexpressing SnRK1β2-FLAG. SnRK1α1 T175A-HA was included as a negative control. Arrows indicate phosphorylated protein bands of SnRK1α1 (black arrow) and SnRK1β2 (gray arrow). (E) DIN6 promoter activity in leaf mesophyll protoplasts upon transient coexpression of SnRK1α1 with SnRK1β2, FL SnRK1βγ, and a truncated SnRK1βγ, lacking the N-terminal carbohydrate-binding module (−CBM). (F) EXP10 promoter activity (repression) in leaf mesophyll protoplasts upon transient coexpression of SnRK1α1 and SnRK1β2. Relative and normalized LUC reporter values are averages with sds, n = 6 (A), (B), (E), (F), or three (C) biological replicates (independent protoplast transfections). One-way ANOVA statistical analysis was performed in GraphPad Prism v7, ****P < 0.0001; ns = not significant. Protein expression of HA- and FLAG-tagged proteins was assessed by immunoblot analysis with anti-HA and anti-FLAG antibodies, using RBCS staining with Coomassie Brilliant Blue R-250 as a protein loading control.
Figure 3.
Figure 3.
SnRK1β2 Controls the Subcellular Localization of SnRK1α1. (A) Fluorescence microscopy analysis of the subcellular localization of SnRK1β2-GFP and SnRK1β2-G2A-GFP in leaf mesophyll protoplasts, 16 h after transfection. DIC, differential interference contrast image; G2A, Gly2 to Ala mutation (causing loss of N-MYR). (B) Immunoblot analysis of nuclear (Nucl) and cytoplasmic (Cyto) fractions of endogenous SnRK1α1 and SnRK1β2 proteins in leaf mesophyll cells using specific anti-SnRK1α1 and anti-SnRK1β2 antibodies. Anti-Histone H3 antibodies and RBCS staining with Coomassie Brilliant Blue R-250 serve as controls for purity of the nuclear and cytoplasmic fractions, respectively. Ten percent of the cytoplasmic fractions and the complete nuclear fractions of samples were used for analysis. (C) Fluorescence microscopy analysis of the subcellular localization of SnRK1α1-GFP in leaf mesophyll protoplasts upon coexpression of SnRK1β2 and SnRK1β2-G2A, 16 h after transfection. An SCF30-RFP nuclear reporter was also coexpressed. This reporter produces orange fluorescence in the nucleus. Colocalization with a nuclear GFP fusion protein produces a green to yellow color. Broken circles indicate the nucleus. (D) Confocal image closeups of the nuclear areas of mesophyll protoplasts expressing SnRK1α1-GFP without and with SnRK1β2 coexpression in the absence of the SCF30-RFP nuclear reporter. Arrows indicate localization at/around the nuclear membrane. Localization studies have been repeated at least three times independently for each construct combination with consistent results. Representative pictures are shown.
Figure 4.
Figure 4.
Effects of Altered SnRK1α1 and SnRK1β2 Localization on SnRK1 Target Gene Expression. (A) DIN6 promoter activity in leaf mesophyll protoplasts upon transient expression of SnRK1α1 proteins with an SV40 NLS or SnRK1β2 (wild type or G2A mutant) nine-amino acid N-MYR (βMYR) domain. (B) EXP10 promoter activity in leaf mesophyll protoplasts upon transient expression of SnRK1α1 proteins with an SV40 NLS or SnRK1β2 nine-amino acid N-MYR (βMYR) domain. (C) DIN6 promoter activity in leaf mesophyll protoplasts upon transient coexpression of HA-tagged SnRK1α1 and NLS-SnRK1α1 proteins with SnRK1β2 and NLS-SnRK1β2 proteins. Relative and normalized LUC reporter values are averages with sds, n = 3 (A), (C), or 4 (B) biological replicates (independent protoplast transfections). One-way ANOVA statistical analysis was performed in GraphPad Prism7, ****P < 0.0001; ***P < 0.001; **P < 0.01; ns = not significant. Protein expression was assessed by immunoblot analysis with anti-HA antibodies, using RBCS staining with Coomassie Brilliant Blue R-250 as a protein loading control.
Figure 5.
Figure 5.
Metabolic Stress-Induced Endogenous SnRK1α1 Translocation. (A) qRT-PCR analysis of circadian DIN6 expression in Arabidopsis wild-type Col-0 plants grown for 4 weeks in soil (blue), and the effect on DIN6 expression of an extended (6 to 12 h) night (red). Values are averages with sds, n = 3 with three pooled leaves each. (B) Immunoblot analysis of nuclear (N) and cytoplasmic (C) fractions of endogenous SnRK1α1 at different time points during the day–night cycle and in extended darkness using specific anti-SnRK1α1 antibodies. (C) Immunoblot analysis of nuclear (N) and cytoplasmic (C) fractions of endogenous SnRK1α1 and SnRK1β2 in leaf mesophyll cells in control and metabolic stress conditions (6-h hypoxia, DCMU, and dark treatment). Anti-Histone H3 antibodies and RBCS staining with Coomassie Brilliant Blue R-250 serve as controls for purity of the nuclear and cytoplasmic fractions, respectively. Ten percent of the cytoplasmic fractions and complete nuclear fractions of the samples were used for analysis.
Figure 6.
Figure 6.
Altered SnRK1α1 Localization Affects Leaf Growth and Development. (A) Distinct leaf shape phenotypes of 4-week–old soil-grown snrk1α1/snrk1α1 snrk1α2/snrk1α2 (kin10/kin10 kin11/kin11) Arabidopsis plants complemented with genomic βMYR-SnRK1α1 (left), SnRK1α1 (middle), and NLS-SnRK1α1 (right) constructs. (B) Dissected rosettes of wild type and complemented lines. WT, wild type. (C) Quantitative analysis of leaf shape. The leaf length:width ratio was determined using the software ImageJ for all rosette leaves of wild type and complemented lines. Values are averages with sds; n = 3 leaf series.
Figure 7.
Figure 7.
Altered SnRK1 α1 Localization Affects Root Growth and Development. (A) Primary root growth of wild-type (WT) and SnRK1α1 (α1), βMYR-SnRK1α1 (βMYR-α1), and NLS-SnRK1α1 (NLS-α1) complemented plants 10 d after sowing on 1/2 MS medium supplemented with 0.5% Glc. Representative seedlings are shown. (B) Quantitative analysis of primary root length root length of 20 wild-type (WT) and complemented mutant seedlings 10 d after sowing on 1/2 MS medium supplemented with 0.5% Glc using the software ImageJ. Values are averages with sds. One-way ANOVA statistical analysis was performed in GraphPad Prism v7, ****P < 0.0001. (C) Root meristems of 15 wild-type and complemented mutant seedlings 10 d after sowing on 1/2 MS medium supplemented with 0.5% Glc. Representative pictures are shown. WT, wild type. (D) and (E) Root meristem size as quantified by (D) length and (E) number of cells in a single cell file. Values are averages with sds. One-way ANOVA statistical analysis was performed in GraphPad Prism v7, ****P < 0.0001, *P < 0.05. WT, wild type. (F) Root hairs of complemented mutant seedlings 10 d after sowing on 1/2 MS medium supplemented with 0.5% Glc. Representative roots are shown. (G) Distribution of root hair lengths of 20 wild-type or complemented mutant seedlings, measured using the software ImageJ. WT, wild type.
Figure 8.
Figure 8.
Altered SnRK1α1 Subcellular Localization Affects Metabolic Stress Responses. (A) qRT-PCR analysis of DIN6 expression in wild-type (WT) and kin10/kin10 kin11/kin11 seedlings, complemented with SnRK1α1 (SnRK1α1), NLS-SnRK1α1 (NLS-α1), and βMYR-SnRK1α1 (βMYR-α1) at different time points after removal of sugar from the 1/2 MS growth medium (sugar starvation). Values are averages with sds, n = 3 biological repeats (15 pooled seedlings each). Two-way ANOVA statistical analysis was performed in GraphPad Prism v7, ****P < 0.0001. (B) qRT-PCR analysis of DIN6 expression in leaves of wild-type (WT) and SnRK1α1-complemented kin10/kin10 kin11/kin11 plants 3 h after detachment and incubation in the light or dark. Values are averages with sds, n = 3 biological repeats (three pooled leaves each). Two-way ANOVA statistical analysis was performed in GraphPad Prism v7, ****P < 0.0001. (C) qRT-PCR analysis of DIN6 expression in 4-week–old wild-type (WT) and SnRK1α1-complemented kin10/kin10 kin11/kin11 plants transferred to complete darkness for 3 d. Values are averages with sds, n = 3 biological replicates (three pooled leaves each). Two-way ANOVA statistical analysis was performed with GraphPad Prism v7, ****P < 0.0001. (D) Phenotypes of wild-type (WT) and SnRK1α1-complemented kin10/kin10 kin11/kin11 plants after 3 d of complete dark incubation. (E) qRT-PCR analysis of BCAT2, ETFQO, MCCA, and MCCB gene expression in 4-week–old wild-type (WT) and SnRK1α1-complemented kin10/kin10 kin11/kin11 plants transferred to complete darkness for 3 d. Values are averages with sds, n = 3 biological replicates (three pooled leaves each). Two-way ANOVA statistical analysis was performed with GraphPad Prism v7, ****P < 0.0001.
None

Similar articles

Cited by

References

    1. Alderson A., Sabelli P.A., Dickinson J.R., Cole D., Richardson M., Kreis M., Shewry P.R., Halford N.G. (1991). Complementation of snf1, a mutation affecting global regulation of carbon metabolism in yeast, by a plant protein kinase cDNA. Proc. Natl. Acad. Sci. USA 88: 8602–8605. - PMC - PubMed
    1. Ávila-Castañeda A., Gutiérrez-Granados N., Ruiz-Gayosso A., Sosa-Peinado A., Martínez-Barajas E., Coello P. (2014). Structural and functional basis for starch binding in the SnRK1 subunits AKINβ2 and AKINβγ. Front. Plant Sci. 5: 199. - PMC - PubMed
    1. Baekelandt A., Pauwels L., Wang Z., Li N., De Milde L., Natran A., Vermeersch M., Li Y., Goossens A., Inzé D., Gonzalez N. (2018). Arabidopsis leaf flatness is regulated by PPD2 and NINJA through repression of CYCLIN D3 genes. Plant Physiol. 178: 217–232. - PMC - PubMed
    1. Baena-González E., Hanson J. (2017). Shaping plant development through the SnRK1-TOR metabolic regulators. Curr. Opin. Plant Biol. 35: 152–157. - PubMed
    1. Baena-González E., Rolland F., Thevelein J.M., Sheen J. (2007). A central integrator of transcription networks in plant stress and energy signalling. Nature 448: 938–942. - PubMed

Publication types

MeSH terms

Substances