. 2019 Aug;25(8):985-1003.
doi: 10.1261/rna.070409.119. Epub 2019 May 23.

In silico survey of the central conserved regions in viroids of the Pospiviroidae family for conserved asymmetric loop structures

Affiliations

In silico survey of the central conserved regions in viroids of the Pospiviroidae family for conserved asymmetric loop structures

Paul Freidhoff et al. RNA. 2019 Aug.

Abstract

Viroids are the smallest replicative pathogens, consisting of RNA circles (∼300 nucleotides) that require host machinery to replicate. Structural RNA elements recruit these host factors. Currently, many of these structural elements and the nature of their interactions are unknown. All Pospiviroidae have homology in the central conserved region (CCR). The CCR of potato spindle tuber viroid (PSTVd) contains a sarcin/ricin domain (SRD), the only viroid structural element with an unequivocal replication role. We assumed that every member of this family uses this region to recruit host factors, and that each CCR has an SRD-like asymmetric loop within it. Potential SRD or SRD-like motifs were sought in the CCR of each Pospiviroidae member as follows. Motif location in each CCR was predicted with MUSCLE alignment and Vienna RNAfold. Viroid-specific models of SRD-like motifs were built by superimposing noncanonical base pairs and nucleotides on a model of an SRD. The RNA geometry search engine FR3D was then used to find nucleotide groups close to the geometry suggested by this superimposition. Atomic resolution structures were assembled using the molecular visualization program Chimera, and the stability of each motif was assessed with molecular dynamics (MD). Some models required a protonated cytosine. To be stable within a cell, the pKa of that cytosine must be shifted up. Constant pH-replica exchange MD analysis showed such a shift in the proposed structures. These data show that every Pospiviroidae member could form a motif that resembles an SRD in its CCR, and imply there could be undiscovered mimics of other RNA domains.

Keywords: Loop E RNA; RNA domains; RNA dynamics; RNA mimicry; S-turn; constant pH replica exchange molecular dynamics; molecular dynamics; sarcin/ricin domain.


Figures

FIGURE 1.
FIGURE 1.
(A) The Westhof–Leontis (Leontis and Westhof 2001) nomenclature for ncbps in RNA is demonstrated using the triplet from a standard sarcin/ricin domain (SRD). (B) The S- and H-strands of the SRD in the 5S RNA of H. marismortui [PDBid 1S72, (Klein et al. 2004)]. The backbone is depicted using pseudobonds connecting the phosphorus (gold circle) and C4′ of each nucleotide. Depth cueing shows the H-strand is behind the S-strand. The bases in the triplet have been labeled. The levels described in part C are given to the left. (C) The 5S SRD of PDBid 1S72 has been labeled with the proposed SRD-like numbering system. The backbone paths of the S-strands meander and the H-strands are traced in red. N indicates any base; the double horizontal lines indicate any canonical or wobbled pairing. The nucleotides with the patterned background are optional extensions of the SRD-like domain. The double question marks indicate an unspecified noncanonical pairing.
FIGURE 2.
FIGURE 2.
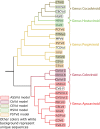
Taxonomy of Pospiviroidae (Di Serio et al. 2014) color coded by SRD-like internal loop sequence. Horizontal spacing does not correlate to precise evolutionary distance. ADFVd, Apple dimple fruit viroid; ASSVd, Apple scar skin viroid; AGVd, Australian grapevine viroid; CSVd, Chrysanthemum stunt viroid; CBCVd, Citrus bark cracking viroid; CBLVd, Citrus bent leaf viroid; CDVd, Citrus dwarfing viroid; CVd-V, Citrus viroid V; CVd-VI, Citrus viroid VI; CEVd, Citrus exocortis viroid; CCCVd, Coconut cadang-cadang viroid; CTiVd, Coconut tinangaja viroid; CbVd1, Coleus blumei viroid 1; CbVd2, Coleus blumei viroid 2; CbVd3, Coleus blumei viroid 3; CLVd, Columnea latent viroid; GYSVd-1, Grapevine yellow speckle viroid 1, GYSVd-2, Grapevine yellow speckle viroid 2; HLVd, Hop latent viroid; HSVd, Hop stunt viroid; IrVd Iresine viroid 1; MPVd, Mexican papita viroid; PBCVd, Pear blister canker viroid; PCFVd, Pepper chat fruit viroid; PSTVd, Potato spindle tuber viroid; TASVd, Tomato apical stunt viroid; TCDVd, Tomato chlorotic dwarf viroid; TPMVd, Tomato planta macho viroid.
FIGURE 3.
FIGURE 3.
Proposed structures for the SRD in PSTVd and mSRD in HSVd. (A) Sequence of the internal loops from PSTVd and HSVd and the sources (PDBid) for the ncbp structures used in the production of the models. (B) A comparison of the U-A handles from the SRD of PSTVd and the C+ tWW Csyn ncbp of the triplet in the mSRD of HSVd. The top pair shows an idealized structure with explicit hydrogen bonding. Below that are the pairs from the triplets shown in part C. (C) Structures of the centroids from the major cluster for PSTVd and HSVd. The top middle shows a P-C4′ backbone of four groups: two SRD (PSTVd and ASSVd) and two mSRD (CbVd and HSVd). The phosphorus and C4′ atoms from the core of each domain fitted to the PSTVd backbone (H and S levels –2, –1, 0, and 1). The bottom center shows the PSTVd and HSVd SRD-like domains from the same point of view as the backbone structure above. Level is given between the two structures. Each noncanonical nucleotide pair or triplet is shown on the outside. The nucleotide labels follow the view in the inset, not the order in part A. Note that the triplet from PSTVd is in two ovals connected by a line. The symbol for the interaction of the C with the U-A handle is faded to indicate that this interaction is not maintained.
FIGURE 4.
FIGURE 4.
pH-REMD indicates that the mSRD structure perturbs the pKa’s of C[0S] and C[0′H]. (A) A control calculation on the trinucleotide UpCpU. The relative frequencies of acceptance of the protonated cytosine (yellow circles) and unprotonated form (green circle) are shown as a function of pH. The yellow and green curves give the pH dependence of the relative concentrations of the acid and base forms expected when the pKa is 4.2. (B) Low and high pH runs for the HSVd mSRD. Both C[0S] (circles: yellow, protonated; green, unprotonated) and C[0′H] (diamonds: red, protonated; blue, unprotonated) were made dissociable. The yellow and green lines give the pH dependence of the acid and base forms for pKa 9.8, while the red and blue lines give the pH dependence for pKa 2.5. (C) The const pH-REMD exchange frequency versus pH for the mSRD of CbVd. The shape and color scheme are the same as part B. The red/blue and yellow/green pairs of lines are for pKa’s 6.3 and 6.4, respectively.
FIGURE 5.
FIGURE 5.
Communication propensities of PSTVd's SRD and HSVd's mSRD. The upper right triangle of each heat map gives the CProps of frames in the largest cluster from a 500 nsec MD trajectory for each domain. Squares are colored following the upper color key. Each grid has entries for all positions found in the two viroids. Since each has a nucleotide not present in the other, the squares of the row or column contain “na” for not applicable. Squares for paired bases are designated with an orange border. The upper right maps also present long-range communication propensities using colored borders as indicated by the colored rectangles in the key. These are given for LRCProps found in the domain core (small squares in sequence keys) and for the rest of the domain (large squares). The core LRCProp that is shared by all domains investigated has a navy-blue border. For clarity, the LRCProp data is also presented in the lower left triangle of the PSTVd map. The lower left triangle of the HSVd map presents a difference map, PSTVd subtracted from HSVd. If either PSTVd or HSVd has no nucleotide at a position, the square is marked “na.”
FIGURE 6.
FIGURE 6.
Examples of the plasticity of the SRD and mSRD domains of viroids. Conformation information from two MD trajectories is presented. Images show bases connected to a P-C4′ backbone with pseudobonds from each C4′ to its glycosidic nitrogen. Carbons and phosphates are NDB base color coded (A red; C yellow; G green; U cyan). Each view has the S-strand on the left and the H-strand on the right. Numbers to the right indicate the domain position level. Depth cueing fades the back of each structure. Each domain sequence is given to the right of the plots. The black bases are those depicted in the images. The central image shows the centroid from the largest cluster. Examples of different conformations are to the left and right. The plots show the variation of distances and angles over the course of the 500 nsec MD trajectory. The black arrows indicate the frames shown in the images. (A) The U∼A handle of CEVd has different geometries. A[0′H] and A[1S] have extensive cross-stacking which remains constant throughout the trajectory. In contrast, the U moves. In the principle conformation, its W edge makes one or two hydrogen bonds to the H edge of A[0′H]. However, the U can rotate its S edge toward the A, requiring bridging waters (not shown) rather than direct hydrogen bonds to interact with the A. This separation and rotation can be monitored with the U[0S]O4 to A[0′H]N7 distance (purple dashed line). This distance is plotted below the images. The stacking also changes. In the centroid, A[0′H] stacks on both A[–1′H] and A[–1S]. In the left-side conformation, A[0′H] stacks predominantly on A[–1′H], while in the right-side conformation it stacks on A[–1S]. (B) The wobbled A-C pair at position –1 of HSVd has different geometries. C[–1S]∼A[–1′H] of the centroid has a typical cis W interaction that makes two hydrogen bonds. The A does not stack well the bases above or below it. This pair often separates. The adenine will then stack with A[–2′H] (left) or with C[–1S] (right). This motion can be monitored via the angle A[–1′H] makes with A[–2′H] as determined from vectors normal to each base's six-membered ring (orange arrows). This angle is presented in the plot below the images.
FIGURE 7.
FIGURE 7.
Base stacking in the SRD-like domains. The centroids from the largest cluster for ASSVd, PSTVd, HSVd, and CbVd are shown. Bases analogous to ten bases in the λ stack of PSTVd are shown as 90% van der Waals radii space-filling atoms [1′HA or 2′H, 1′H, 0S, 0′H, –1S,–1′H, –2 s,–2′H, –1′HA or –3S]. Partner bases not included in the λ stack and an additional A-form base pair above and below have been included to provide context. These are shown in stick mode. The models are aligned by the levels described in Figure 1 and labeled on the right. The backbone is indicated using P-C4′ pseudobonds. The base carbon colors match the backbone, which is specific to each viroid. Glycosidic nitrogens are navy blue; all other atoms have CPK coloring in all models.
FIGURE 8.
FIGURE 8.
Interactions of the protonated cytosine in the triplets of HSVd and CbVd mSRD. (Top) Sequence schematics for the mSRDs. (Middle) Side view of the bases of the upper blocks of the mSRD domains. This view is from the back, the H-strand is in front, 5′–3′ is from the upper right to the lower left. The bases in the triplet are in ball and stick representation. Carbons have NDB colors; pseudobonds from C4′ to the glycosidic nitrogen are coral. (Bottom) View of the triplets showing interaction within the triplet and with G[1′H]. Bases of the triplet are ball and stick, the backbone and G[1′H] are wire frame. Potential hydrogen bonds are purple dashed lines. Not all of these will be present simultaneously. Note that because of the extreme buckling of C[0′H] in HSVd, the only hydrogen bonding it can have with C[0S] is a bifurcated interaction of the protonated H3 with N3 and O2 of C[0′H].
FIGURE 9.
FIGURE 9.
Dissection of the role of charged regions of cytosine in the HSVd mSRD. (A) Charge distribution on atoms of cytosine and protonated cytosine used in the AMBER force field for MD. ΔC presents the charge difference of protonated minus neutral cytosine. The color keys for the heat maps for CProps and CProp differences are presented as well as the secondary structure schematic for the HSVd mSRD. (B) Heat maps of the CProps for the HSVd mSRD with protonated cytosine from the 500 nsec run (Fig. 5) prior to clustering (lower left) and the 200-nsec control for this experiment (upper right). (C–F, upper right) Heat maps for CProps for the mSRD for various sets of charges. (Bottom left) The difference map in which the CProps 200-nsec run from the standard protonated cytosine (panel B, upper right) were subtracted from the values above the diagonal. (C) CProps for the mSRD with no cytosine protonated. (D) For this run, the charges of the glycosidic nitrogen (N1) and C2–O2 ketone were set to those of unprotonated cytosine. All other atoms had the charges for protonated cytosine. This produces a base with a fractional charge that is not compensated elsewhere. (E) The charge on N3 was that for unprotonated cytosine; H3 has 0 charge. (F) The charges on C4 and its amino group were set to unprotonated cytosine.

Similar articles

Cited by

References

    1. Baumstark T, Schroder AR, Riesner D. 1997. Viroid processing: switch from cleavage to ligation is driven by a change from a tetraloop to a loop E conformation. EMBO J 16: 599–610. 10.1093/emboj/16.3.599 - DOI - PMC - PubMed
    1. Branch AD, Benenfeld BJ, Robertson HD. 1985. Ultraviolet light-induced crosslinking reveals a unique region of local tertiary structure in potato spindle tuber viroid and HeLa 5S RNA. Proc Natl Acad Sci 82: 6590–6594. 10.1073/pnas.82.19.6590 - DOI - PMC - PubMed
    1. Calladine C, Drew H, Luisi B, Travers A. 2004. Understanding DNA, 3rd ed Academic Press, MA.
    1. Case DA, Cheatham TE 3rd, Darden T, Gohlke H, Luo R, Merz KM Jr, Onufriev A, Simmerling C, Wang B, Woods RJ. 2005. The Amber biomolecular simulation programs. J Comput Chem 26: 1668–1688. 10.1002/jcc.20290 - DOI - PMC - PubMed
    1. Case DA, Babin V, Berryman JT, Betz RM, Cai Q, Cerutti DS, Cheatham TE III, Darden TA, Duke RE, Gohlke H, et al. 2014. AMBER 14. University of California, San Francisco: http://ambermd.org/Manuals.php

Publication types

LinkOut - more resources