. 2019 Jun;29(6):978-987.
doi: 10.1101/gr.247353.118. Epub 2019 May 23.

One minute analysis of 200 histone posttranslational modifications by direct injection mass spectrometry

Affiliations

One minute analysis of 200 histone posttranslational modifications by direct injection mass spectrometry

Simone Sidoli et al. Genome Res. 2019 Jun.

Abstract

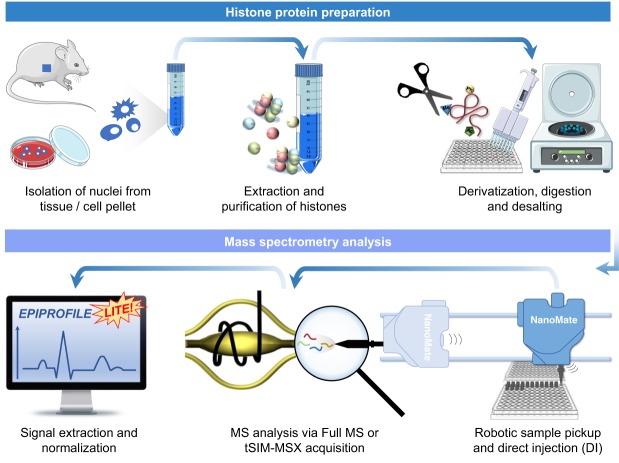
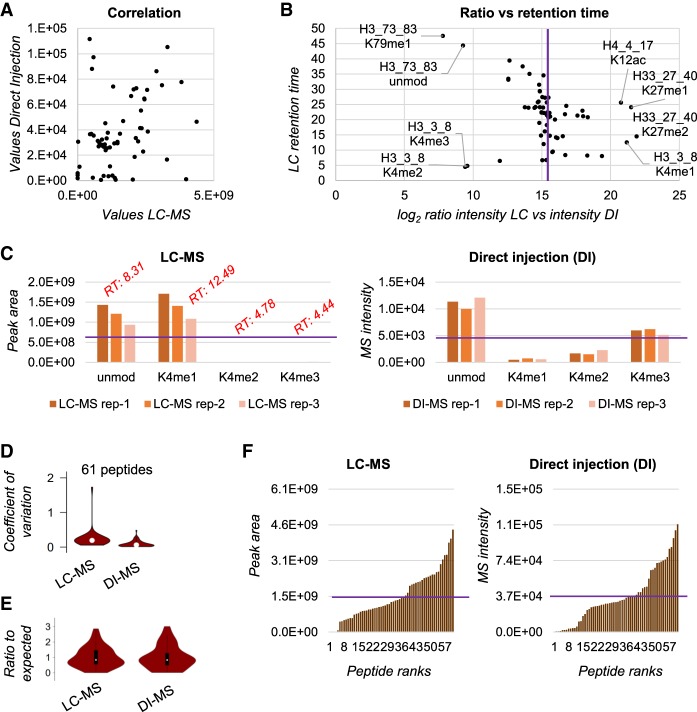
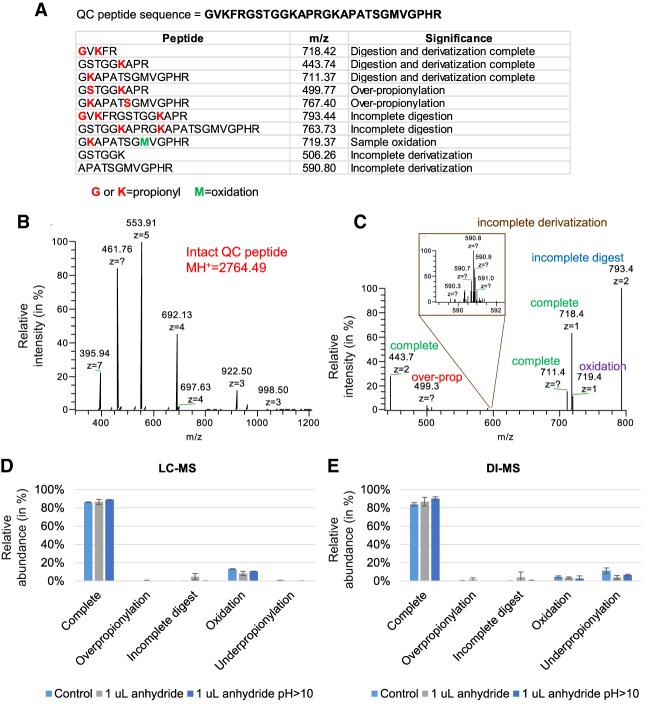
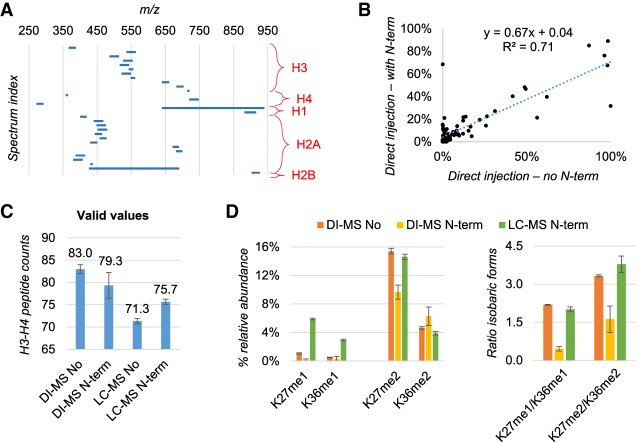
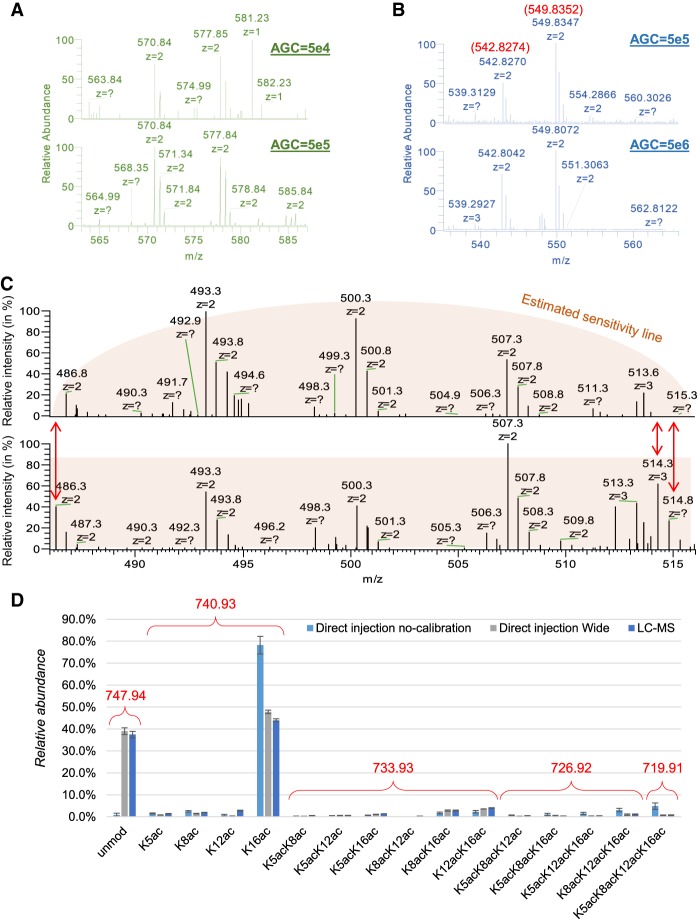
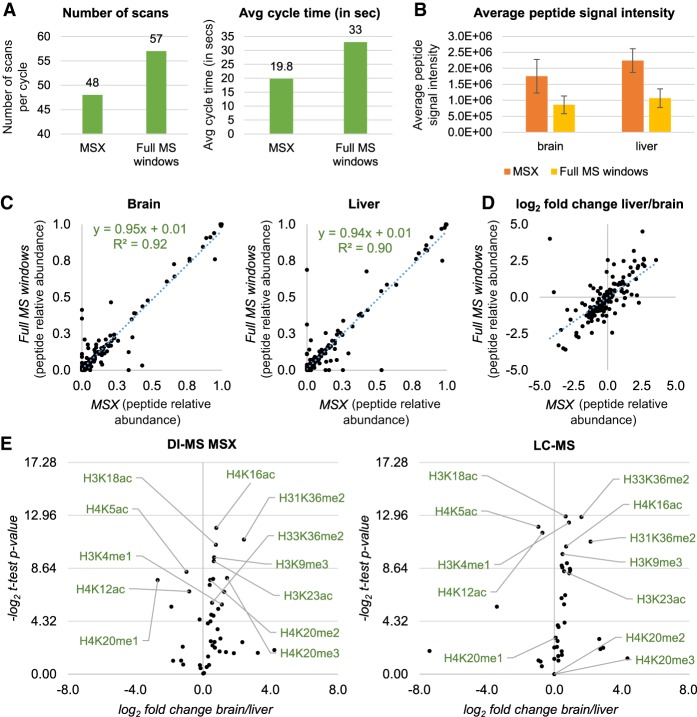
DNA and histone proteins define the structure and composition of chromatin. Histone posttranslational modifications (PTMs) are covalent chemical groups capable of modeling chromatin accessibility, mostly due to their ability in recruiting enzymes responsible for DNA readout and remodeling. Mass spectrometry (MS)-based proteomics is the methodology of choice for large-scale identification and quantification of protein PTMs, including histones. High sensitivity proteomics requires online MS coupling with relatively low throughput and poorly robust nano-liquid chromatography (nanoLC) and, for histone proteins, a 2-d sample preparation that includes histone purification, derivatization, and digestion. We present a new protocol that achieves quantitative data on about 200 histone PTMs from tissue or cell lines in 7 h from start to finish. This protocol includes 4 h of histone extraction, 3 h of derivatization and digestion, and only 1 min of MS analysis via direct injection (DI-MS). We demonstrate that this sample preparation can be parallelized for 384 samples by using multichannel pipettes and 96-well plates. We also engineered the sequence of a synthetic "histone-like" peptide to spike into the sample, of which derivatization and digestion benchmarks the quality of the sample preparation. We ensure that DI-MS does not introduce biases in histone peptide ionization as compared to nanoLC-MS/MS by producing and analyzing a library of synthetically modified histone peptides mixed in equal molarity. Finally, we introduce EpiProfileLite for comprehensive analysis of this new data type. Altogether, our workflow is suitable for high-throughput screening of >1000 samples per day using a single mass spectrometer.


Figures

Figure 1.
Figure 1.
General workflow of histone analysis using DI-MS.
Figure 2.
Figure 2.
Detection bias evaluation using a synthetic peptide library. (A) Correlation of the area under the curve extracted for the synthetic peptides by LC-MS (x-axis) and the intensity in the spectrum of the peptides detected by DI-MS (y-axis). The figure is obtained with the average of three technical replicates. (B) Ratio between the area under the curve of the synthetic peptides quantified via LC-MS versus the intensity obtained by DI-MS (x-axis). The y-axis represents the retention time obtained by the LC-MS run. The purple line indicates the expected ratio in case of no bias. (C) Raw abundance of the histone H3 peptide TKQTAR (aa 3–8) obtained by LC-MS (left) and DI-MS (right) for three technical replicates. The purple line represents the theoretical abundance with no bias; the red text indicates the retention time of the LC-MS peaks. (D) Distribution of the coefficient of variation (CV) for three technical replicates for all the 61 synthetic peptides by LC-MS and DI-MS. (E) Ratio between observed abundance and expected abundance for the synthetic peptides. The expected abundance is calculated by averaging all signals as, in theory, they should all provide the same intensity. (F) Distribution of the peptide observed abundance for all 61 peptides by LC-MS (left) and DI-MS (right). Purple line indicates expected intensity.
Figure 3.
Figure 3.
Analysis of the QC peptide. (A) Sequence of the QC peptide (top) and theoretical masses of the products of derivatization and digestion. The indicated m/z was the most intense charge state determined by manual observation of the spectra. (B) Full MS spectrum of the peptide underivatized and undigested. (C) Example of signals detectable after derivatization and digestion. The spectrum was acquired after 5 min digestion (to detect evidence of undigested forms) using a targeted-SIM multiplexed (MSX) scan. (D) Comparison of three sample preparation protocols using the QC peptide detected by LC-MS and (E) DI-MS. Control is defined as 2 h digestion at pH 8 using 5 µL of propionic anhydride; the second protocol used only 1 µL of propionic anhydride, and the third used an excess of ammonium hydroxide to bring the pH > 10. The QC peptide was prepared in a background of endogenous histones purified from mouse stem cells. The error bar represents the standard deviation of three biological replicates.
Figure 4.
Figure 4.
Evaluation of detection biases by skipping peptide N-terminal derivatization. (A) Overview of the full MS acquisition windows set up for the DI-MS method. The MS/MS scans of the isobaric forms are not displayed. (B) Relative abundance of endogenous peptides extracted from human HEK293T cells quantified by DI-MS after excluding (x-axis) or including (y-axis) N-terminal peptide derivatization in the protocol. Data are the average of three biological replicates. (C) Number of peptides quantified from histone H3 and H4 with or without N-termini derivatization by DI-Ms and LC-MS. As expected, without N-termini derivatization LC-MS has more issues in binding and resolving histone peptides. (D) Example of isobaric peptides with relative ratio estimated by MS/MS in DI-MS acquisition. The example was selected specifically because these peptides are baseline resolved by LC-MS, which was used as a reference. The ratio was wrongly estimated by DI-MS when using N-terminal derivatization (right).
Figure 5.
Figure 5.
Optimization of the AGC target and acquisition window for DI-MS. (A) Example displaying how an acquisition using 50,000 ions as AGC is less indicated than 500,000 ions to obtain a clear S/N ratio for the two peptides of histone H3 KQLATKAAR (aa 18–26) unmodified (577.85 m/z) and with one acetyl (570.84 m/z). This sample was derivatized at the peptide N-termini. (B) Example showing that 5,000,000 as AGC target creates issues of mass accuracy as compared to 500,000. The peptides are the same as panel A, but they were not derivatized at the N-termini in this experiment. (C) Example of incorrect (top) and correct (bottom) calibration of the quadrupole wide isolation in an Orbitrap Fusion. The signals at the edges of the acquisition window are lost, creating significant biases in the estimation of peptide abundance. (D) Relative abundance of the peptide of histone H4 GKGGKGLGKGGAKR (aa 4–17) detected using uncalibrated quadrupole wide isolation using DI-MS with narrow acquisition, with an extra 2 m/z acquisition on both ends of the acquisition window and by canonical LC-MS. It is evident that, even without calibration, the acquisition is correctly performed using wide windows and that all isobaric forms of this peptide (which contains four modifiable residues) were resolved.
Figure 6.
Figure 6.
Multiplexed SIM acquisition of endogenous histone peptides. (A) Number of scan events per cycle (left) and average time (right) during DI-MS acquisition using tSIM-MSX versus the canonical DI-MS with windows described in Figure 4A. The instrument allows multiplexing up to 10 ions per scan, so the number of scans can be reduced. (B) Average peptide intensity obtained by running a side-by-side acquisition of endogenous histone peptides extracted from mouse brain and liver using DI-MS and the two different acquisition methods. (C) Relative abundance of histone peptides from brain (left) and liver (right) acquired using MSX (x-axis) or full MS windows (y-axis). (D) Log2 fold change of the histone peptides from the two data sets acquired using MSX (x-axis) or full MS windows (y-axis). (E) Volcano plot showing the total relative abundance of single histone modifications from histone H3 and H4 (estimated by summing the relative abundance of all peptides carrying a given modification) in brain versus liver. Data were acquired using DI-MS with MSX (left) and LC-MS (right). Results show the same PTMs as statistically different in abundance between the two tissues, with the exception of H4K20me2 and H4K20me3, due to inaccurate quantification by LC-MS.

References

    1. Aebersold R, Mann M. 2016. Mass-spectrometric exploration of proteome structure and function. Nature 537: 347–355. 10.1038/nature19949 - DOI - PubMed
    1. Bannister AJ, Kouzarides T. 2011. Regulation of chromatin by histone modifications. Cell Res 21: 381–395. 10.1038/cr.2011.22 - DOI - PMC - PubMed
    1. Beck M, Schmidt A, Malmstroem J, Claassen M, Ori A, Szymborska A, Herzog F, Rinner O, Ellenberg J, Aebersold R. 2011. The quantitative proteome of a human cell line. Mol Syst Biol 7: 549 10.1038/msb.2011.82 - DOI - PMC - PubMed
    1. Behjati S, Tarpey PS, Presneau N, Scheipl S, Pillay N, Van Loo P, Wedge DC, Cooke SL, Gundem G, Davies H, et al. 2013. Distinct H3F3A and H3F3B driver mutations define chondroblastoma and giant cell tumor of bone. Nat Genet 45: 1479–1482. 10.1038/ng.2814 - DOI - PMC - PubMed
    1. Berson A, Nativio R, Berger SL, Bonini NM. 2018. Epigenetic regulation in neurodegenerative diseases. Trends Neurosci 41: 587–598. 10.1016/j.tins.2018.05.005 - DOI - PMC - PubMed

Publication types