. 2019 Jul 15;79(14):3636-3650.
doi: 10.1158/0008-5472.CAN-18-2931. Epub 2019 May 23.

Asporin Restricts Mesenchymal Stromal Cell Differentiation, Alters the Tumor Microenvironment, and Drives Metastatic Progression

Affiliations

Asporin Restricts Mesenchymal Stromal Cell Differentiation, Alters the Tumor Microenvironment, and Drives Metastatic Progression

Robert M Hughes et al. Cancer Res. .

Abstract

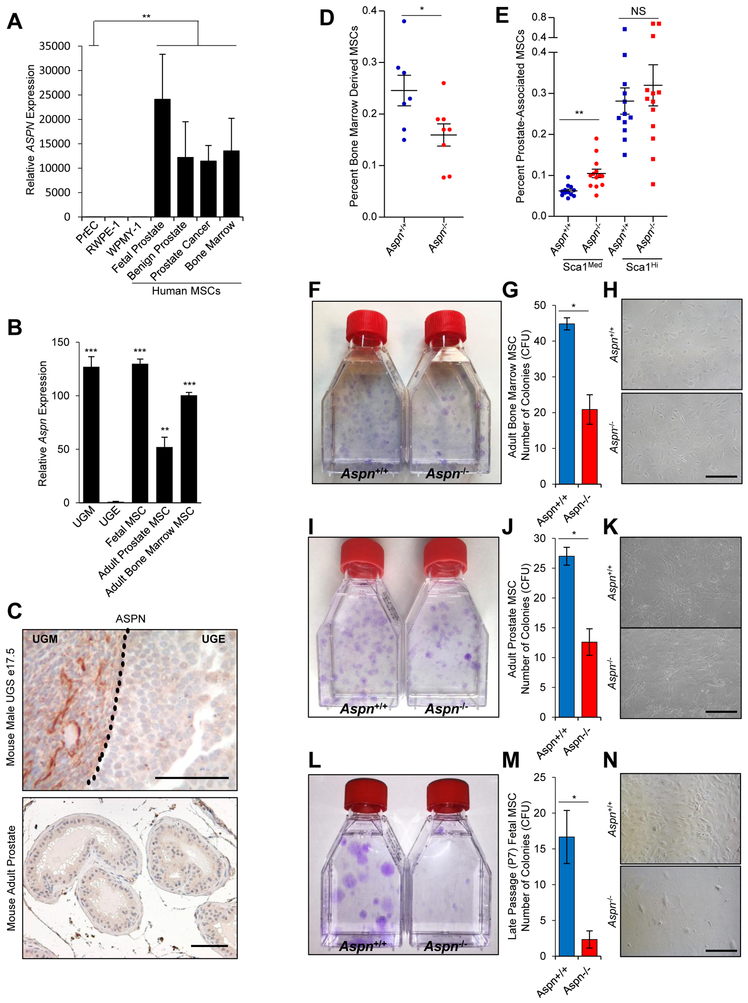
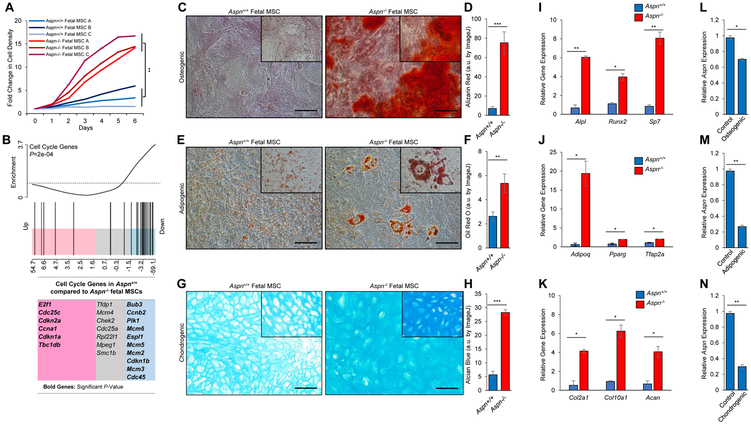
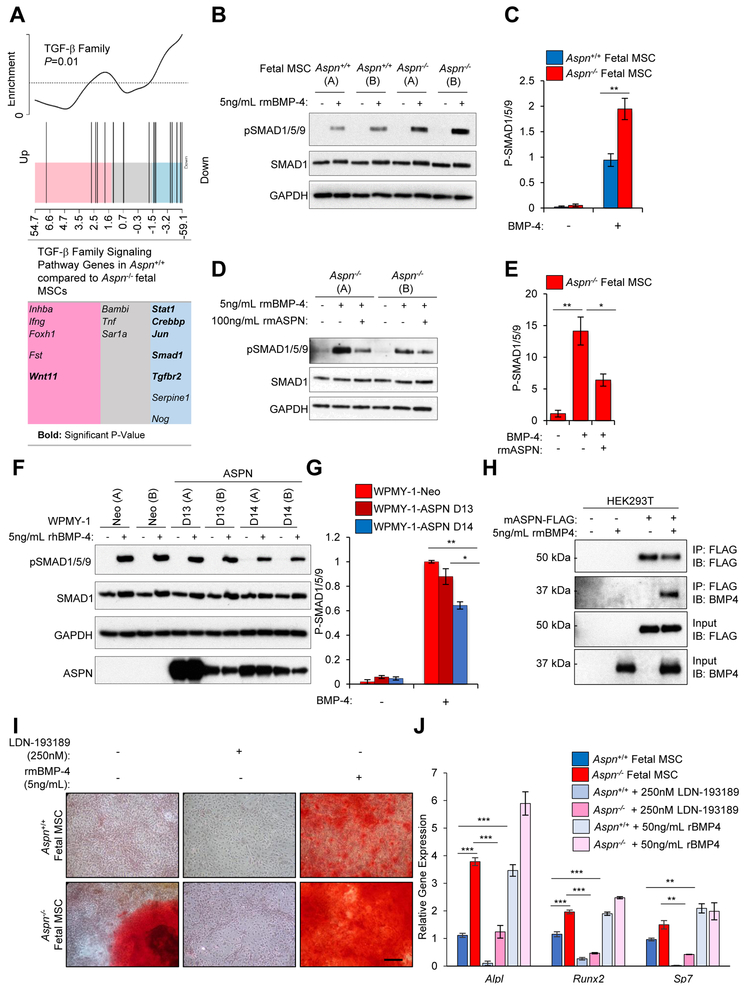
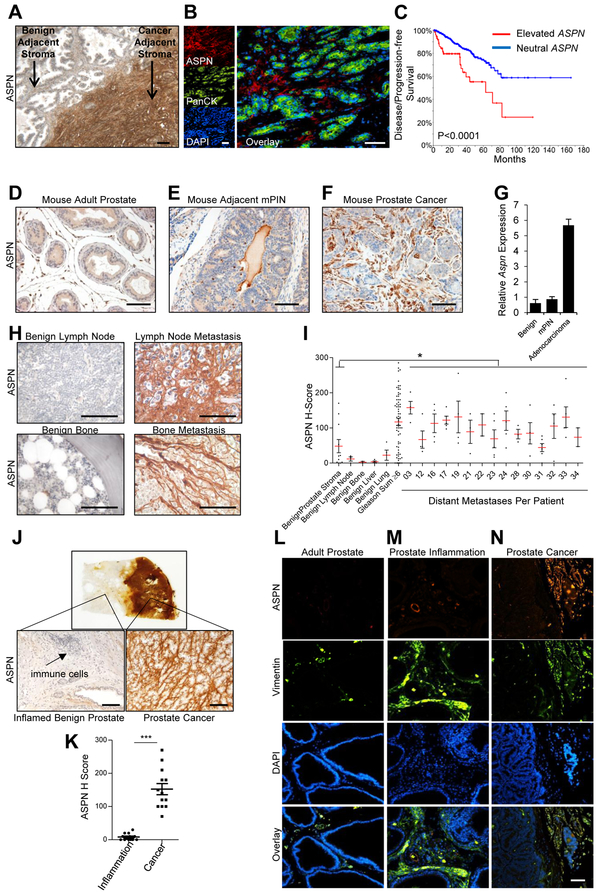
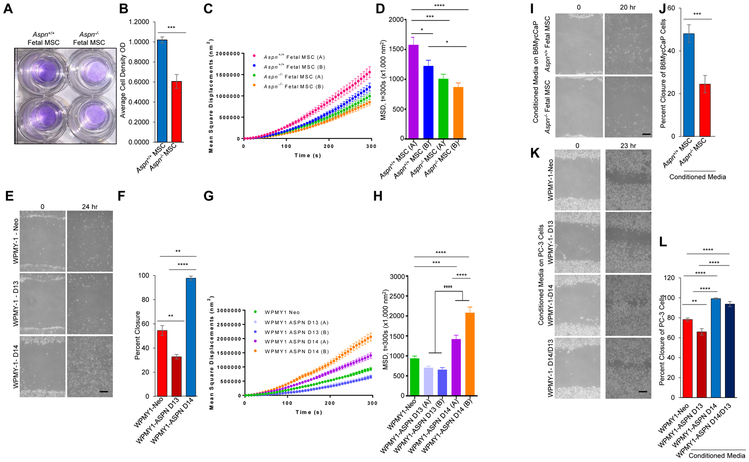
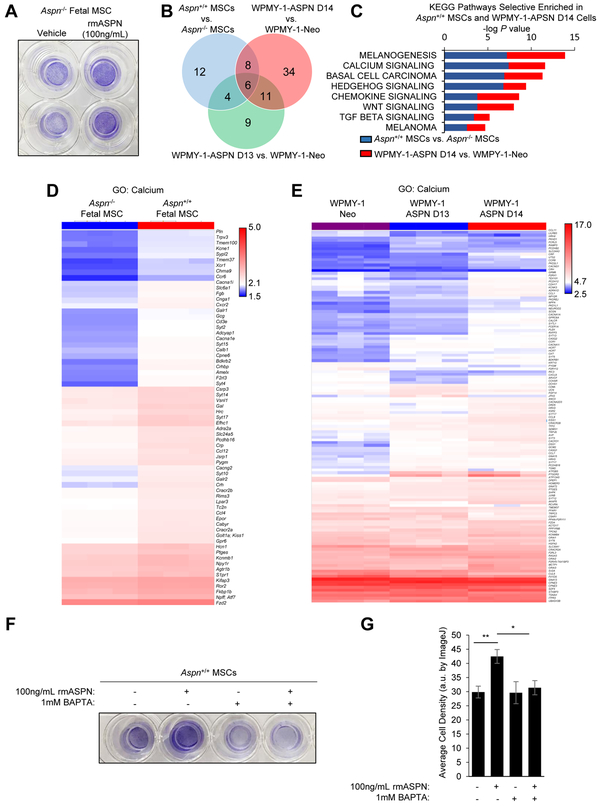
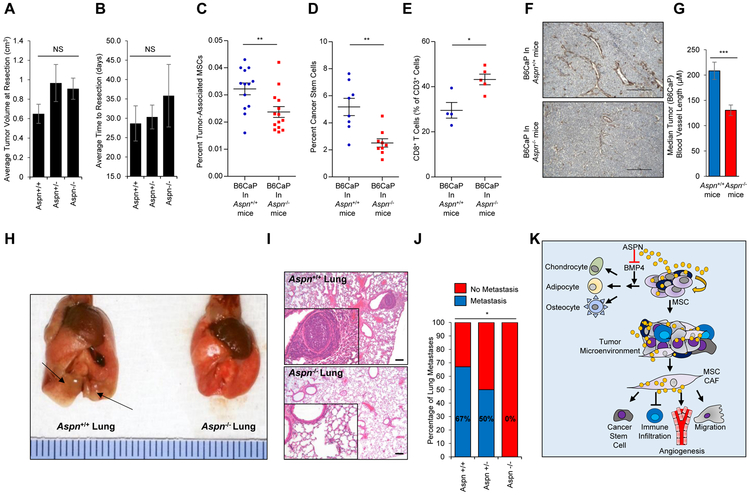
Tumor progression to metastasis is not cancer cell autonomous, but rather involves the interplay of multiple cell types within the tumor microenvironment. Here we identify asporin (ASPN) as a novel, secreted mesenchymal stromal cell (MSC) factor in the tumor microenvironment that regulates metastatic development. MSCs expressed high levels of ASPN, which decreased following lineage differentiation. ASPN loss impaired MSC self-renewal and promoted terminal cell differentiation. Mechanistically, secreted ASPN bound to BMP-4 and restricted BMP-4-induced MSC differentiation prior to lineage commitment. ASPN expression was distinctly conserved between MSC and cancer-associated fibroblasts (CAF). ASPN expression in the tumor microenvironment broadly impacted multiple cell types. Prostate tumor allografts in ASPN-null mice had a reduced number of tumor-associated MSCs, fewer cancer stem cells, decreased tumor vasculature, and an increased percentage of infiltrating CD8+ T cells. ASPN-null mice also demonstrated a significant reduction in lung metastases compared with wild-type mice. These data establish a role for ASPN as a critical MSC factor that extensively affects the tumor microenvironment and induces metastatic progression. SIGNIFICANCE: These findings show that asporin regulates key properties of mesenchymal stromal cells, including self-renewal and multipotency, and asporin expression by reactive stromal cells alters the tumor microenvironment and promotes metastatic progression.


Conflict of interest statement

Disclosure of Potential Conflicts of Interest

Elai Davicioni is the President and CSO, Director of GenomeDx. Ben H. Park is a consultant for Foundation Medicine, Roche, H3 Biomedicine, Casdin Capital, Loxo Oncology, and Lilly, all outside the submitted work. No potential conflicts of interest were disclosed by the other authors.

Figures

Figure 1.
Figure 1.
ASPN is expressed in MSCs and regulates MSC self-renewal. A, Relative ASPN expression in human primary prostate epithelial cells (PrEC), a benign human prostate epithelial cell line (RWPE-1), a human prostate stromal cell line (WPMY-1), and primary human MSCs as measured by qRT-PCR. Statistical analyses performed using Welch’s t-test (n≥3). B, Relative Aspn expression in mouse fetal prostate mesenchyme (UGM), mouse fetal prostate epithelium (UGE), and mouse MSCs as measured by qRT-PCR. Statistical analyses performed using one-way ANOVA with Tukey multiple comparison (n≥3). C, ASPN expression as measured by IHC in the urogenital sinus (UGS) and in adult mouse prostate. D, E, Aspn+/+ and Aspn−/− (D) bone marrow and (E) prostates were analyzed by flow cytometry for MSCs (CD45, CD105+, CD29+, and Sca-1+). Statistical analyses performed using Student’s t-test (n≥7). F-H, Aspn+/+ and Aspn−/− adult bone marrow-derived MSCs were isolated and then plated at equal densities for CFU assays. Displayed are the average number of colonies formed per 2.5×10³ cells plated. Statistical analyses performed using Student’s t-test (n≥6). I-K, Aspn+/+ and Aspn−/− adult prostate MSCs were isolated and then plated at equal densities for CFU assays. Statistical analyses performed using Student’s t-test (n≥3). L-N, Aspn+/+ and Aspn−/− fetal MSCs were isolated and then plated at equal densities for CFU assays. Statistical analyses performed using Student’s t-test (n≥3). Graphs shown as mean±SEM, *P≤0.05, **P≤0.01, ***P≤0.001, NS=not significant, and black bars=100μM.
Figure 2.
Figure 2.
ASPN restricts MSC proliferation and differentiation. A, Cell growth of Aspn+/+ and Aspn−/− fetal MSCs. B, Gene set enrichment analysis (GSEA) of cell cycle genes in Aspn+/+ and Aspn−/− fetal MSCs as determined from microarray data (n=3). C-H, Aspn+/+ and Aspn−/− fetal MSCs were cultured in (C, D) osteogenic, (E, F) adipogenic, and (G, H) chondrogenic differentiation-inducing media and then stained for Alizarin Red, Oil Red O, and Alcian Blue, respectively. Staining was quantified using ImageJ (n=3). I-K, Expression of (I) osteogenic, (J) adipogenic, and (K) chondrogenic differentiation-induced genes in Aspn+/+ and Aspn−/− fetal MSCs as determined by qRT-PCR (n≥3). L-N, Aspn expression in Aspn+/+ fetal MSCs cultured in (L) osteogenic, (M) adipogenic, and (N) chondrogenic differentiation-inducing media (n=3). Statistical analyses in A and C-N performed using Student’s t-test (mean±SEM; *P≤0.05, **P≤0.01, ***P≤0.001; n≥3). Black bars=100μM.
Figure 3.
Figure 3.
ASPN binds to BMP-4 and restricts BMP-4-induced signaling. A, GSEA of TGF-β family pathway genes in Aspn+/+ and Aspn−/− fetal MSCs as determined from microarray (n=3). B, C, BMP-4-induced signaling in Aspn+/+ and Aspn−/− fetal MSCs (A and B represent independently derived MSCs) as measured by immunoblotting and quantified using ImageJ. Aspn+/+ and Aspn−/− fetal MSCs were serum-depleted and then incubated with recombinant mouse BMP-4 (5ng/mL) for 30 minutes. Statistical analyses performed using Student’s t-test (n≥3). D, E, Recombinant mouse ASPN restricts BMP-4-induced signaling in Aspn−/− fetal MSCs as measured by immunoblotting and quantified using ImageJ. Aspn+/+ and Aspn−/− fetal MSCs were serum-depleted and then incubated with recombinant mouse BMP-4 (5ng/mL) with vehicle or recombinant mouse ASPN (100ng/mL) for 30 minutes. Statistical analyses performed using Student’s t-test (n≥2). F, G, BMP-4-induced signaling in WPMY-1-Neo, WPMY-1-ASPN D13, and WPMY-1ASPN D14 (A and B represent independently derived clones) as measured by immunoblotting and quantified using ImageJ. WPMY-1-Neo, WPMY-1-ASPN D13, and WPMY-1ASPN D14 were serum-depleted and then incubated with recombinant human BMP-4 (5ng/mL) for 30 minutes. Statistical analyses performed using one-way ANOVA with Tukey multiple comparison (n≥3). H, Co-immunoprecipitation of ASPN and BMP-4. FLAG tagged mouse ASPN was transfected in HEK293T cells and then incubated with recombinant mouse BMP-4. ASPN was immunoprecipitated with anti-FLAG beads and then examined by immunoblotting for ASPN and BMP-4 (n=2). I, Aspn+/+ and Aspn−/− fetal MSCs were cultured in osteogenic-inducing media with either vehicle, 250nM LDN-193189, or recombinant mouse BMP4 (5ng/mL) and then stained for Alizarin Red. J, Aspn+/+ and Aspn−/− fetal MSCs were cultured in osteogenic-inducing media with either vehicle, 250nM LDN-193189, or recombinant mouse BMP4 (5ng/mL) and then examined for osteogenic-induced genes by qRT-PCR. Statistical analyses performed using one-way ANOVA with Tukey multiple comparison (n≥3). Graphs shown as mean±SEM, *P≤0.05, **P≤0.01, ***P≤0.001, and black bars=100μM.
Figure 4.
Figure 4.
ASPN is expressed in primary and metastatic prostate cancer tumor microenvironments, but not in the microenvironment of prostate inflammation. A, ASPN expression in human prostate cancer as measured by IHC. B, ASPN (red), pancytokeratin (green), and DAPI (blue) expression in human prostate cancer as measured by immunofluorescence (IF). C, Elevated ASPN (amplification, gain, expression>2) was associated with worse disease/progression-free survival in TCGA data as determined by Kaplan-Meier survival curves and visualized on cBioPortal (n=491; Logrank Test). D-F, ASPN expression in (D) mouse adult prostate, (E) murine prostatic intraepithelial neoplasia (mPIN) in the TRAMP model, and (F) mouse prostate adenocarcinoma in the TRAMP model as measured by IHC and (G) qRT-PCR. H, I, Mean ASPN H-score in prostate cancer metastases from the PELICAN rapid autopsy study of prostate cancer (n=15 patients with an average of 4 metastases per patient), benign adjacent prostate stroma (n=11), benign bone (n=2), benign lymph node (n=3), benign lung (n=4), and benign liver (n=4) as measured by IHC. Historical controls of stroma adjacent to benign prostate and stroma adjacent to Gleason grade ≥6 prostate cancer (G≥6) were measured and calculated using the same methodology and included for comparison. Statistical analyses performed using one-way ANOVA with Newman-Keuls multiple comparison. J, ASPN expression in human prostate inflammation and human prostate cancer as measured by IHC on radical prostatectomy sections that contained regions of both chronic inflammation and prostate cancer in non-overlapping locations. K, Quantification of ASPN expression by IHC (H-score) in stroma adjacent to inflammation and stroma adjacent to cancer on single sections from radical prostatectomy sections. Statistical analyses performed using Student’s t-test (n=13 patients). L-N, ASPN (red), Vimentin (green), and DAPI (blue) expression in mouse adult prostate (L), CP1 E. coli-induced mouse prostate inflammation (M), and mouse prostate adenocarcinoma in the TRAMP model (N) as measured by IF. Graphs shown as mean±SEM, *P≤0.05, **P≤0.01, ***P≤0.001, and black and white bars=100μM.
Figure 5.
Figure 5.
ASPN enhances MSC and cancer cell migration. A, B, Migration of Aspn+/+ and Aspn−/− fetal MSCs across a membrane. Statistical analyses performed using Student’s t-test (n=3). C, D, Cytoskeletal remodeling as measured by (C) mean square displacement and (D) analyzed at t=300s nm2 in Aspn+/+ and Aspn−/− fetal MSCs. Statistical analyses performed using one-way ANOVA with Tukey multiple comparison (n≥3). E, F, Migration of WPMY-1-Neo, WPMY-1-ASPN D13, and WPMY-1-ASPN D14 as determined by scratch assay. Statistical analyses performed using one-way ANOVA with Tukey multiple comparison (n≥9). G, H, Cytoskeletal remodeling as measured by (G) mean square displacement and (H) analyzed at t=300 nm2 in WPMY-1-Neo, WPMY-1-ASPN D13, and WPMY-1-ASPN D14 (n=2 independent clones per experimental group). Statistical analyses performed using one-way ANOVA with Tukey multiple comparison (n≥3). I, J, Migration of B6MycCaP cells in conditioned media from Aspn+/+ and Aspn−/− fetal MSCs as determined by scratch assay. Statistical analyses performed using Student’s t-test (n=3). K, L, Migration of PC-3 cells in conditioned media from WPMY-1-Neo, WPMY-1-ASPN D13, WPMY-1-ASPN D14, and a 1:1 mix from WPMY-1-ASPN D13:WPMY-1-ASPN D14 cells. Statistical analyses performed using one-way ANOVA with Tukey multiple comparison (n≥9). Graphs shown as mean±SEM, *P≤0.05, **P≤0.01, ***P≤0.001, and black bars=100μM.
Figure 6.
Figure 6.
ASPN-mediated migration is calcium-dependent. A, Migration of Aspn−/− cells in low calcium media with vehicle or 100ng/mL recombinant mouse ASPN as determined by transwell assay. B, Venn Diagram of altered KEGG Pathways between differentially expressed genes in Aspn+/+ MSCs compared to Aspn−/− MSCs as well as in WPMY-1-ASPN D14 compared to WPMY-1-ASPN Neo and in WPMY-1-ASPN D13 compared to WPMY-1-ASPN Neo. C, KEGG Pathway enrichment selective to Aspn+/+ MSCs and WPMY-1-ASPN D14 cells compared to cells deficient for ASPN. D, Hierarchical clustering of GO calcium-related genes in Aspn+/+ and Aspn−/− fetal MSCs. E, Hierarchical clustering of GO calcium-related genes in WPMY-1-ASPN D14, WPMY-1-ASPN Neo, and WPMY-1-ASPN D13 cells. F,G, Migration of Aspn−/− cells in low calcium media with vehicle, 100ng/mL recombinant mouse ASPN, 1mM BAPTA, or ASPN and BAPTA as determined by transwell assay. Quantification by ImageJ. Statistical analyses performed using one-way ANOVA with Newman-Keuls multiple comparison (mean±SEM; * P≤0.05, **P≤0.01; n≥3).
Figure 7.
Figure 7.
ASPN regulates the tumor microenvironment and promotes metastatic development. A, B, Tumor volume (A) and time to resection (B) of B6CaP subcutaneous allografts in Aspn+/+ (n=6), Aspn+/− (n=6), and Aspn−/− (n=6) mice. Statistical analyses performed using one-way ANOVA with Tukey multiple comparison. C, Percent tumor-associated MSCs (CD45, CD105+, CD29+, and Sca-1+) in B6CaP subcutaneous allografts from Aspn+/+ and Aspn−/− mice as measured by flow cytometry. Statistical analyses performed using Student’s t-test (n≥13). D, Percent cancer stem cells (CD45, CD105, CD31, CD29+, Sca-1+, CD44+) in B6CaP subcutaneous allografts from Aspn+/+ and Aspn−/− mice as measured by flow cytometry. Statistical analyses performed using Student’s t-test (n≥8). E, CD8+ T cells as a percent of CD3+ cells in B6CaP subcutaneous allografts from Aspn+/+ and Aspn−/− mice as measured by flow cytometry. Statistical analyses performed using Student’s t-test (n≥4). F, SMAα positive vasculature detected by IHC of B6CaP subcutaneous allografts from Aspn+/+ and Aspn−/− mice. G, Quantification of vasculature length in B6CaP subcutaneous allografts from Aspn+/+ and Aspn−/− mice. Statistical analyses performed using Student’s t-test (n≥4). H, I, Photograph (H) and H&E (I) of lungs from Aspn+/+ and Aspn−/− mice with B6CaP allograft. J, Percentage of Aspn+/+ (4/6), Aspn+/− (3/6), and Aspn−/− (0/6) mice with lung metastases from B6CaP subcutaneous allografts as determined by H&E. Statistical analyses performed using Chi-squared test. K, Schematic of the role of ASPN in MSCs and metastasis. Graphs shown as mean±SEM, *P≤0.05, **P≤0.01, ***P≤0.001, NS=not significant, and black bars=100μM.

Similar articles

Cited by

References

    1. Hanahan D, Weinberg RA. Hallmarks of cancer: the next generation. Cell. 2011;144:646–74. - PubMed
    1. Kalluri R The biology and function of fibroblasts in cancer. Nature reviews Cancer. 2016;16:582–98. - PubMed
    1. LeBleu VS, Kalluri R. A peek into cancer-associated fibroblasts: origins, functions and translational impact. Dis Model Mech. 2018;11. - PMC - PubMed
    1. Ridge SM, Sullivan FJ, Glynn SA. Mesenchymal stem cells: key players in cancer progression. Mol Cancer. 2017;16:31. - PMC - PubMed
    1. Brennen WN, Zhang B, Kulac I, Kisteman LN, Antony L, Wang H, et al. Mesenchymal stem cell infiltration during neoplastic transformation of the human prostate. Oncotarget. 2017. - PMC - PubMed

Publication types