Expression of a Lychee PHOSPHATIDYLCHOLINE:DIACYLGLYCEROL CHOLINEPHOSPHOTRANSFERASE with an Escherichia coli CYCLOPROPANE SYNTHASE Enhances Cyclopropane Fatty Acid Accumulation in Camelina Seeds
- PMID: 31123096
- PMCID: PMC6752900
- DOI: 10.1104/pp.19.00396
Expression of a Lychee PHOSPHATIDYLCHOLINE:DIACYLGLYCEROL CHOLINEPHOSPHOTRANSFERASE with an Escherichia coli CYCLOPROPANE SYNTHASE Enhances Cyclopropane Fatty Acid Accumulation in Camelina Seeds
Abstract
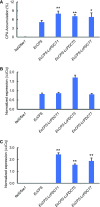
Cyclopropane fatty acids (CPAs) are useful feedstocks for biofuels and bioproducts such as lubricants and biodiesel. Our goal is to identify factors that can facilitate the accumulation of CPA in seed triacylglycerol (TAG) storage oil. We hypothesized that the poor metabolism of CPA through the TAG biosynthetic network could be overcome by the addition of enzymes from species that naturally accumulate CPA in their seed oil, such as lychee (Litchi chinensis), which contains approximately 40% CPA in TAG. Our previous work on engineering CPA accumulation in crop and model plants identified a metabolic bottleneck between phosphatidylcholine (PC), the site of CPA biosynthesis, diacylglycerol (DAG), and TAG. Here, we report the cloning and heterologous expression in camelina (Camelina sativa) of a lychee PHOSPHATIDYLCHOLINE:DIACYLGLYCEROL CHOLINEPHOSPHOTRANSFERASE (PDCT), which encodes the enzyme that catalyzes the transfer of the phosphocholine headgroup from PC to DAG. Camelina lines coexpressing LcPDCT and Escherichia coli CYCLOPROPANE SYNTHASE (EcCPS) showed up to a 50% increase of CPA in mature seed, relative to the EcCPS background. Stereospecific lipid compositional analysis showed that the expression of LcPDCT strongly reduced the level of C18:1 substrate at PC-sn-1 and PC-sn-2 (i.e. the sites of CPA synthesis), while the levels of CPA increased in PC-sn-2, DAG-sn-1 and DAG-sn-2, and both sn-1/3 and sn-2 positions in TAG. Taken together, these data suggest that the addition of PDCT facilitates more efficient movement of CPA from PC to DAG and establishes LcPDCT as a useful factor to combine with others to enhance CPA accumulation in plant seed oil.
© 2019 American Society of Plant Biologists. All Rights Reserved.
Figures


Similar articles
-
Born of frustration: the emergence of Camelina sativa as a platform for lipid biotechnology.Plant Physiol. 2025 Feb 7;197(2):kiaf009. doi: 10.1093/plphys/kiaf009. Plant Physiol. 2025. PMID: 39813144 Free PMC article. Review.
-
Identification of bottlenecks in the accumulation of cyclic fatty acids in camelina seed oil.Plant Biotechnol J. 2018 Apr;16(4):926-938. doi: 10.1111/pbi.12839. Epub 2018 Jan 18. Plant Biotechnol J. 2018. PMID: 28929610 Free PMC article.
-
Coexpressing Escherichia coli cyclopropane synthase with Sterculia foetida Lysophosphatidic acid acyltransferase enhances cyclopropane fatty acid accumulation.Plant Physiol. 2014 Jan;164(1):455-65. doi: 10.1104/pp.113.230953. Epub 2013 Nov 7. Plant Physiol. 2014. PMID: 24204024 Free PMC article.
-
Overexpression of the Phosphatidylcholine:DiacylglycerolCholinephosphotransferase (PDCT) gene increases carbon flux toward triacylglycerol (TAG) synthesis in Camelinasativa seeds.Plant Physiol Biochem. 2024 Mar;208:108470. doi: 10.1016/j.plaphy.2024.108470. Epub 2024 Feb 24. Plant Physiol Biochem. 2024. PMID: 38422576
-
Camelina sativa: An ideal platform for the metabolic engineering and field production of industrial lipids.Biochimie. 2016 Jan;120:9-16. doi: 10.1016/j.biochi.2015.06.009. Epub 2015 Jun 21. Biochimie. 2016. PMID: 26107412 Review.
Cited by
-
Towards rational control of seed oil composition: dissecting cellular organization and flux control of lipid metabolism.Plant Physiol. 2025 Feb 7;197(2):kiae658. doi: 10.1093/plphys/kiae658. Plant Physiol. 2025. PMID: 39657632 Free PMC article. Review.
-
Born of frustration: the emergence of Camelina sativa as a platform for lipid biotechnology.Plant Physiol. 2025 Feb 7;197(2):kiaf009. doi: 10.1093/plphys/kiaf009. Plant Physiol. 2025. PMID: 39813144 Free PMC article. Review.
-
A toolkit for plant lipid engineering: Surveying the efficacies of lipogenic factors for accumulating specialty lipids.Front Plant Sci. 2022 Dec 14;13:1064176. doi: 10.3389/fpls.2022.1064176. eCollection 2022. Front Plant Sci. 2022. PMID: 36589075 Free PMC article.
-
Transcriptome Analysis and Identification of Lipid Genes in Physaria lindheimeri, a Genetic Resource for Hydroxy Fatty Acids in Seed Oil.Int J Mol Sci. 2021 Jan 6;22(2):514. doi: 10.3390/ijms22020514. Int J Mol Sci. 2021. PMID: 33419225 Free PMC article.
-
Metabolic Engineering a Model Oilseed Camelina sativa for the Sustainable Production of High-Value Designed Oils.Front Plant Sci. 2020 Feb 12;11:11. doi: 10.3389/fpls.2020.00011. eCollection 2020. Front Plant Sci. 2020. PMID: 32117362 Free PMC article. Review.
References
-
- Allen DK, Ohlrogge JB, Shachar-Hill Y (2009) The role of light in soybean seed filling metabolism. Plant J 58: 220–234 - PubMed
-
- Badami RC, Patil KB (1980) Structure and occurrence of unusual fatty acids in minor seed oils. Prog Lipid Res 19: 119–153 - PubMed
-
- Bao X, Thelen JJ, Bonaventure G, Ohlrogge JB (2003) Characterization of cyclopropane fatty-acid synthase from Sterculia foetida. J Biol Chem 278: 12846–12853 - PubMed
Publication types
MeSH terms
Substances
LinkOut - more resources
Full Text Sources

