

Cognitive and White-Matter Compartment Models Reveal Selective Relations between Corticospinal Tract Microstructure and Simple Reaction Time
- PMID: 31123103
- PMCID: PMC6650993
- DOI: 10.1523/JNEUROSCI.2954-18.2019
Cognitive and White-Matter Compartment Models Reveal Selective Relations between Corticospinal Tract Microstructure and Simple Reaction Time
Abstract
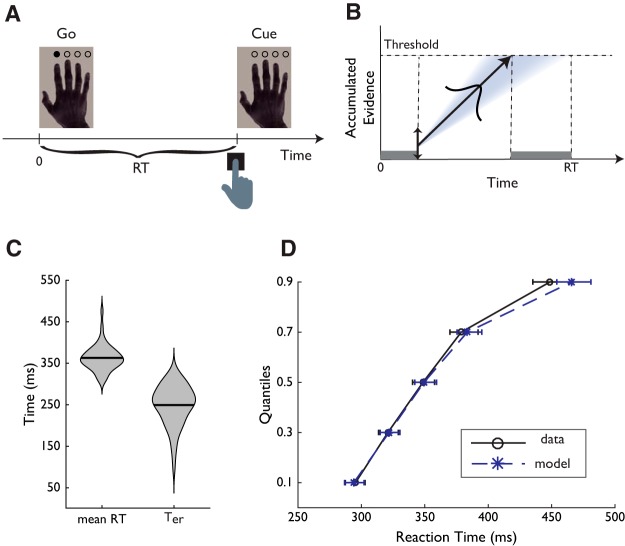
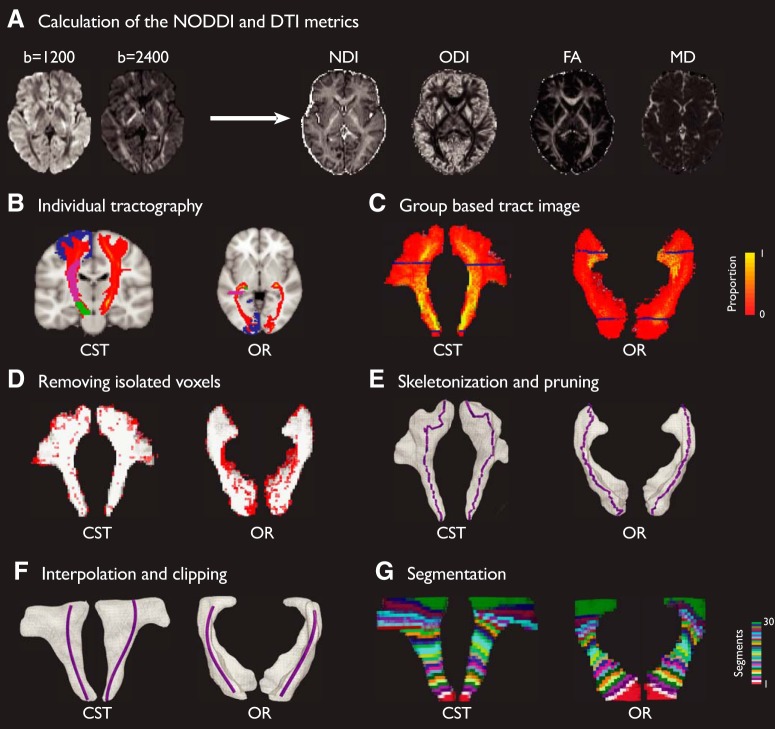
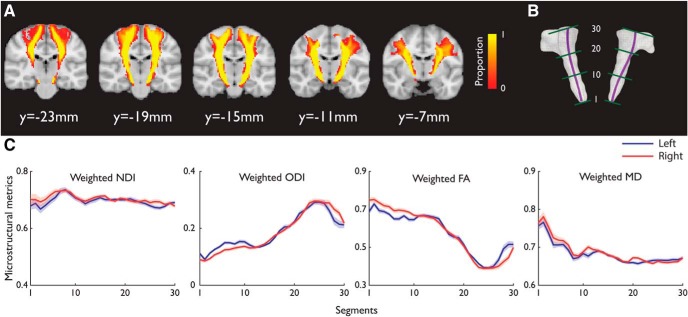
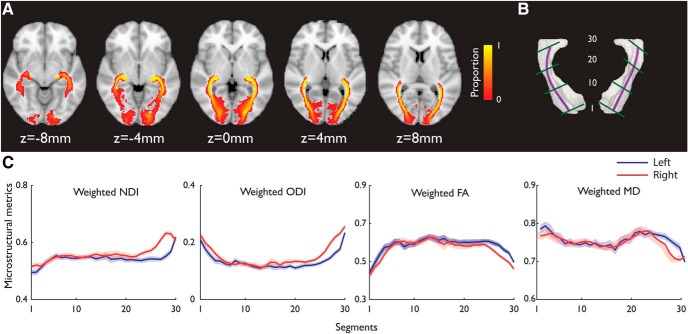
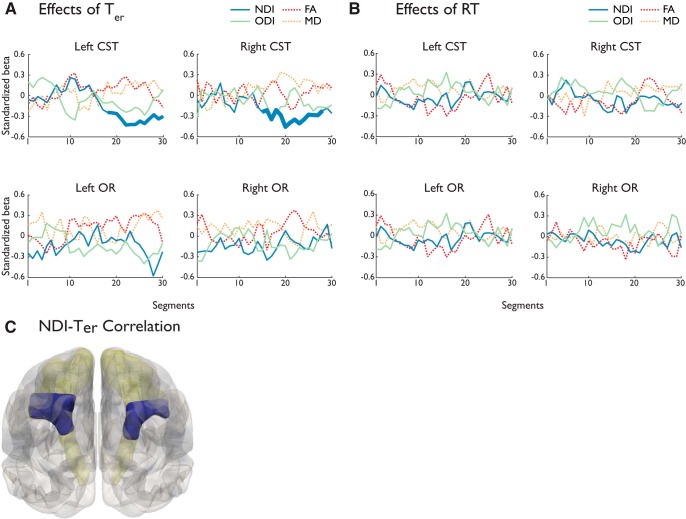
The speed of motor reaction to an external stimulus varies substantially between individuals and is slowed in aging. However, the neuroanatomical origins of interindividual variability in reaction time (RT) remain unclear. Here, we combined a cognitive model of RT and a biophysical compartment model of diffusion-weighted MRI (DWI) to characterize the relationship between RT and microstructure of the corticospinal tract (CST) and the optic radiation (OR), the primary motor output and visual input pathways associated with visual-motor responses. We fitted an accumulator model of RT to 46 female human participants' behavioral performance in a simple reaction time task. The non-decision time parameter (Ter) derived from the model was used to account for the latencies of stimulus encoding and action initiation. From multi-shell DWI data, we quantified tissue microstructure of the CST and OR with the neurite orientation dispersion and density imaging (NODDI) model as well as the conventional diffusion tensor imaging model. Using novel skeletonization and segmentation approaches, we showed that DWI-based microstructure metrics varied substantially along CST and OR. The Ter of individual participants was negatively correlated with the NODDI measure of the neurite density in the bilateral superior CST. Further, we found no significant correlation between the microstructural measures and mean RT. Thus, our findings suggest a link between interindividual differences in sensorimotor speed and selective microstructural properties in white-matter tracts.SIGNIFICANCE STATEMENT How does our brain structure contribute to our speed to react? Here, we provided anatomically specific evidence that interindividual differences in response speed is associated with white-matter microstructure. Using a cognitive model of reaction time (RT), we estimated the non-decision time, as an index of the latencies of stimulus encoding and action initiation, during a simple reaction time task. Using an advanced microstructural model for diffusion MRI, we estimated the tissue properties and their variations along the corticospinal tract and optic radiation. We found significant location-specific correlations between the microstructural measures and the model-derived parameter of non-decision time but not mean RT. These results highlight the neuroanatomical signature of interindividual variability in response speed along the sensorimotor pathways.
Keywords: NODDI; along tract analysis; cognitive model; microstructure; non-decision time; simple reaction time.
Copyright © 2019 Karahan et al.
Figures
Similar articles
-
Neurite orientation dispersion and density imaging quantifies corticospinal tract microstructural organization in children with unilateral cerebral palsy.Hum Brain Mapp. 2019 Dec 1;40(17):4888-4900. doi: 10.1002/hbm.24744. Epub 2019 Jul 29. Hum Brain Mapp. 2019. PMID: 31355991 Free PMC article.
-
White matter microstructural differences identified using multi-shell diffusion imaging in six-year-old children born very preterm.Neuroimage Clin. 2019;23:101855. doi: 10.1016/j.nicl.2019.101855. Epub 2019 May 4. Neuroimage Clin. 2019. PMID: 31103872 Free PMC article.
-
White matter and cortical gray matter microstructural abnormalities in new daily persistent headache: a NODDI study.J Headache Pain. 2024 Jul 8;25(1):110. doi: 10.1186/s10194-024-01815-1. J Headache Pain. 2024. PMID: 38977951 Free PMC article.
-
In Vivo Imaging of Gray Matter Microstructure in Major Psychiatric Disorders: Opportunities for Clinical Translation.Biol Psychiatry Cogn Neurosci Neuroimaging. 2020 Sep;5(9):855-864. doi: 10.1016/j.bpsc.2020.03.003. Epub 2020 Mar 25. Biol Psychiatry Cogn Neurosci Neuroimaging. 2020. PMID: 32381477 Review.
-
A systematic review of microstructural abnormalities in multiple sclerosis detected with NODDI and DTI models of diffusion-weighted magnetic resonance imaging.Magn Reson Imaging. 2023 Dec;104:61-71. doi: 10.1016/j.mri.2023.09.010. Epub 2023 Sep 27. Magn Reson Imaging. 2023. PMID: 37775062
Cited by
-
Structure of the Motor Descending Pathways Correlates with the Temporal Kinematics of Hand Movements.Biology (Basel). 2022 Oct 10;11(10):1482. doi: 10.3390/biology11101482. Biology (Basel). 2022. PMID: 36290386 Free PMC article.
-
Longitudinal assessment of chemotherapy-induced brain connectivity changes in cerebral white matter and its correlation with cognitive functioning using the GQI.Front Neurol. 2024 Feb 7;15:1332984. doi: 10.3389/fneur.2024.1332984. eCollection 2024. Front Neurol. 2024. PMID: 38385045 Free PMC article.
-
The relationship between cognition and white matter tract damage after mild traumatic brain injury in a premorbidly healthy, hospitalised adult cohort during the post-acute period.Front Neurol. 2023 Oct 23;14:1278908. doi: 10.3389/fneur.2023.1278908. eCollection 2023. Front Neurol. 2023. PMID: 37936919 Free PMC article.
-
Computational approaches for the reconstruction of optic nerve fibers along the visual pathway from medical images: a comprehensive review.Front Neurosci. 2023 May 26;17:1191999. doi: 10.3389/fnins.2023.1191999. eCollection 2023. Front Neurosci. 2023. PMID: 37304011 Free PMC article. Review.
-
Characterising and differentiating cognitive and motor speed in older adults: structural equation modelling on a UK longitudinal birth cohort.BMJ Open. 2024 Aug 19;14(8):e083968. doi: 10.1136/bmjopen-2024-083968. BMJ Open. 2024. PMID: 39160108 Free PMC article.
References
-
- Andersen KW, Siebner HR (2018) Mapping dexterity and handedness: recent insights and future challenges. Curr Opin Behav Sci 20:123–129. 10.1016/j.cobeha.2017.12.020 - DOI
Publication types
MeSH terms
Grants and funding
LinkOut - more resources
Full Text Sources