

Evolution Over Time of Volume Status and PD-Related Practice Patterns in an Incident Peritoneal Dialysis Cohort
- PMID: 31123180
- PMCID: PMC6556715
- DOI: 10.2215/CJN.11590918
Evolution Over Time of Volume Status and PD-Related Practice Patterns in an Incident Peritoneal Dialysis Cohort
Abstract
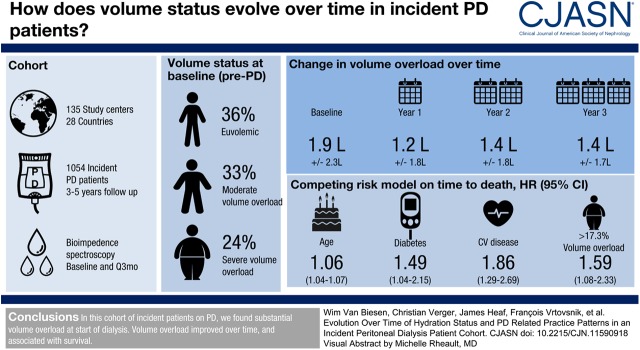
Background and objectives: Volume overload is frequent in prevalent patients on kidney replacement therapies and is associated with outcome. This study was devised to follow-up volume status of an incident population on peritoneal dialysis (PD) and to relate this to patient-relevant outcomes.
Design, setting, participants, & measurements: This prospective cohort study was implemented in 135 study centers from 28 countries. Incident participants on PD were enrolled just before the actual PD treatment was started. Volume status was measured using bioimpedance spectroscopy before start of PD and thereafter in 3-month intervals, together with clinical and laboratory parameters, and PD prescription. The association of volume overload with time to death was tested using a competing risk Cox model.
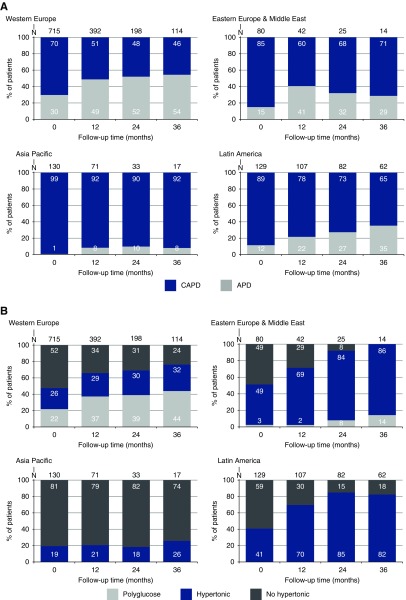
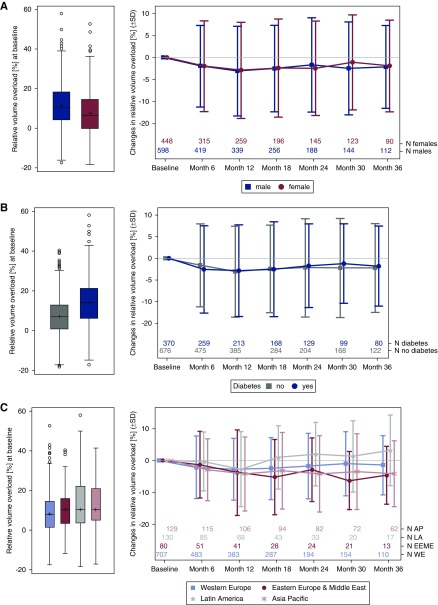
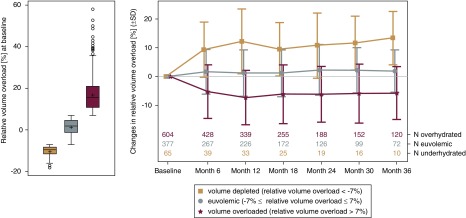
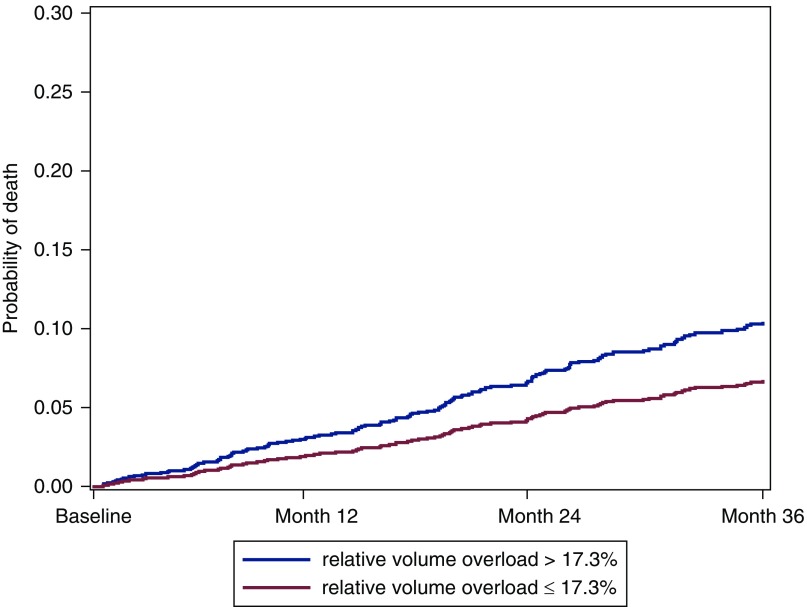
Results: In this population of 1054 participants incident on PD, volume overload before start of PD amounted to 1.9±2.3 L, and decreased to 1.2±1.8 L during the first year. At all time points, men and participants with diabetes were at higher risk to be volume overloaded. Dropout from PD during 3 years of observation by transfer to hemodialysis or transplantation (23% and 22%) was more prevalent than death (13%). Relative volume overload >17.3% was independently associated with higher risk of death (adjusted hazard ratio, 1.59; 95% confidence interval, 1.08 to 2.33) compared with relative volume overload ≤17.3%. Different practice patterns were observed between regions with respect to proportion of patients on PD versus hemodialysis, selection of PD modality, and prescription of hypertonic solutions.
Conclusions: In this large cohort of incident participants on PD, with different treatment practices across centers and regions, we found substantial volume overload already at start of dialysis. Volume overload improved over time, and was associated with survival.
Keywords: Confidence Intervals; Follow-Up Studies; Hypertonic Solutions; Proportional Hazards Models; Prospective Studies; Renal Replacement Therapy; Spectrum; Treatment Outcome; Water-Electrolyte Imbalance; bioimpedance; diabetes mellitus; fluid overload; fluid status; peritoneal dialysis; renal dialysis.
Copyright © 2019 by the American Society of Nephrology.
Figures
Comment in
-
Managing Fluid Control in the Peritoneal Dialysis Population.Clin J Am Soc Nephrol. 2019 Jun 7;14(6):783-784. doi: 10.2215/CJN.04660419. Epub 2019 May 23. Clin J Am Soc Nephrol. 2019. PMID: 31123182 Free PMC article. No abstract available.
References
-
- Jager KJ, Merkus MP, Dekker FW, Boeschoten EW, Tijssen JG, Stevens P, Bos WJ, Krediet RT; NECOSAD Study Group : Mortality and technique failure in patients starting chronic peritoneal dialysis: Results of The Netherlands cooperative study on the adequacy of dialysis. Kidney Int 55: 1476–1485, 1999 - PubMed
-
- Htay H, Cho Y, Pascoe EM, Darssan D, Nadeau-Fredette AC, Hawley C, Clayton PA, Borlace M, Badve SV, Sud K, Boudville N, McDonald SP, Johnson DW: Center effects and peritoneal dialysis peritonitis outcomes: Analysis of a national registry. Am J Kidney Dis 71: 814–821, 2018 - PubMed
-
- Beduschi Gde C, Figueiredo AE, Olandoski M, Pecoits-Filho R, Barretti P, de Moraes TP; All Centers that Contributed to the BRAZPD : Automated peritoneal dialysis is associated with better survival rates compared to continuous ambulatory peritoneal dialysis: A propensity score matching analysis. PLoS One 10: e0134047, 2015 - PMC - PubMed
-
- Chatoth DK, Golper TA, Gokal R: Morbidity and mortality in redefining adequacy of peritoneal dialysis: A step beyond the national kidney foundation dialysis outcomes quality initiative. Am J Kidney Dis 33: 617–632, 1999 - PubMed
MeSH terms
LinkOut - more resources
Full Text Sources
Medical
