. 2019 May 23;11(10):3262-3279.
doi: 10.18632/aging.101978.

Abnormal gut microbiota composition contributes to cognitive dysfunction in streptozotocin-induced diabetic mice

Affiliations

Abnormal gut microbiota composition contributes to cognitive dysfunction in streptozotocin-induced diabetic mice

Fan Yu et al. Aging (Albany NY). .

Abstract

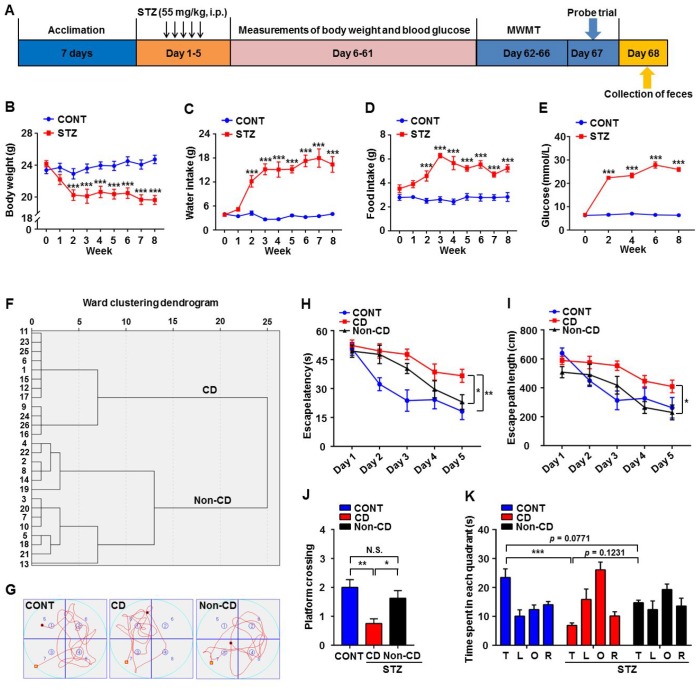
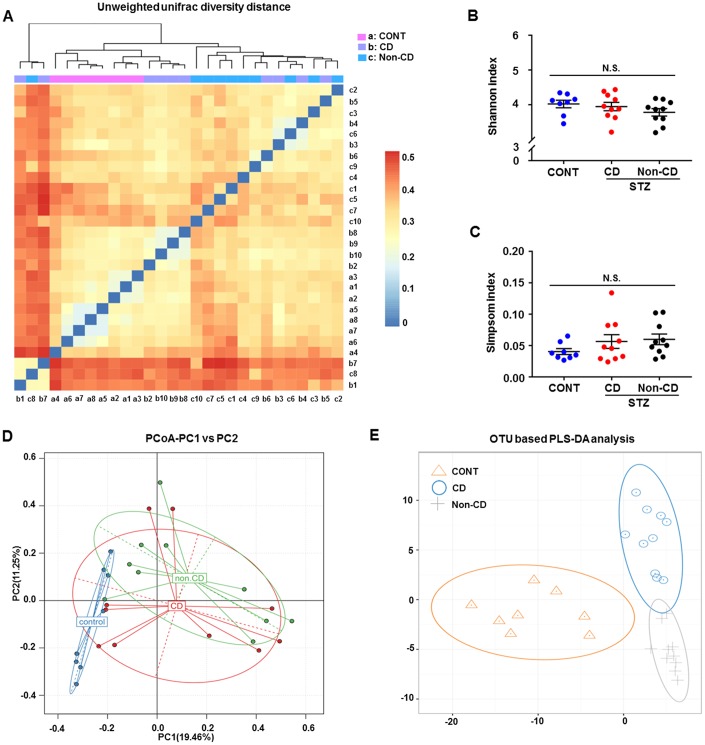
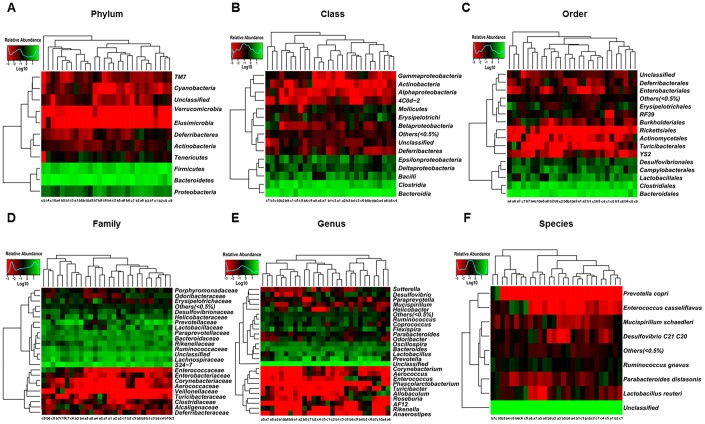
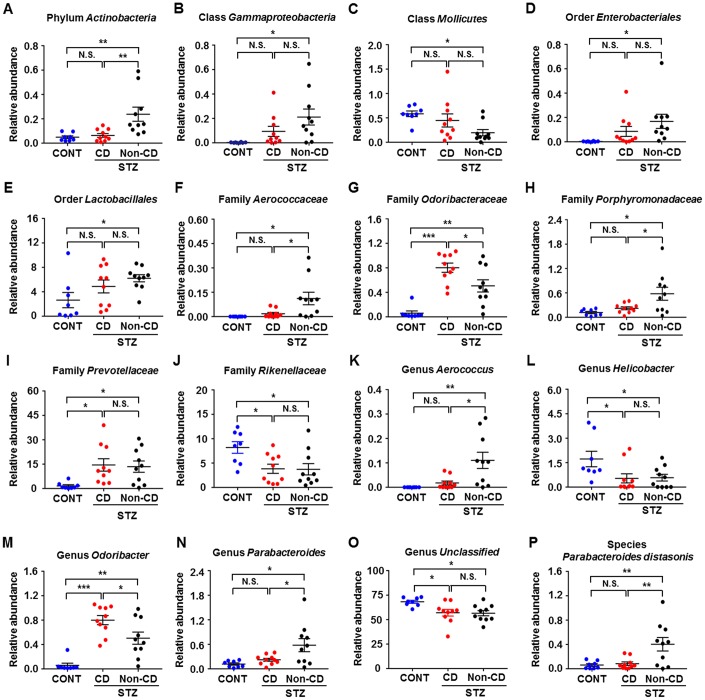
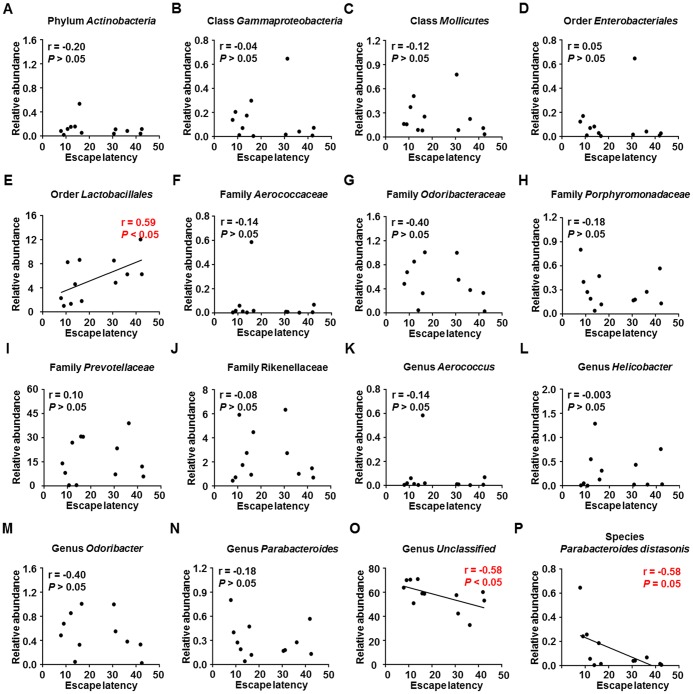
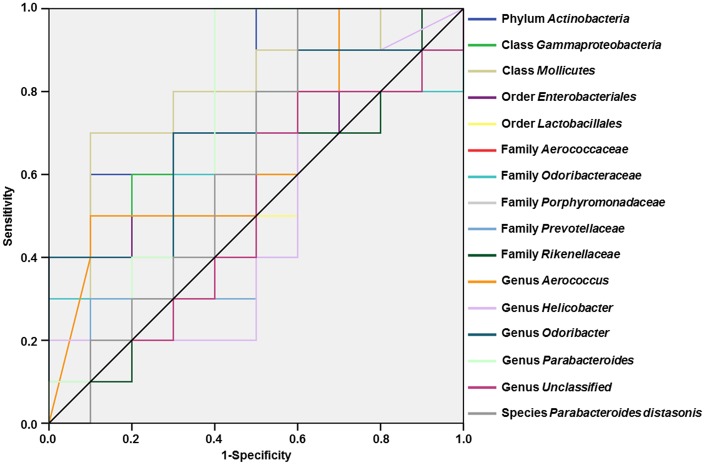
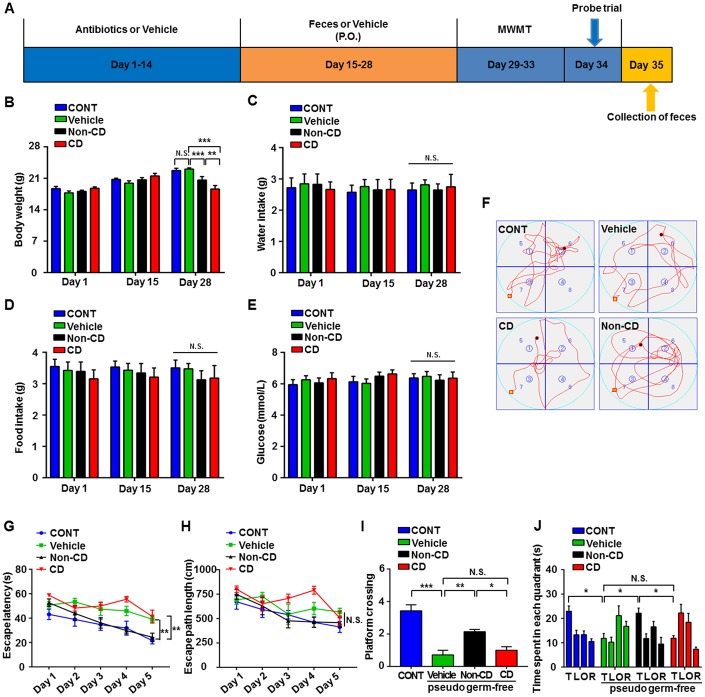
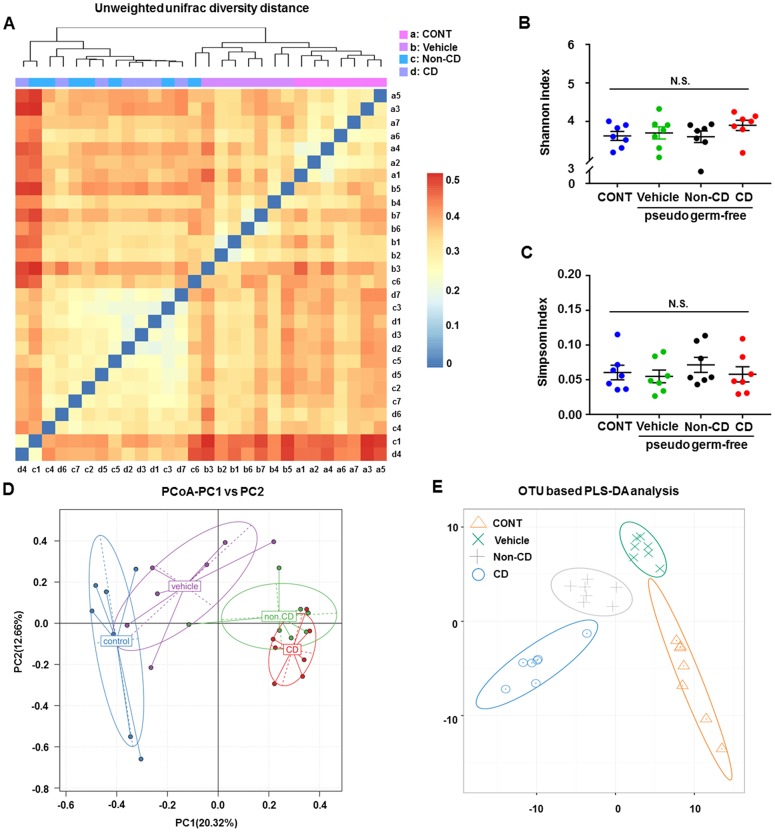
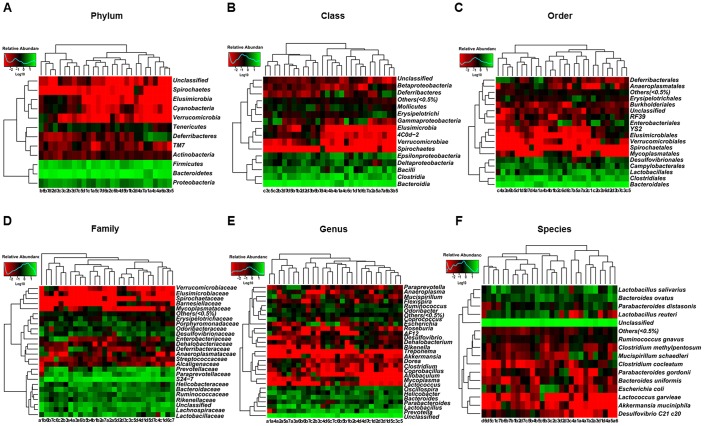
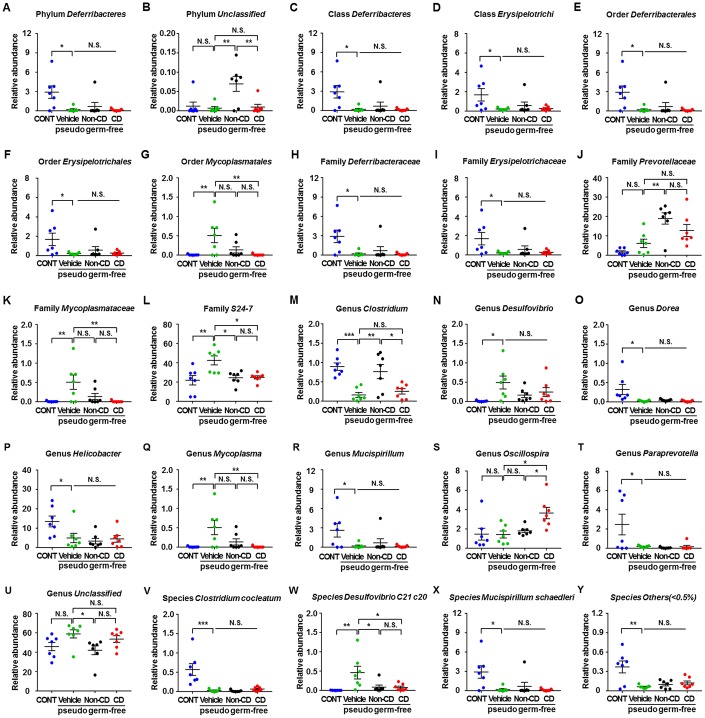
Both diabetes and Alzheimer's disease are age-related disorders, and numerous studies have demonstrated that patients with diabetes are at an increased risk of cognitive dysfunction (CD) and Alzheimer's disease, suggesting shared or interacting pathomechanisms. The present study investigated the role of abnormal gut microbiota in diabetes-induced CD and the potential underlying mechanisms. An intraperitoneal injection of streptozotocin administered for 5 consecutive days was used for establishing a diabetic animal model. Hierarchical cluster analysis of Morris water maze (MWM) performance indices (escape latency and target quadrant crossing) was adopted to classify the diabetic model mice into CD and Non-CD phenotypes. Both β-diversity and relative abundance of several gut bacteria significantly differed between the CD and Non-CD groups. Further, fecal bacteria transplantation from Non-CD mice, but not from CD mice, into the gut of pseudo-germ-free mice significantly improved host MWM performance, an effect associated with alterations in β-diversity and relative abundance of host gut bacteria. Collectively, these findings suggest that abnormal gut microbiota composition contributes to the onset of diabetes-induced CD and that improving gut microbiota composition is a potential therapeutic strategy for diabetes and related comorbidities.

Keywords: cognitive dysfunction; diabetes; gut microbiota; hierarchical cluster analysis; streptozotocin.


Conflict of interest statement

CONFLICTS OF INTEREST: All the authors declare no conflicts of interest.

Figures

Figure 1
Figure 1
Comparisons of Morris water maze performance among control (CONT), diabetic cognitive dysfunction (CD), and diabetic Non-CD mouse groups. (A) The schedule of the present study. At 7 days after acclimation, mice were intraperitoneally injected with STZ (55 mg/kg) for 5 consecutive days to induce diabetes or with vehicle as a control. Body weight, water and food intake, and blood glucose levels were measured from day 6 to 61. Mice were scheduled for MWM training (4 trials per day) from day 62 to 66 post-STZ, and the probe trial was performed on day 67. On day 68, fecal samples were collected for 16S rRNA gene sequencing. (B) Body weight (two-way ANOVA; Time: F8,56 = 8.446, p < 0.001; Group: F1,7 = 20.46, p < 0.01; Time × Group Interaction: F8,56 = 12.34, p < 0.001). (C) Water intake (two-way ANOVA; Time: F8,56 = 17.48, p < 0.001; Group: F1,7 = 105.1, p < 0.001; Interaction: F8,56 = 19.67, p < 0.001). (D) Food intake (two-way ANOVA; Time: F8,56 = 5.254, p < 0.001; Group: F1,7 = 108.4, p < 0.001; Interaction: F8,56 = 5.755, p < 0.001). (E) Blood glucose levels (two-way ANOVA; Time: F4,28 = 66.98, p < 0.001; Group: F1,7 = 2376, p < 0.001; Interaction: F4,28 = 79.15, p < 0.001). (F) Dendrogram of hierarchical clustering analysis. A total of 26 mice confirmed as diabetic following STZ injection were divided into CD and Non-CD groups according to MWM performance indices using hierarchical clustering analysis. (G) Representative trace graphs of CONT, CD, and Non-CD group swim paths in the MWM. (H) Escape latency (two-way ANOVA; Time: F4,28 = 23.09, p < 0.001; Group: F2,14 = 14.84, p < 0.001; Interaction: F8,56 = 1.57, p > 0.05). (I) Escape path length (two-way ANOVA; Time: F4,28 = 14.36, p < 0.001; Group: F2,14 = 15.74, p < 0.001; Interaction: F8,56 = 1.292, p > 0.05). (J) Platform crossings (one-way ANOVA; F2,21 = 7.373, p < 0.01). (K) Time spent in each quadrant (two-way ANOVA; Time: F3,21 = 5.917, p < 0.01; Group: F2,14 = 0.9345, p > 0.05; Interaction: F6,42 = 5.618, p < 0.001). Data are shown as mean ± SEM (n = 8−10 mice/group). *P < 0.05, **P < 0.01 or ***P < 0.001. ANOVA: analysis of variance; CD: cognitive dysfunction; CONT: control; MWM: Morris water maze; N.S.: not significant; SEM: standard error of the mean; STZ: streptozotocin.
Figure 2
Figure 2
Differences in gut microbiota profiles among CONT, CD, and Non-CD mice. (A) Unweighted unifrac diversity distance. (B) Shannon index (one-way ANOVA; F2,25 = 1.17, p > 0.05). (C) Simpson index (one-way ANOVA; F2,25 = 1.272, p > 0.05). (D) PCoA analysis of gut bacteria (PC1 versus PC2). (E) PLS-DA analysis of gut bacteria. The α-diversity is shown as mean ± SEM (n = 8−10 individual fecal samples/group). ANOVA: analysis of variance; CD: cognitive dysfunction; CONT: control; N.S.: not significant; PCoA: principal coordinate analysis; PLS-DA: partial least squares discrimination analysis; SEM: standard error of the mean.
Figure 3
Figure 3
Heatmaps of gut microbiota composition at phylum, class, order, family, genus, and species levels for CONT, CD, and Non-CD mice. (A) Heatmap (phylum level). (B) Heatmap (class level). (C) Heatmap (order level). (D) Heatmap (family level). (E) Heatmap (genus level). (F) Heatmap (species level).
Figure 4
Figure 4
Differences in the relative abundance of various gut microbes among CONT, CD, and Non-CD mice. (AP) Relative abundances of (A) phylum Actinobacteria (one-way ANOVA; F2,25 = 7.958, p < 0.01), (B) class Gammaproteobacteria (one-way ANOVA; F2,25 = 4.597, p < 0.05), (C) class Mollicutes (one-way ANOVA; F2,25 = 4.035, p < 0.05), (D) order Enterobacteriales (one-way ANOVA; F2,25 = 3.385, p = 0.05), (E) order Lactobacillales (one-way ANOVA; F2,25 = 3.277, p > 0.05), (F) family Aerococcaceae (one-way ANOVA; F2,25 = 6.019, p < 0.01), (G) family Odoribacteraceae (one-way ANOVA; F2,25 = 20.67, p < 0.001), (H) family Porphyromonadaceae (one-way ANOVA; F2,25 = 5.597, p < 0.01), (I) family Prevotellaceae (one-way ANOVA; F2,25 = 4.528, p < 0.05), (J) family Rikenellaceae (one-way ANOVA; F2,25 = 4.938, p < 0.05), (K) genus Aerococcus (one-way ANOVA; F2,25 = 7.863, p < 0.01), (L) genus Helicobacter (one-way ANOVA; F2,25 = 4.135, p < 0.05), (M) genus Odoribacter (one-way ANOVA; F2,25 = 20.78, p < 0.001), (N) genus Parabacteroides (one-way ANOVA; F2,25 = 5.597, p < 0.01), (O) genus Unclassified (one-way ANOVA; F2,25 = 5.114, p < 0.05), and (P) species Parabacteroides distasonis (one-way ANOVA; F2,25 = 7.235, p < 0.01). Data are shown as mean ± SEM (n = 8−10 individual fecal samples/group). *P < 0.05, **P < 0.01 or ***P < 0.001. ANOVA: analysis of variance; CD: cognitive dysfunction; CONT: control; N.S.: not significant; SEM: standard error of the mean.
Figure 5
Figure 5
Correlations between MWM escape latency and relative abundance of various gut microbes (N = 12). (A) Phylum Actinobacteria (r = −0.20, P > 0.05). (B) Class Gammaproteobacteria (r = −0.04, P > 0.05). (C) Class Mollicutes (r = −0.12, P > 0.05). (D) Order Enterobacteriales (r = 0.05, P > 0.05). (E) Order Lactobacillales (r = 0.59, P < 0.05). (F) Family Aerococcaceae (r = −0.14, P > 0.05). (G) Family Odoribacteraceae (r = −0.40, P > 0.05). (H) Family Porphyromonadaceae (r = −0.18, P > 0.05). (I) Family Prevotellaceae (r = 0.10, P > 0.05). (J) Family Rikenellaceae (r = −0.08, P > 0.05). (K) Genus Aerococcus (r = −0.14, P > 0.05). (L) Genus Helicobacter (r = −0.003, P > 0.05). (M) Genus Odoribacter (r = −0.40, P > 0.05). (N) Genus Parabacteroides (r = −0.18, P > 0.05). (O) Genus Unclassified (r = −0.58, P < 0.05). (P) Species Parabacteroides distasonis (r = −0.58, P = 0.05). MWM: Morris water maze.
Figure 6
Figure 6
ROC curves of various gut microbes for the diagnosis of diabetes-induced cognitive dysfunction. (A) Phylum Actinobacteria (AUC = 0.800). (B) Class Gammaproteobacteria (AUC = 0.680). (C) Class Mollicutes (AUC = 0.800). (D) Order Enterobacteriales (AUC = 0.640). (E) Order Lactobacillales (AUC = 0.600). (F) Family Aerococcaceae (AUC = 0.660). (G) Family Odoribacteraceae (AUC = 0.600). (H) Family Porphyromonadaceae (AUC = 0.710). (I) Family Prevotellaceae (AUC = 0.520). (J) Family Rikenellaceae (AUC = 0.520). (K) Genus Aerococcus (AUC = 0.660). (L) Genus Helicobacter (AUC = 0.510). (M) Genus Odoribacter (AUC = 0.700). (N) Genus Parabacteroides (AUC = 0.710). (O) Genus Unclassified (AUC = 0.510). (P) Species Parabacteroides distasonis (AUC = 0.630). AUC: area under the curve; ROC: receiver operating characteristic.
Figure 7
Figure 7
Effects of fecal microbiota transplantation from CD and Non-CD mice on MWM performance by pseudo-germ-free mice. (A) Schedule for evaluation of MWM performance by pseudo-germ-free (host) mice transplanted with gut bacteria from diabetic mice. Host mice were treated with large doses of antibiotic solution for 14 consecutive days, and then orally treated with fecal microbiota from CD or Non-CD mice. MWM training trials were conducted from day 29 to 33, and the probe trial was performed on day 34. On day 35, fecal samples were collected for 16S rRNA gene sequencing. (B) Body weight (two-way ANOVA; Time: F2,12 = 76.89, p < 0.001; Group: F3,18 = 1.455, p > 0.05; Interaction: F6,36 = 13.85, p < 0.001). (C) Water intake (two-way ANOVA; Time: F2,10 = 1.016, p > 0.05; Group: F3,15 = 0.074, p > 0.05; Interaction: F6,30 = 0.133, p > 0.05). (D) Food intake (two-way ANOVA; Time: F2,10 = 0.319, p > 0.05; Group: F3,15 = 0.367, p > 0.05; Interaction: F6,30 = 0.445, p > 0.05). (E) Blood glucose levels (two-way ANOVA; Time: F2,12 = 0.433, p > 0.05; Group: F3,18 = 0.582, p > 0.05; Interaction: F6,36 = 0.357, p > 0.05). (F) Representative trace graphs of mouse swim paths in the MWM. (G) Escape latency (two-way ANOVA; Time: F4,24 = 16.13, p < 0.001; Group: F3,18 = 16.9, p < 0.001; Interaction: F12,72 = 1.462, p > 0.05). (H) Escape path length (two-way ANOVA; Time: F4,24 = 10.09, p < 0.001; Group: F3,18 = 4.763, p < 0.05; Interaction: F12,72 = 1.679, p > 0.05). (I) Platform crossings (one-way ANOVA; F3,24 = 21.4, p < 0.001). (J) Time spent in each quadrant (two-way ANOVA; Time: F3,18 = 4.359, p < 0.05; Group: F3,18 = 6.379, p < 0.01; Interaction: F9,54 = 4.466, p < 0.001). Data are shown as mean ± SEM (n = 8 individual samples/group). *P < 0.05, **P < 0.01 or ***P < 0.001. ANOVA: analysis of variance; CD: cognitive dysfunction; CONT: control; MWM: Morris water maze; N.S.: not significant; SEM: standard error of the mean.
Figure 8
Figure 8
Changes in the gut microbiota of pseudo-germ-free mice following transplantation from CD and Non-CD diabetic mice. (A) Unweighted unifrac diversity distance. (B) Shannon index (one-way ANOVA; F3,24 = 0.928, p > 0.05). (C) Simpson index (one-way ANOVA; F3,24 = 0.486, p > 0.05). (D) PCoA analysis of gut bacteria data (PC1 versus PC2). (E) PLS-DA analysis of gut bacteria data. The α-diversity is shown as mean ± SEM (n = 7 individual samples/group). ANOVA: analysis of variance; CD: cognitive dysfunction; CONT: control; N.S.: not significant; PCoA: principal coordinate analysis; PLS-DA: partial least squares discrimination analysis; SEM: standard error of the mean.
Figure 9
Figure 9
Heatmaps of gut microbiota composition in pseudo-germ-free mice following transplantation from CD and Non-CD diabetic mice. (A) Heatmap (phylum level). (B) Heatmap (class level). (C) Heatmap (order level). (D) Heatmap (family level). (E) Heatmap (genus level). (F) Heatmap (species level).
Figure 10
Figure 10
Differences in relative abundance of various gut microbes among pseudo-germ-free mice following transplantation from CD and Non-CD diabetic mice. (AY) Relative abundance of (A) phylum Deferribacteres (one-way ANOVA; F3,24 = 5.031, p < 0.01), (B) phylum Unclassified (one-way ANOVA; F3,24 = 6.608, p < 0.01), (C) class Deferribacteres (one-way ANOVA; F3,24 = 5.031, p < 0.01), (D) class Erysipelotrichi (one-way ANOVA; F3,24 = 3.345, p < 0.05), (E) order Deferribacterales (one-way ANOVA; F3,24 = 5.031, p < 0.01), (F) order Erysipelotrichales (one-way ANOVA; F3,24 = 3.345, p < 0.05), (G) order Mycoplasmatales (one-way ANOVA; F3,24 = 5.457, p < 0.01), (H) family Deferribacteraceae (one-way ANOVA; F3,24 = 5.031, p < 0.01), (I) family Erysipelotrichaceae (one-way ANOVA; F3,24 = 3.345, p < 0.05), (J) family Prevotellaceae (one-way ANOVA; F3,24 = 9.825, p < 0.001), (K) family Mycoplasmataceae (one-way ANOVA; F3,24 = 5.457, p < 0.01), (L) family S24-7 (one-way ANOVA; F3,24 = 6.543, p < 0.01), (M) genus Clostridium (one-way ANOVA; F3,24 = 10.32, p < 0.001), (N) genus Desulfovibrio (one-way ANOVA; F3,24 = 3.552, p < 0.05), (O) genus Dorea (one-way ANOVA; F3,24 = 4.82, p < 0.01), (P) genus Helicobacter (one-way ANOVA; F3,24 = 4.677, p < 0.05), (Q) genus Mycoplasma (one-way ANOVA; F3,24 = 5.457, p < 0.01), ® genus Mucispirillum (one-way ANOVA; F3,24 = 3.575, p < 0.05), (S) genus Oscillospira (one-way ANOVA; F3,24 = 5.053, p < 0.01), (T) genus Paraprevotella (one-way ANOVA; F3,24 = 4.656, p < 0.05), (U) genus Unclassified (one-way ANOVA; F3,24 = 3.379, p < 0.05), (V) species Clostridium cocleatum (one-way ANOVA; F3,24 = 12.09, p < 0.001), (W) species Desulfovibrio C21 c20 (one-way ANOVA; F3,24 = 5.486, p < 0.01), (X) species Mucispirillum schaedleri (one-way ANOVA; F3,24 = 3.575, p < 0.05), and (Y) species Others (<0.5%) (one-way ANOVA; F3,24 = 7.748, p < 0.001). Data are shown as mean ± SEM (n = 7 individual samples/group). *P < 0.05, **P < 0.01 or ***P < 0.001. ANOVA: analysis of variance; CD: cognitive dysfunction; CONT: control; N.S.: not significant; SEM: standard error of the mean.

Similar articles

Cited by

References

    1. Ingelfinger JR, Jarcho JA. Increase in the Incidence of Diabetes and Its Implications. N Engl J Med. 2017; 376:1473–74. 10.1056/NEJMe1616575 - DOI - PubMed
    1. Geiss LS, Wang J, Cheng YJ, Thompson TJ, Barker L, Li Y, Albright AL, Gregg EW. Prevalence and incidence trends for diagnosed diabetes among adults aged 20 to 79 years, United States, 1980-2012. JAMA. 2014; 312:1218–26. 10.1001/jama.2014.11494 - DOI - PubMed
    1. Baglietto-Vargas D, Shi J, Yaeger DM, Ager R, LaFerla FM. Diabetes and Alzheimer’s disease crosstalk. Neurosci Biobehav Rev. 2016; 64:272–87. 10.1016/j.neubiorev.2016.03.005 - DOI - PubMed
    1. Biessels GJ, Despa F. Cognitive decline and dementia in diabetes mellitus: mechanisms and clinical implications. Nat Rev Endocrinol. 2018; 14:591–604. 10.1038/s41574-018-0048-7 - DOI - PMC - PubMed
    1. Vieira MN, Lima-Filho RA, De Felice FG. Connecting Alzheimer’s disease to diabetes: underlying mechanisms and potential therapeutic targets. Neuropharmacology. 2018; 136:160–71. 10.1016/j.neuropharm.2017.11.014 - DOI - PubMed

Publication types

MeSH terms

Substances

LinkOut - more resources