

Evidence for fungi and gold redox interaction under Earth surface conditions
- PMID: 31123249
- PMCID: PMC6533363
- DOI: 10.1038/s41467-019-10006-5
Evidence for fungi and gold redox interaction under Earth surface conditions
Abstract
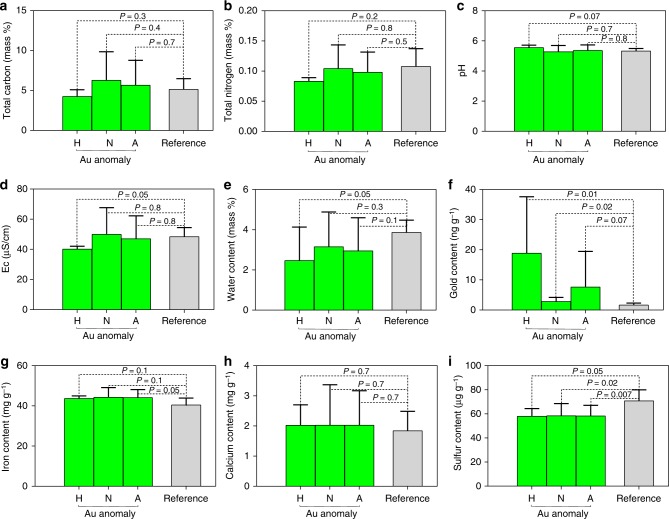
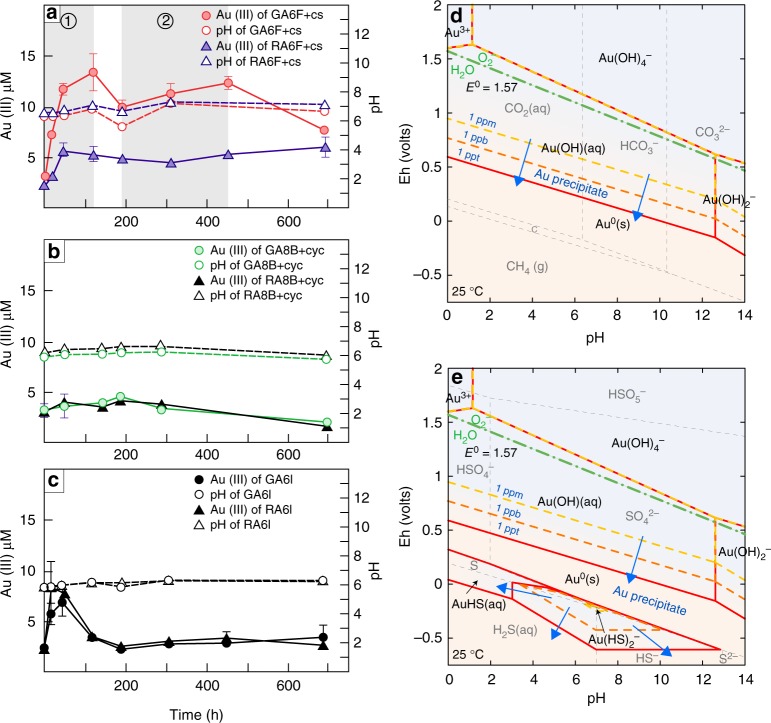
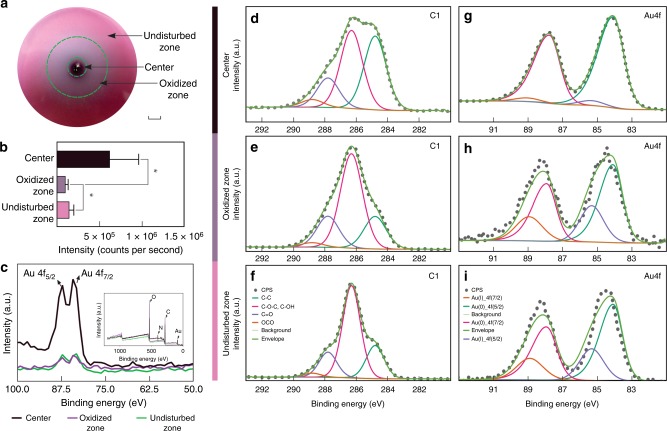
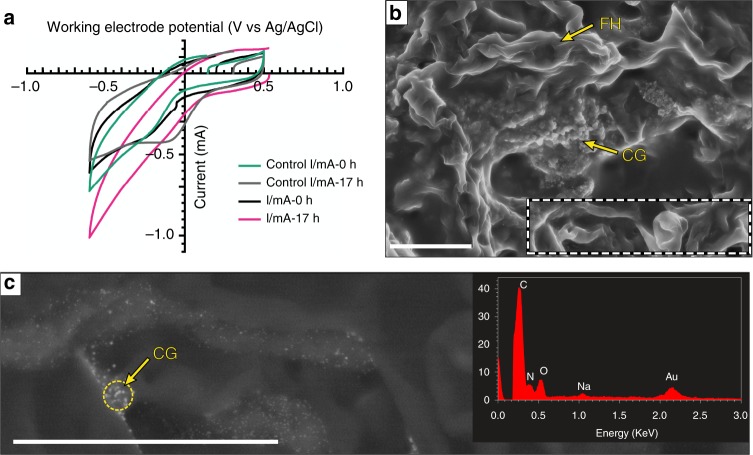
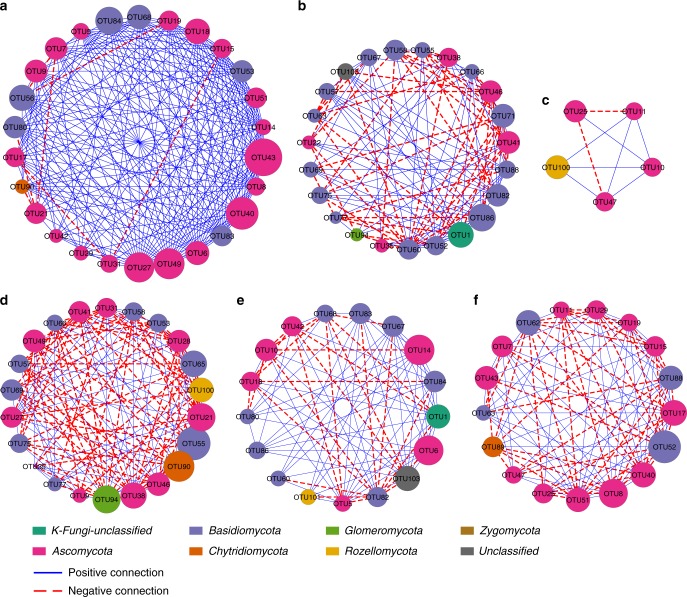
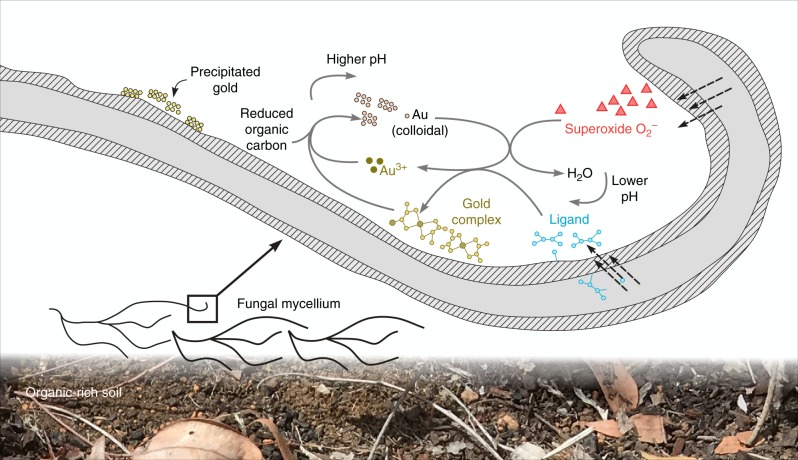
Microbial contribution to gold biogeochemical cycling has been proposed. However, studies have focused primarily on the influence of prokaryotes on gold reduction and precipitation through a detoxification-oriented mechanism. Here we show, fungi, a major driver of mineral bioweathering, can initiate gold oxidation under Earth surface conditions, which is of significance for dissolved gold species formation and distribution. Presence of the gold-oxidizing fungus TA_pink1, an isolate of Fusarium oxysporum, suggests fungi have the potential to substantially impact gold biogeochemical cycling. Our data further reveal that indigenous fungal diversity positively correlates with in situ gold concentrations. Hypocreales, the order of the gold-oxidizing fungus, show the highest centrality in the fungal microbiome of the auriferous environment. Therefore, we argue that the redox interaction between fungi and gold is critical and should be considered in gold biogeochemical cycling.
Conflict of interest statement
The authors declare no competing interests.
Figures
Similar articles
-
Different active biomolecules involved in biosynthesis of gold nanoparticles by three fungus species.J Biomed Nanotechnol. 2011 Apr;7(2):245-54. doi: 10.1166/jbn.2011.1285. J Biomed Nanotechnol. 2011. PMID: 21702362
-
Geomycology: biogeochemical transformations of rocks, minerals, metals and radionuclides by fungi, bioweathering and bioremediation.Mycol Res. 2007 Jan;111(Pt 1):3-49. doi: 10.1016/j.mycres.2006.12.001. Mycol Res. 2007. PMID: 17307120
-
Monitoring the volatile language of fungi using gas chromatography-ion mobility spectrometry.Anal Bioanal Chem. 2021 May;413(11):3055-3067. doi: 10.1007/s00216-021-03242-6. Epub 2021 Mar 6. Anal Bioanal Chem. 2021. PMID: 33675374 Free PMC article.
-
Microorganisms meet solid minerals: interactions and biotechnological applications.Appl Microbiol Biotechnol. 2016 Aug;100(16):6935-46. doi: 10.1007/s00253-016-7678-2. Epub 2016 Jun 23. Appl Microbiol Biotechnol. 2016. PMID: 27338573 Review.
-
Molecular Hydrogen, a Neglected Key Driver of Soil Biogeochemical Processes.Appl Environ Microbiol. 2019 Mar 6;85(6):e02418-18. doi: 10.1128/AEM.02418-18. Print 2019 Mar 15. Appl Environ Microbiol. 2019. PMID: 30658976 Free PMC article. Review.
Cited by
-
Gold Nanoparticles Dissolve Extracellularly in the Presence of Human Macrophages.Int J Nanomedicine. 2021 Aug 26;16:5895-5908. doi: 10.2147/IJN.S314643. eCollection 2021. Int J Nanomedicine. 2021. PMID: 34475755 Free PMC article.
-
Bioleaching of Gold from Sulfidic Gold Ore Concentrate and Electronic Waste by Roseovarius tolerans and Roseovarius mucosus.Microorganisms. 2020 Nov 14;8(11):1783. doi: 10.3390/microorganisms8111783. Microorganisms. 2020. PMID: 33202548 Free PMC article.
References
-
- Anand RR, Aspandiar MF, Noble RRP. A review of metal transfer mechanisms through transported cover with emphasis on the vadose zone within the Australian regolith. Ore Geol. Rev. 2016;73(Part 3):394–416. doi: 10.1016/j.oregeorev.2015.06.018. - DOI
-
- Hough RM, et al. Naturally occurring gold nanoparticles and nanoplates. Geology. 2008;36:571–574. doi: 10.1130/G24749A.1. - DOI
-
- Southam G, Lengke MF, Fairbrother L, Reith F. The biogeochemistry of gold. Elements. 2009;5:303–307. doi: 10.2113/gselements.5.5.303. - DOI
-
- Mann AW. Oxidised gold deposits: relationships between oxidation and relative position of the water-table. Aust. J. Earth Sci. 1998;45:97–108. doi: 10.1080/08120099808728371. - DOI
Publication types
MeSH terms
Substances
LinkOut - more resources
Full Text Sources
