

Genetic structure and forensic characteristics of Tibeto-Burman-speaking Ü-Tsang and Kham Tibetan Highlanders revealed by 27 Y-chromosomal STRs
- PMID: 31123281
- PMCID: PMC6533295
- DOI: 10.1038/s41598-019-44230-2
Genetic structure and forensic characteristics of Tibeto-Burman-speaking Ü-Tsang and Kham Tibetan Highlanders revealed by 27 Y-chromosomal STRs
Abstract
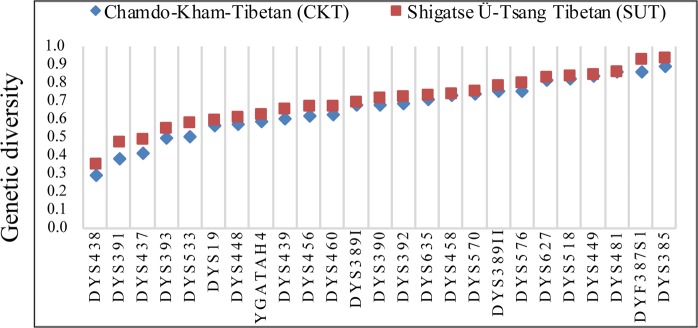
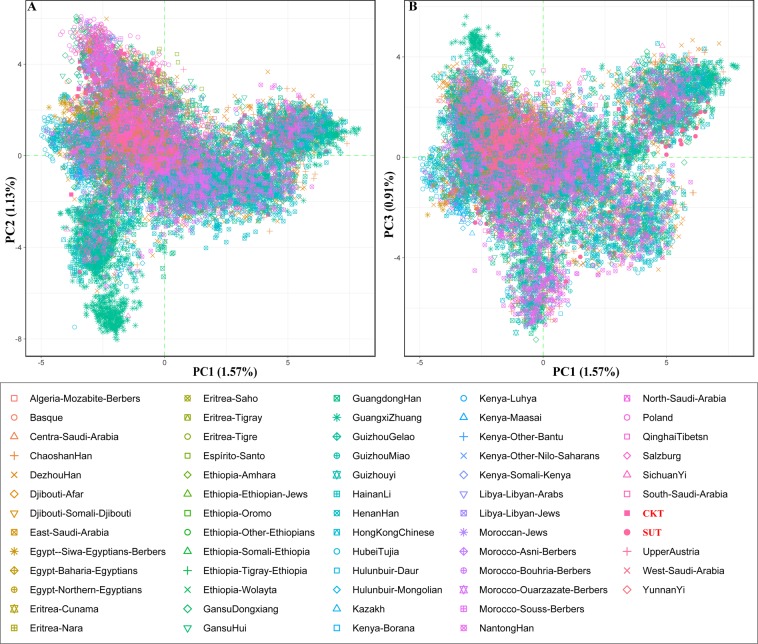
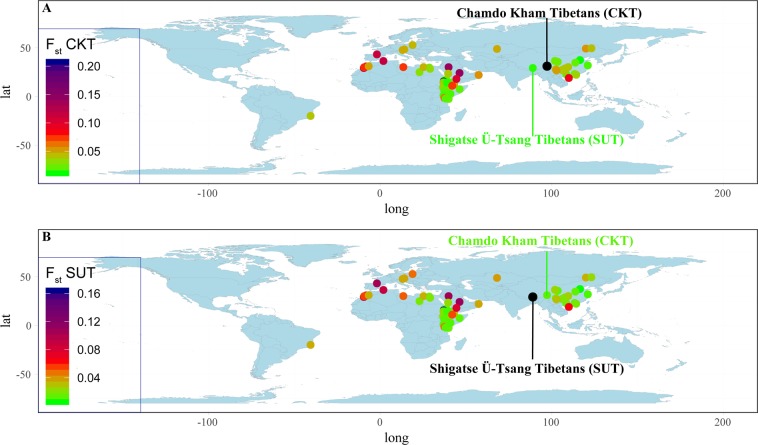
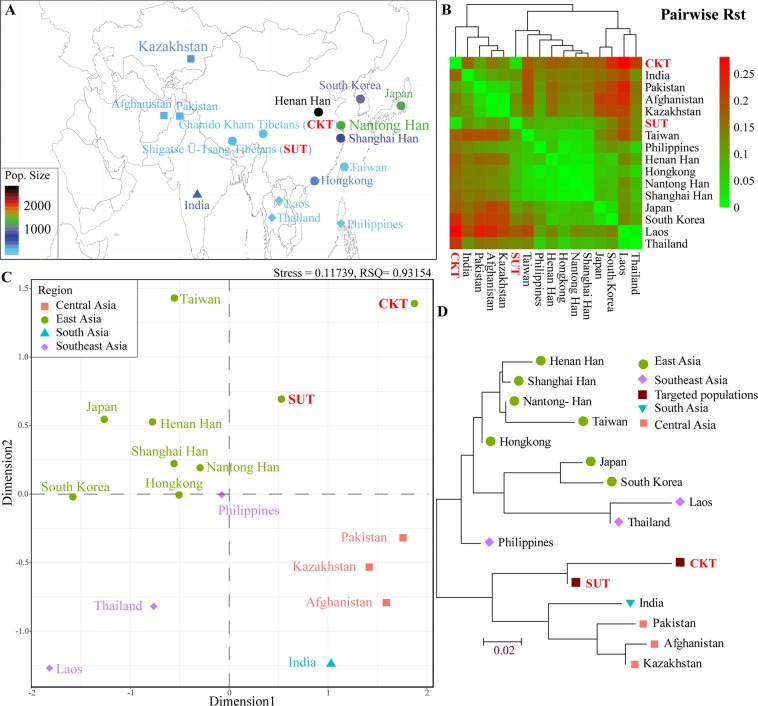
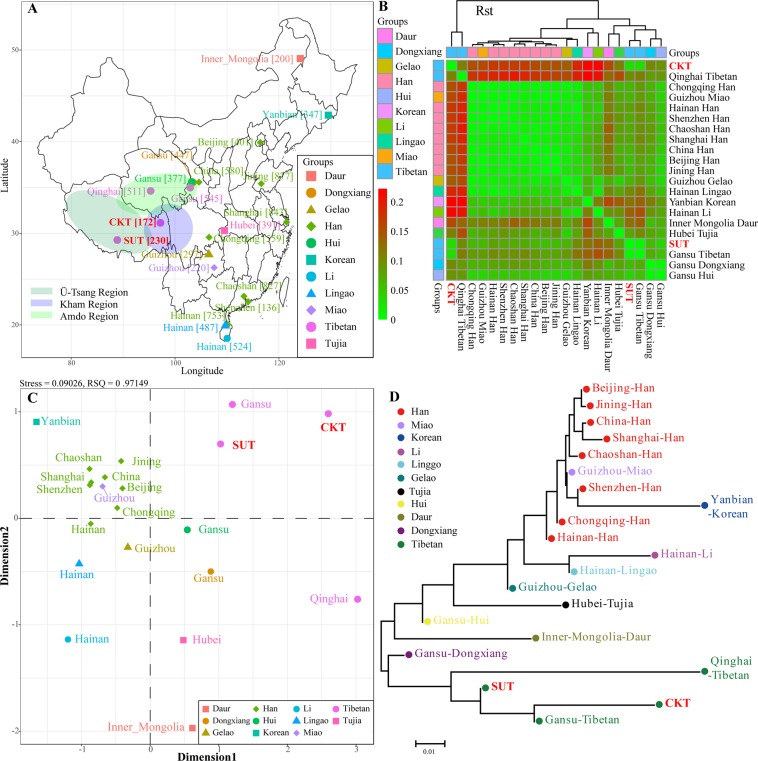
Culturally diverse Tibetans (Ü-Tsang, Kham and Ando) harboring a unique molecular mechanism that allows them to successfully adapt to hypoxic environments in the Qinghai-Tibet Plateau have been a subject of great interest in medical genetics, linguistics, archeology and forensic science. However, forensic characteristics and genetic variations of the Y-chromosomal 27-marker haplotype included in the Yfiler Plus system in the Ü-Tsang and Kham Tibeto-Burman-speaking Tibetans remain unexplored. Thus, we genotyped 27 Y-STRs in 230 Shigatse Ü-Tsang Tibetans (SUT) and 172 Chamdo Kham Tibetans (CKT) to investigate the forensic characterization and genetic affinity of Chinese Tibetan Highlanders. The haplotype diversities were 0.999962028 in SUT and 0.999796002 in CKT. Forensic diversity measures indicated that this 27-Y-STR amplification system is appropriate for routine forensic applications, such as identifying and separating unrelated males in deficiency paternity cases, male disaster victims and missing person identification and determining male components in sexual assault cases. Moreover, the genetic relationships among 63 worldwide populations (16,282 individuals), 16 Asian populations, and 21 Chinese populations were analyzed and reconstructed using principal component analysis, multidimensional scaling plots and a phylogenetic tree. Considerable genetic differences were observed between Tibetan populations and other geographically/ethnically diverse populations (Han Chinese). Our studied SUT and CKT have a genetically closer relationship with Gansu Ando Tibetans than with other Asians. In total, our analyses indicated that subpopulation structures exist among Asian and Chinese populations, and population-specific reference databases should be established for forensic applications.
Conflict of interest statement
The authors declare no competing interests.
Figures
Similar articles
-
Tibetan Y-STR trait in the eleven regions of the Qinghai-Tibet Plateau.Int J Legal Med. 2021 Sep;135(5):1793-1795. doi: 10.1007/s00414-021-02611-1. Epub 2021 Apr 27. Int J Legal Med. 2021. PMID: 33907869
-
Forensic and phylogenetic analyses of populations in the Tibetan-Yi corridor using 41 Y-STRs.Int J Legal Med. 2021 May;135(3):783-785. doi: 10.1007/s00414-020-02453-3. Epub 2020 Nov 3. Int J Legal Med. 2021. PMID: 33141282
-
Investigating the genetic diversity and affinities of historical populations of Tibet.Gene. 2019 Jan 15;682:81-91. doi: 10.1016/j.gene.2018.09.043. Epub 2018 Sep 26. Gene. 2019. PMID: 30266503
-
Genetic polymorphisms and phylogenetic analyses of the Ü-Tsang Tibetan from Lhasa based on 30 slowly and moderately mutated Y-STR loci.Forensic Sci Res. 2020 Oct 12;7(2):181-188. doi: 10.1080/20961790.2020.1810882. eCollection 2022. Forensic Sci Res. 2020. PMID: 35784414 Free PMC article.
-
Peopling the Tibetan plateau: insights from archaeology.High Alt Med Biol. 2011 Summer;12(2):141-7. doi: 10.1089/ham.2010.1094. High Alt Med Biol. 2011. PMID: 21718162 Review.
Cited by
-
Forensic characteristics of 38 Y-STR loci in the Hui population from Shaanxi Province, Northwest China.Heliyon. 2024 Sep 29;10(19):e38501. doi: 10.1016/j.heliyon.2024.e38501. eCollection 2024 Oct 15. Heliyon. 2024. PMID: 39435089 Free PMC article.
-
Unveiling the genetic landscape of high-altitude adaptive ethnic groups with polymorphic markers: Implications of comprehensive forensic appraisals and population genetic investigations.Heliyon. 2023 Oct 25;9(11):e21229. doi: 10.1016/j.heliyon.2023.e21229. eCollection 2023 Nov. Heliyon. 2023. PMID: 38027587 Free PMC article.
-
Genetic Reconstruction and Forensic Analysis of Chinese Shandong and Yunnan Han Populations by Co-Analyzing Y Chromosomal STRs and SNPs.Genes (Basel). 2020 Jul 3;11(7):743. doi: 10.3390/genes11070743. Genes (Basel). 2020. PMID: 32635262 Free PMC article.
-
Genomic formation of Tibeto-Burman speaking populations in Guizhou, Southwest China.BMC Genomics. 2023 Nov 7;24(1):672. doi: 10.1186/s12864-023-09767-7. BMC Genomics. 2023. PMID: 37936086 Free PMC article.
-
Peopling History of the Tibetan Plateau and Multiple Waves of Admixture of Tibetans Inferred From Both Ancient and Modern Genome-Wide Data.Front Genet. 2021 Sep 3;12:725243. doi: 10.3389/fgene.2021.725243. eCollection 2021. Front Genet. 2021. PMID: 34650596 Free PMC article.
References
-
- Madsen DB, et al. The Late Upper Paleolithic occupation of the northern Tibetan Plateau margin. J. Archaeol. Sci. 2006;33:1433–1444. doi: 10.1016/j.jas.2006.01.017. - DOI
Publication types
MeSH terms
LinkOut - more resources
Full Text Sources
