. 2019 May 23;9(1):7765.
doi: 10.1038/s41598-019-44185-4.

Sugar-induced de novo cytokinin biosynthesis contributes to Arabidopsis growth under elevated CO2

Affiliations

Sugar-induced de novo cytokinin biosynthesis contributes to Arabidopsis growth under elevated CO2

Takatoshi Kiba et al. Sci Rep. .

Abstract

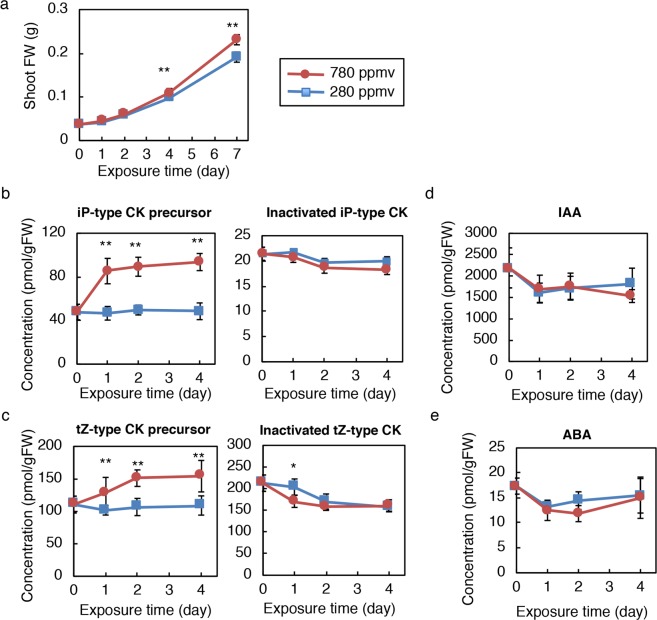
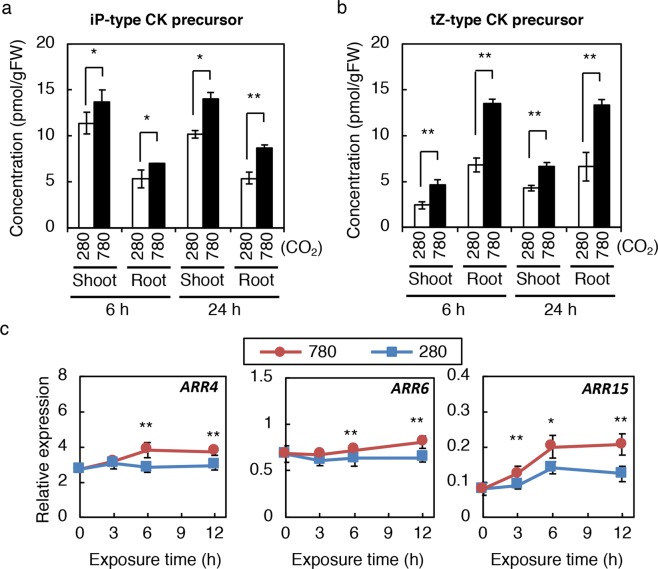
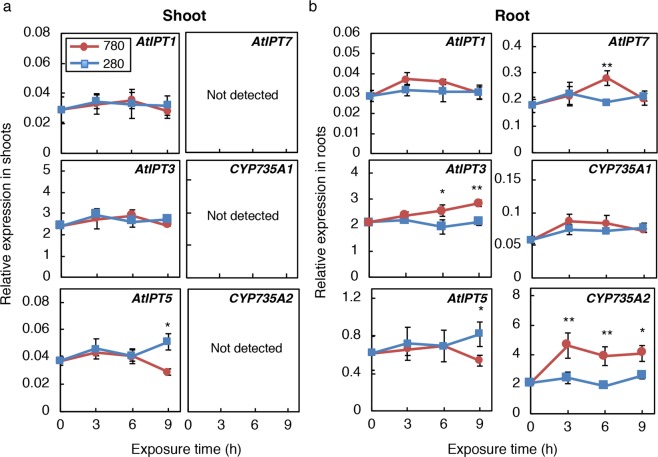
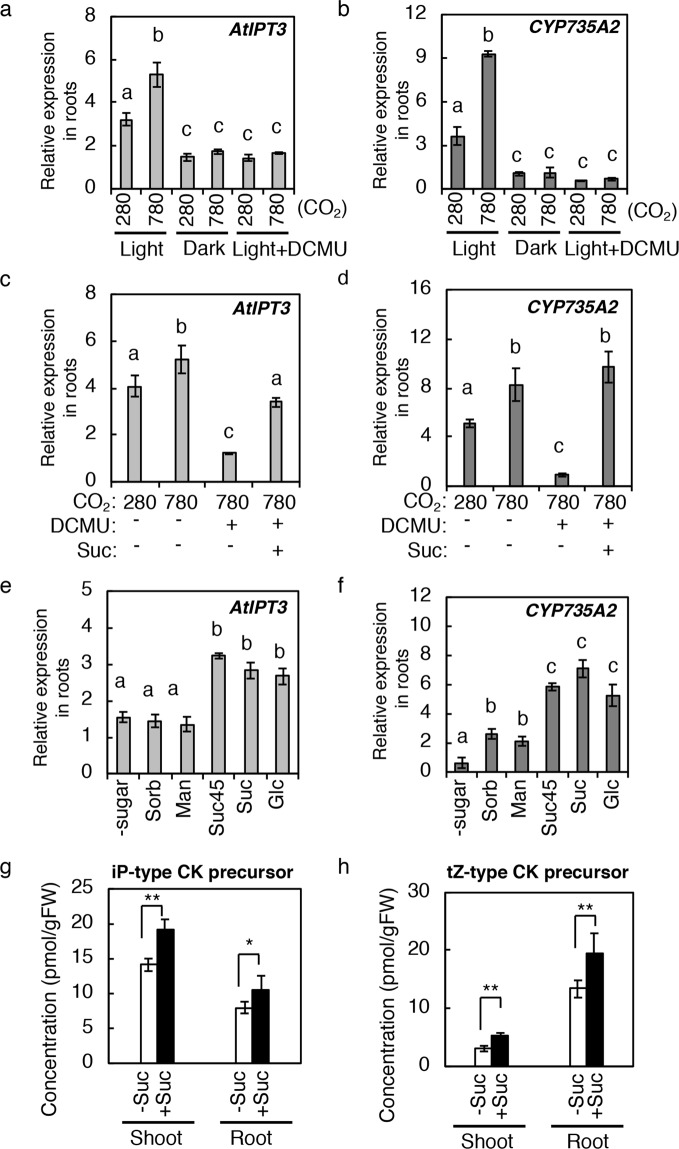
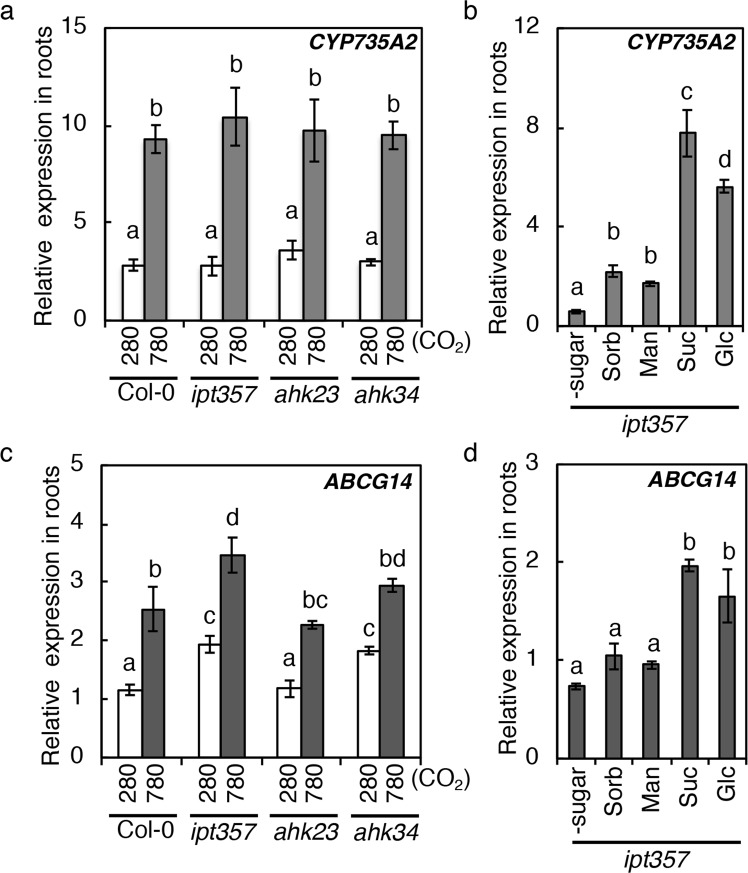
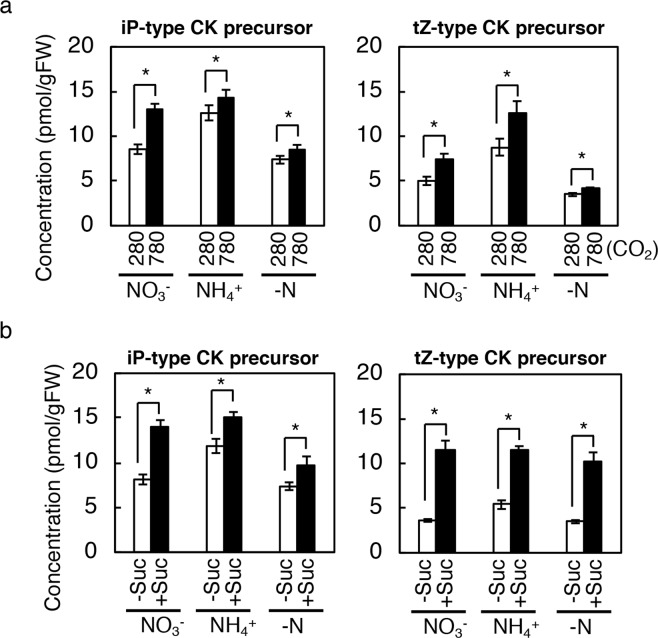
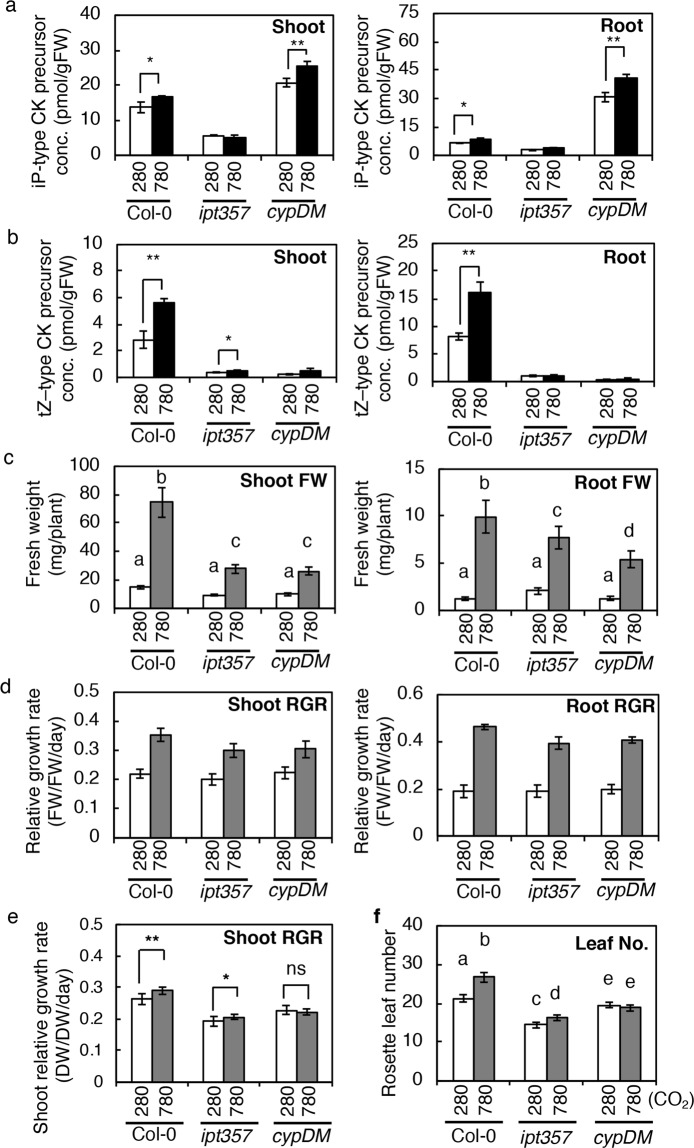
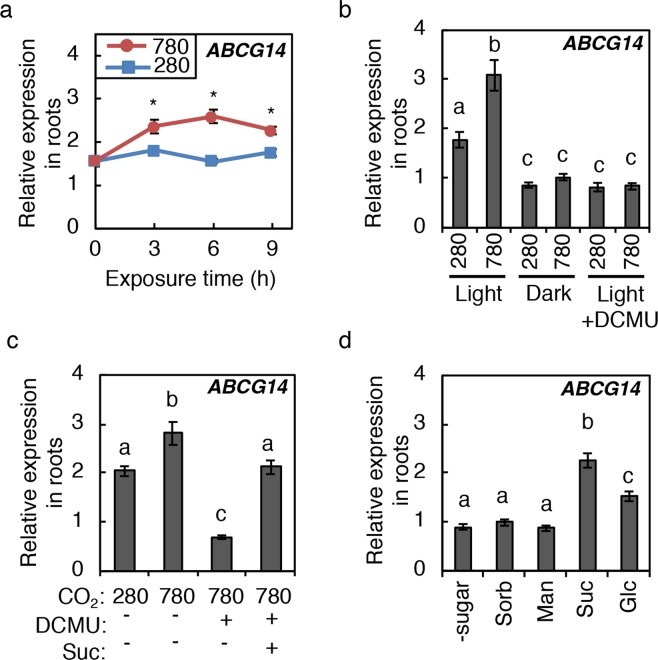
Carbon availability is a major regulatory factor in plant growth and development. Cytokinins, plant hormones that play important roles in various aspects of growth and development, have been implicated in the carbon-dependent regulation of plant growth; however, the details of their involvement remain to be elucidated. Here, we report that sugar-induced cytokinin biosynthesis plays a role in growth enhancement under elevated CO2 in Arabidopsis thaliana. Growing Arabidopsis seedlings under elevated CO2 resulted in an accumulation of cytokinin precursors that preceded growth enhancement. In roots, elevated CO2 induced two genes involved in de novo cytokinin biosynthesis: an adenosine phosphate-isopentenyltransferase gene, AtIPT3, and a cytochrome P450 monooxygenase gene, CYP735A2. The expression of these genes was inhibited by a photosynthesis inhibitor, DCMU, under elevated CO2, and was enhanced by sugar supplements, indicating that photosynthetically generated sugars are responsible for the induction. Consistently, cytokinin precursor accumulation was enhanced by sugar supplements. Cytokinin biosynthetic mutants were impaired in growth enhancement under elevated CO2, demonstrating the involvement of de novo cytokinin biosynthesis for a robust growth response. We propose that plants employ a system to regulate growth in response to elevated CO2 in which photosynthetically generated sugars induce de novo cytokinin biosynthesis for growth regulation.


Conflict of interest statement

The authors declare no competing interests.

Figures

Figure 1
Figure 1
Effects of high CO2 on growth and hormone concentrations in soil-grown plants. Shoot fresh weight (a), concentrations of iP-type cytokinin (CK) precursors and inactivated iP-type CKs (b), concentrations of tZ-type CK precursors and inactivated tZ-type CKs (c), IAA concentration (d), and ABA concentration (e) of Col-0 shoots incubated at 280 ppmv or 780 ppmv CO2 for the indicated periods. Error bars represent standard deviations (a, n = 10; be, n = 8). Asterisks indicate statistically significant differences between 280 ppmv CO2- and 780 ppmv CO2-treated samples at the same exposure time (*p < 0.05; **p < 0.01; Student’s t-test). FW, fresh weight; tZ, trans-zeatin; iP, N6-(2-isopentenyl)adenine; iP-type CK precursor, sum of iPR and iPRPs; inactivated iP-type CK, sum of iP7G and iP9G; tZ-type CK precursor, sum of tZR and tZRPs; inactivated tZ-type CK, sum of tZ7G, tZZ9G, tZOG, tZROG, and tZRPsOG. The concentrations of all quantified hormones are shown in Supplementary Table S1.
Figure 2
Figure 2
Cytokinin levels and activity in seedlings exposed to high CO2. (a,b) Cytokinin (CK) levels in shoots and roots of Col-0 seedlings exposed to low and high CO2. iP-type CK precursor levels (a) and tZ-type CK precursor levels (b) in shoots and roots are presented. (c) Expression levels of type-A ARR genes in Col-0 seedlings exposed to low and high CO2. Transcript levels of ARR4, ARR6, and ARR15 were analysed by quantitative RT-PCR. Expression levels were normalized using At4g34270 as an internal control. Twelve-day-old seedlings grown on 1/2 MS agar plates at 280 ppmv were exposed to 280 ppmv (280) or 780 ppmv (780) CO2 for the indicated periods. Error bars represent standard deviations of three biological replicates. Asterisks indicate statistically significant differences between 280 ppmv CO2- and 780 ppmv CO2-treated samples at the same exposure time (*p < 0.05; **p < 0.01; Student’s t-test). FW, fresh weight; tZ, trans-zeatin; iP, N6-(2-isopentenyl)adenine. The concentrations of cytokinin molecular species are shown in Supplementary Table S2.
Figure 3
Figure 3
Expression of genes involved in cytokinin biosynthesis in shoots and roots upon exposure to high CO2. Transcript levels of AtIPT1, AtIPT3, AtIPT4, AtIPT5, AtIPT6, AtIPT7, AtIPT8, CYP735A1, and CYP735A2 were analysed in shoots (a) and roots (b) of Col-0 seedlings by quantitative RT-PCR. Expression levels of AtIPT4, AtIPT6, and AtIPT8 were below the detection limit in shoots and roots. Expression levels were normalized using At4g34270 as an internal control. Twelve-day-old seedlings grown on 1/2 MS agar plates at 280 ppmv were exposed to 280 ppmv (280) or 780 ppmv (780) CO2 for the indicated periods. Error bars represent standard deviations of three biological replicates. Asterisks indicate statistically significant differences between 280 ppmv CO2- and 780 ppmv CO2-treated samples at the same exposure time (**p < 0.01; *p < 0.05; Student’s t-test).
Figure 4
Figure 4
Effects of photosynthesis and sugars on the expression of AtIPT3 and CYP735A2, and cytokinin levels. (a,b) Effects of dark and DCMU on AtIPT3 (a) and CYP735A2 (b) expression in Col-0 roots. Seedlings were exposed to 280 ppmv or 780 ppmv CO2 under light (Light), under light with 40 µM DCMU (Light + DCMU), or in the dark (Dark). (c,d) AtIPT3 (c) and CYP735A2 (d) expression in Col-0 seedlings treated with 40 µM DCMU in the presence (+) or absence (−) of 90 mM sucrose (Suc) and/or DCMU for six hours. (e,f) Effects of sugars on the expression of AtIPT3 (e) and CYP735A2 (f) in Col-0 roots. Seedlings were incubated on plates with 90 mM sorbitol (Sorb), mannitol (Man), sucrose (Suc), glucose (Glc), with 45 mM sucrose (Suc45), or without sugar (-sugar) for six hours at 280 ppmv CO2 in the dark. (g,h) Changes in cytokinin levels in seedlings treated with sucrose. iP-type CK precursor levels (g) and tZ-type CK precursor levels (h) in shoots and roots are presented. Twelve-day-old seedlings grown on 1/2 MS agar plates at 280 ppmv were treated with 45 mM sucrose (+Suc) or without sucrose (−Suc) at 280 ppmv for 24 h. The concentrations of cytokinin molecular species are shown in Supplementary Table S3. Asterisks indicate statistically significant differences (*p < 0.05; Student’s t-test). Error bars represent standard deviations of four biological replicates. Asterisks indicate statistically significant differences (*p < 0.05; Student’s t-test). Different lower-case letters indicate statistically significant differences as indicated by Tukey’s HSD test (p < 0.05). Expression levels were analysed by quantitative RT-PCR and normalized using At4g34270 as an internal control.
Figure 5
Figure 5
Expression of CYP735A2 and ABCG14 in cytokinin biosynthetic and signaling mutants treated with high CO2 or sugars. (a,c) Wild-type (Col-0), ipt3 ipt5 ipt7 (ipt357), ahk2 ahk3 (ahk23) and ahk3 ahk4 (ahk34) seedlings grown on 1/2MS agar plates at 280 ppmv CO2 for 12 days were exposed to 280 ppmv or 780 ppmv for six hours and then roots were harvested. (b,d) ipt357 seedlings were transferred to new plates containing 90 mM of sorbitol (Sorb), mannitol (Man), sucrose (Suc) or glucose (Glc), or without any sugar (-sugar). Roots were harvested after six hours. Expression levels were analysed by quantitative real-time PCR and normalized using At4g34270 as an internal control. Error bars represent standard deviation of three biological replicates. Different lower-case letters indicate statistically significant differences as indicated by Tukey’s HSD test (p < 0.01).
Figure 6
Figure 6
Cytokinin levels in wild-type seedlings exposed to high CO2 or treated with sucrose under different nitrogen nutrient conditions. (a) Cytokinin (CK) levels in wild-type (Col-0) whole seedlings exposed to low or high CO2 under different nitrogen nutrient conditions. Seedlings were exposed to 280 ppmv (280) or 780 ppmv (780) CO2 for 24 h on modified 1/2 MS agar plates containing 10 mM KNO3 (NO3) or 10 mM NH4Cl (NH4+), or without any nitrogen source (-N). The concentrations of cytokinin molecular species are shown in Supplementary Table S5. (b) Cytokinin levels in wild-type (Col-0) whole seedlings treated with (+Suc) or without (−Suc) 45 mM sucrose for 24 h on modified 1/2 MS agar plates containing 10 mM KNO3 (NO3) or 10 mM NH4Cl (NH4+), or without any nitrogen source (-N). The concentrations of cytokinin molecular species are shown in Supplementary Table S6. Twelve-day-old seedlings grown at 280 ppmv were used. Error bars represent standard deviations of four biological replicates. Asterisks indicate statistically significant differences (*p < 0.05; Student’s t-test). FW, fresh weight; tZ, trans-zeatin; iP, N6-(2-isopentenyl)adenine.
Figure 7
Figure 7
Cytokinin levels and growth of wild-type, ipt3 ipt5 ipt7 and cyp735a1 cyp735a2 seedlings exposed to high CO2. (a,b) The concentration of iP-type cytokinin (CK) precursors (a) and tZ-type CK precursors (b) in shoots and roots of wild-type (Col-0), ipt3 ipt5 ipt7 (ipt357) and cyp735a1 cyp735a2 (cypDM) plants exposed to 280 ppmv (280) or 780 ppmv (780) CO2 for 24 h. Asterisks indicate statistically significant differences (**p < 0.01; *p < 0.05; Student’s t-test). The concentrations of cytokinin molecular species are shown in Supplementary Table S7. (c,d) Fresh-weight (c) and relative growth rate (RGR) (d) of 19-day-old wild type (Col-0), ipt3 ipt5 ipt7 (ipt357), and cyp735a1 cyp735a2 (cypDM) seedlings treated under 280 ppmv (280) or 780 ppmv (780) CO2 for seven days. (d) RGR was calculated using the fresh weight (FW) data obtained previously (Supplementary Fig. S5) and after (c) low or high CO2 treatment. (e,f) Shoot growth of soil-grown wild-type, ipt3 ipt5 ipt7 and cyp735a1 cyp735a2 plants under low or high CO2. (e) Relative growth rates (RGR) of shoots of Col-0, ipt357, and cypDM grown under 280 or 780 on soil. Dry weights of shoots shown in Supplementary Fig. 6b were used to calculate the RGR. Asterisks indicate statistically significant differences (**p < 0.001; *p < 0.01; not significant (ns), p > 0.01; two-way ANOVA). (f) Rosette leaf number of Col-0, ipt357, and cypDM counted at 31 DAG. Error bars represent standard deviations (a, n = 3; b, n = 3; c, n = 9; f, n = 10) and standard error (d, n = 9; e, n = 9). Lower-case letters denote statistically significant classes (Tukey’s HSD test, p < 0.05).
Figure 8
Figure 8
Effects of high CO2, photosynthesis and sugars on the expression of ABCG14 in roots. (a) Expression levels of ABCG14 in roots of Col-0 seedlings exposed to 280 ppmv (280) or 780 ppmv (780) CO2 for the indicated periods. Treatment was conducted as in Fig. 3. (b) Effects of dark and DCMU on ABCG14 in Col-0 roots. Treatments were conducted as in Fig. 4. (c,d) Effects of sugars on ABCG14 in Col-0 roots. Treatments were conducted as in Fig. 4. Expression levels were analysed by quantitative RT-PCR and normalized using At4g34270 as an internal control. Error bars represent standard deviations of four biological replicates. Asterisks indicate statistically significant differences (*p < 0.05; Student’s t-test). Different lower-case letters indicate statistically significant differences as indicated by Tukey’s HSD test (p < 0.05).

References

    1. Mason MG, Ross JJ, Babst BA, Wienclaw BN, Beveridge CA. Sugar demand, not auxin, is the initial regulator of apical dominance. Proc. Natl. Acad. Sci. USA. 2014;111:6092–6097. doi: 10.1073/pnas.1322045111. - DOI - PMC - PubMed
    1. Kiba T, Kudo T, Kojima M, Sakakibara H. Hormonal control of nitrogen acquisition: roles of auxin, abscisic acid, and cytokinin. J. Exp. Bot. 2011;62:1399–1409. doi: 10.1093/jxb/erq410. - DOI - PubMed
    1. Oka-Kira E, Kawaguchi M. Long-distance signaling to control root nodule number. Curr. Opin. Plant Biol. 2006;9:496–502. doi: 10.1016/j.pbi.2006.07.012. - DOI - PubMed
    1. Kircher S, Schopfer P. Photosynthetic sucrose acts as cotyledon-derived long-distance signal to control root growth during early seedling development in Arabidopsis. Proc. Natl. Acad. Sci. USA. 2012;109:11217–11221. doi: 10.1073/pnas.1203746109. - DOI - PMC - PubMed
    1. Osugi A, Sakakibara H. Q&A: How do plants respond to cytokinins and what is their importance? BMC Biol. 2015;13:102. doi: 10.1186/s12915-015-0214-5. - DOI - PMC - PubMed

Publication types

MeSH terms