. 2019 May 23;9(1):7759.
doi: 10.1038/s41598-019-44330-z.

Mood induction alters attention toward negative-positive stimulus pairs in sheep

Affiliations

Mood induction alters attention toward negative-positive stimulus pairs in sheep

Camille M C Raoult et al. Sci Rep. .

Abstract

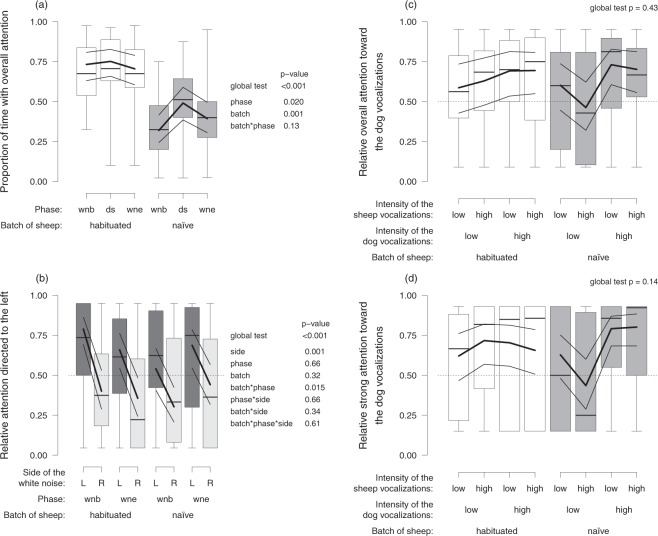
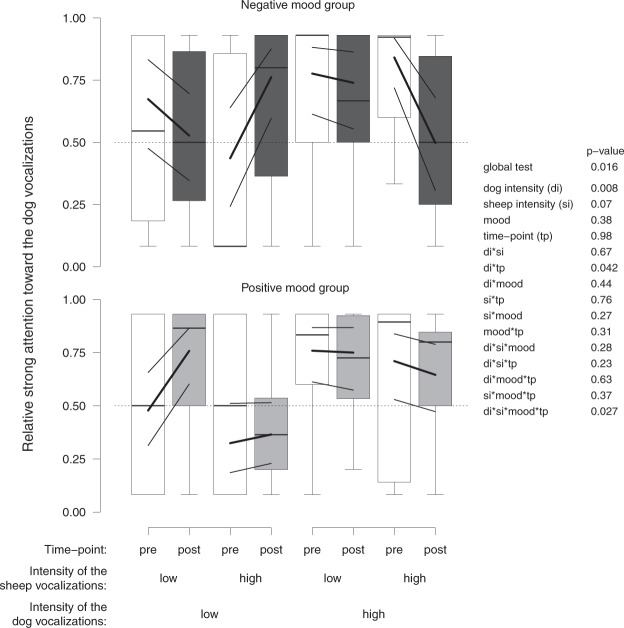
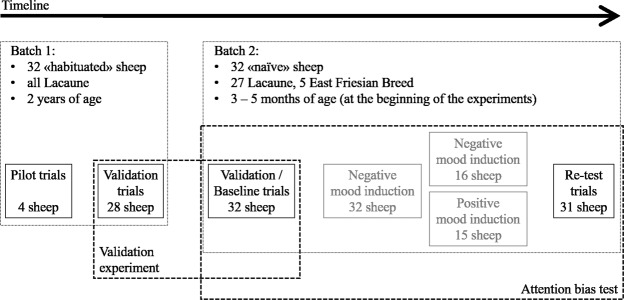
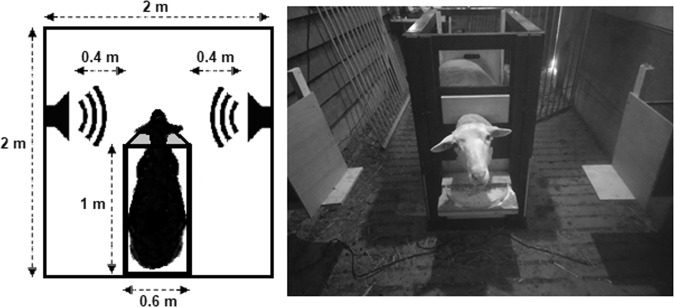
Mood is a lasting affective state that influences motivation and decision-making by pre-shaping a subject's expectations (pessimism/optimism). Mood states affect biases in judgment, memory, and attention. Due to a lack of verbal report, assessing mood in non-human animals is challenging and is often compromised by intense training sessions. Measuring mood using attentional biases can circumvent this problem, as it takes advantage of observing a spontaneous reaction. As in humans, we expected that negative mood will heighten attention toward negative compared to positive stimuli. Here, we validate measures of attention toward acoustic stimuli in sheep (N = 64) and assess sheep's differential attention toward acoustic stimuli before and after mood induction (N = 32). Mood was induced by manipulating the environment. We used animal vocalizations (dog barking and sheep bleating as negative and positive stimuli, respectively) varying in intensity and played simultaneously from one side each, and measured lateral attention based on the sheep's behavior. Overall results were somewhat ambiguous. Yet, negative mood sheep seemed to shift their attention more toward dog vocalizations when the stimulus pair was well balanced at baseline. Though some adaptations are still needed, our approach could be a promising alternative to measure animals' mood without prior training.


Conflict of interest statement

The authors declare no competing interests.

Figures

Figure 1
Figure 1
Sheep pay attention toward acoustic stimuli. (a) Proportion of time with sheep’s overall attention during the different phases, i.e. toward the white noise (wnb beginning, wne end) and the dog/sheep vocalizations (ds) depending on the batch of sheep (habituated, naïve). (b) Relative attention directed to the left when the white noise was played from the left or right side (L, R) for each phase of the white noise presentation (wnb beginning, wne end) and the batch of sheep (habituated, naïve). (c) Relative overall attention and (d) relative strong attention directed toward the dog vocalizations depending on the intensity of the sheep and dog vocalizations (low, high) and the batch of sheep (habituated, naïve). Statistical information is given for each model. Boxplots indicate data range, median, as well as lower and upper quartiles. Thick black lines are the model estimates, and thin black lines are the 95% confidence intervals of the maximum model (including the main effects and interactions).
Figure 2
Figure 2
Changes in strong attention from pre to post mood induction. Relative strong attention directed to the dog vocalizations depending on the intensity of the sheep and dog vocalizations (low, high), the mood group (negative, positive), and the time-point (pre/post mood induction). Statistical information is given. Boxplots indicate data range, median, as well as lower and upper quartiles. The white, dark-grey and light-grey boxplots represent the attention pre mood induction, post negative mood induction and post positive mood induction, respectively. Thick black lines are the model estimates, and thin black lines are the 95% confidence intervals of the maximum model (including the main effects and interactions).
Figure 3
Figure 3
Scheme presenting the number of animals in the different steps of the study, the sequence of the different types of trials and the combinations of trials used in the evaluation.
Figure 4
Figure 4
Scheme (top-view; left) and photograph (right) of a sheep in the feeding station used for the presentation of the acoustic stimuli.

References

    1. Eldar E, Rutledge RB, Dolan RJ, Niv Y. Mood as Representation of Momentum. Trends Cogn Sci. 2016;20:15–24. doi: 10.1016/j.tics.2015.07.010. - DOI - PMC - PubMed
    1. Nettle D, Bateson M. The evolutionary origins of mood and its disorders. Curr Biol. 2012;22:R712–721. doi: 10.1016/j.cub.2012.06.020. - DOI - PubMed
    1. Gygax LW. liking, and welfare: The role of affective states in proximate control of behaviour in vertebrates. Ethology. 2017;123:689–704. doi: 10.1111/eth.12655. - DOI
    1. Mendl M, Burman OHP, Parker RMA, Paul ES. Cognitive bias as an indicator of animal emotion and welfare: Emerging evidence and underlying mechanisms. Appl Anim Behav Sci. 2009;118:161–181. doi: 10.1016/j.applanim.2009.02.023. - DOI
    1. Raoult CMC, Moser J, Gygax L. Mood as cumulative expectation mismatch: A test of theory based on data from non-verbal cognitive bias tests. Front Psychol. 2017;8:2197. doi: 10.3389/fpsyg.2017.02197. - DOI - PMC - PubMed

Publication types