. 2019 May 23;9(1):7744.
doi: 10.1038/s41598-019-44255-7.

Seed targeted RNAi-mediated silencing of GmMIPS1 limits phytate accumulation and improves mineral bioavailability in soybean

Affiliations

Seed targeted RNAi-mediated silencing of GmMIPS1 limits phytate accumulation and improves mineral bioavailability in soybean

Awadhesh Kumar et al. Sci Rep. .

Abstract

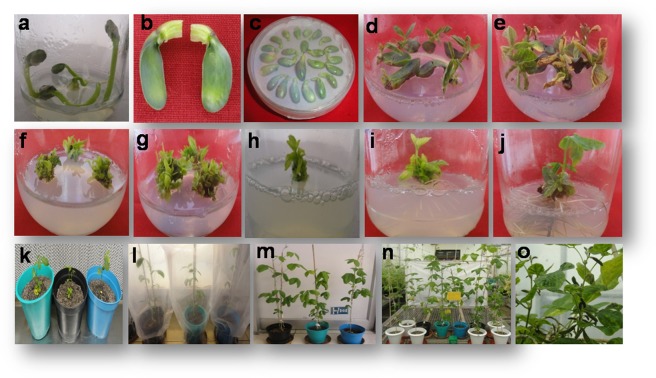
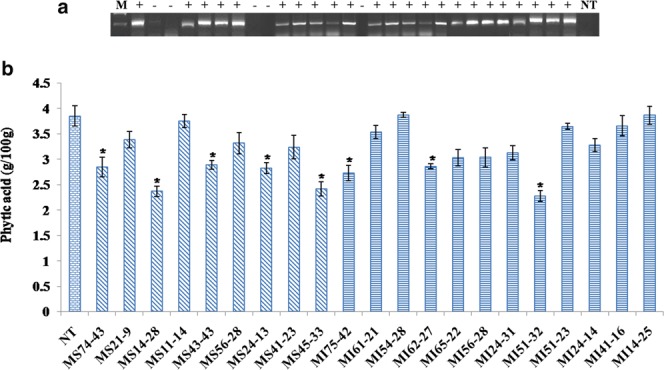
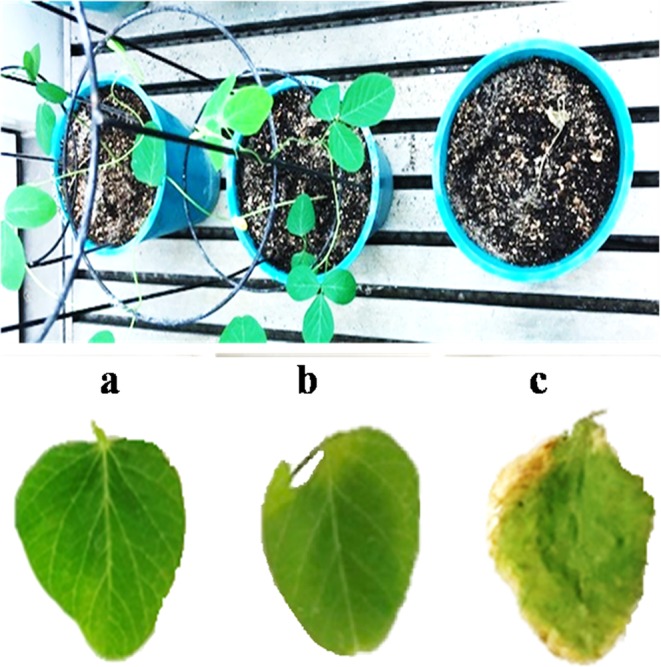
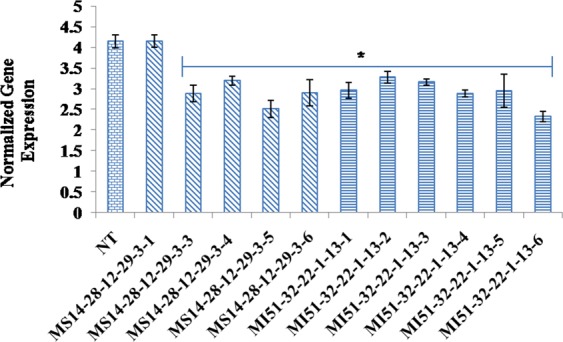
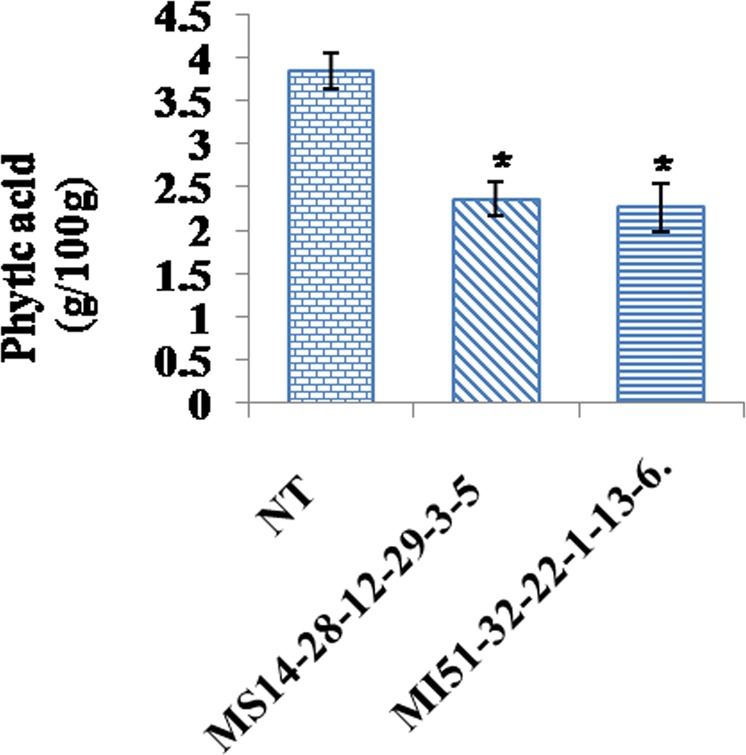
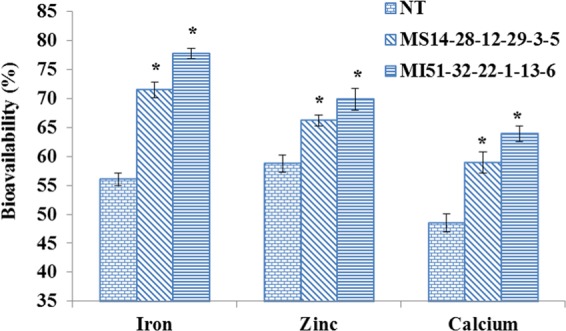
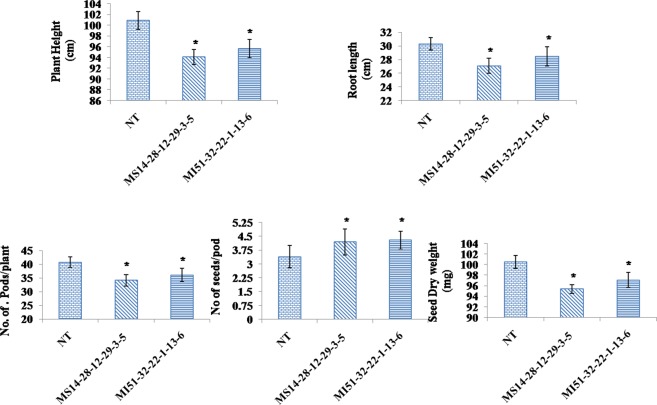
Phytic acid (PA), the major phosphorus reserve in soybean seeds (60-80%), is a potent ion chelator, causing deficiencies that leads to malnutrition. Several forward and reverse genetics approaches have ever since been explored to reduce its phytate levels to improve the micronutrient and phosphorous availability. Transgenic technology has met with success by suppressing the expression of the PA biosynthesis-related genes in several crops for manipulating their phytate content. In our study, we targeted the disruption of the expression of myo-inositol-3-phosphate synthase (MIPS1), the first and the rate limiting enzyme in PA biosynthesis in soybean seeds, by both antisense (AS) and RNAi approaches, using a seed specific promoter, vicilin. PCR and Southern analysis revealed stable integration of transgene in the advanced progenies. The transgenic seeds (T4) of AS (MS14-28-12-29-3-5) and RNAi (MI51-32-22-1-13-6) soybean lines showed 38.75% and 41.34% reduction in phytate levels respectively, compared to non-transgenic (NT) controls without compromised growth and seed development. The electron microscopic examination also revealed reduced globoid crystals in the Protein storage vacoules (PSVs) of mature T4 seeds compared to NT seed controls. A significant increase in the contents of Fe2+ (15.4%, 21.7%), Zn2+ (7.45%, 11.15%) and Ca2+ (10.4%, 15.35%) were observed in MS14-28-12-29-3-5 and MI51-32-22-1-13-6 transgenic lines, respectively, compared to NT implicating improved mineral bioavailability. This study signifies proof-of-concept demonstration of seed-specific PA reduction and paves the path towards low phytate soybean through pathway engineering using the new and precise editing tools.


Conflict of interest statement

The authors declare no competing interests.

Figures

Figure 1
Figure 1
Linear and circular map of pBIN-MIPS ihp construct. Restriction digestion of pBIN-MIPS ihp; Lane1: λ EcoRI + HindIII marker, Lane2: ~12 kb binary vector fragment and ~2 kb MIPS1 ihp fragment, Lane3: 1 kb ladder.
Figure 2
Figure 2
Linear and circular map of pBIN-MIPS AS. MIPS1 ORF (~1.5 kb) region introduced in antisense orientation under vicilin promoter at BamHI/XbaI site. Restriction digestion of pBIN-MIPSAS; Lane1: λ-EcoRI/HindIII marker, Lane2: BamHI/XbaI restriction showing ~12.5 kb binary vector fragment and ~1.5 kb MIPS1 antisense fragment, Lane3: PCR amplification of MIPS1 from pBIN-MIPS AS, Lane4: 1 kb ladder.
Figure 3
Figure 3
Colony PCR for screening positive colonies harboring constructs. (A) Colony PCR of Agrobacterium with Bar and MIPSAS specific primers showing ~500 bp bar gene and ~1.5 kb MIPS gene amplification. (B) Colony PCR of Agrobacterium with bar and MIPS ihp specific primers showing ~500 bp bar gene and ~750 bp MIPS fragments amplification.
Figure 4
Figure 4
A modified cotyledonary-node method using glufosinate as the selection agent. Figure (aj): Seedling grown in germination, shoot induction, shoot elongation medium with glufosinate selection and finally transferred into rooting medium. Figure (ko): Plantlets were hardened in sterilized pot mix in the tissue culture facility shifted to greenhouse where plants acclimatized and reached maturity level.
Figure 5
Figure 5
Screening of transgenic plants (A) using bar gene specific primers (B) based on phytate content. Phytate content in non-transgenic control (NT) and in T1 transgenic seeds were analyzed. The symbol *Indicates significant differences at p = 0.05 (n = 3).
Figure 6
Figure 6
Leaf painting assay with glufosinate. Transgenic plants (a: AS; b: RNAi) showed resistance to Basta® (100 mg/L) on 5th days compared with NT control (c).
Figure 7
Figure 7
Expression analysis of transgenic rice plants. qRT-PCR analysis of T4 progenies of lines MS14-28-12-29-3-5, MI51-32-22-1-13-6. (NT = non-transgenic controls).
Figure 8
Figure 8
Southern blot analysis of T4 progenies (MS14-28-12-29-3-5 and MI51-32-22-1-13-6). Each line consist of 10 μg genomic DNA, digested with XhoI. The position and sizes of markers are indicated (NTC = Non-transgenic control).
Figure 9
Figure 9
Analysis of seed phytate content in non transgenic control (NTC) and transgenics (T4). Phytate content of transgenic seeds (MS14-28-12-29-3-5 and MI51-32-22-1-13-6) compared to NTC seeds showed significant differences (P < 0.05).
Figure 10
Figure 10
Electron microscopic analysis of NT and transgenic (T4) seeds. (a) Cotyledon sections of NTC (b) MS14-28-12-29-3-5 (c) MI51-32-22-1-13-6 lines. Phytin globoid (PG) cavities are the small white circular areas. (PSV-Protein storage vacoules; CW- Cell wall; LB-lipid bodies).
Figure 11
Figure 11
Bioavailability of metal ions in NT and transgenics (T4). Bioavailability of divalent minerals (Fe2+, Zn2+ and Ca2+) using in vivo simulation model showed significant (P < 0.05) increase in Transgenics (MS14-28-12-29-3-5 and MI51-32-22-1-13-6) compared to NT control.
Figure 12
Figure 12
Various parameters considered for agronomic evaluation of T4 transgenic plants grown in green house. Values are mean ± SE, n = 10 (P ≤ 0.002).

References

    1. Raboy V, Dickinson DB, Below FE. Variation in seed total phosphorus, phytic acid, zinc, calcium, magnesium, and protein among lines of Glycine max and G. soja. Crop Sci. 1984;24:431–434.
    1. Ali N, et al. Development of low phytate rice by RNAi mediated seed-specific silencing of inositol 1,3,4,5,6-pentakisphosphate 2-kinase gene (IPK1) PLoS ONE. 2013;8(7):1–12. - PMC - PubMed
    1. Kumar A, Kumar V, Lal SK, Jolly M, Sachdev A. Influence of gamma rays and ethyl methane sulphonate (EMS) on the levels of phytic acid, raffinose family oligosaccharides and antioxidants in soybean seeds of different genotypes. J. Plant Biochem. Biotechnol. 2015;24:204–209.
    1. Wilcox JR, Premachandra GS, Young KA, Raboy V. Isolation of high seed inorganic P, low phytate soybean mutants. Crop Sci. 2000;40:1601–1605.
    1. Zhou JR, Erdman JW., Jr. Phytic acid in health and disease. Crit. Rev. Food. Sci. Nutr. 1995;35:495–508. - PubMed

Publication types

MeSH terms